

mHealth in Sub-Saharan Africa and Europe: Context of current health, healthcare status, and demographic structure
- PMID: 37284013
- PMCID: PMC10240874
- DOI: 10.1177/20552076231178420
mHealth in Sub-Saharan Africa and Europe: Context of current health, healthcare status, and demographic structure
Abstract
Introduction: The advent of digital systems and global mobile phone availability presents an opportunity for better healthcare access and equity. However, the disparity in the usage and availability of mHealth systems between Europe and Sub-Saharan Africa (SSA) has not been explored in relation to current health, healthcare status, and demographics.
Objective: This study aimed to compare mHealth system availability and use in SSA and Europe in the above-mentioned context.
Methods: The study analyzed health, healthcare status, and demographics in both regions. It assessed mortality, disease burden, and universal health coverage. A systematic narrative review was conducted to thoroughly assess available data on mHealth availability and use, guiding future research in the field.
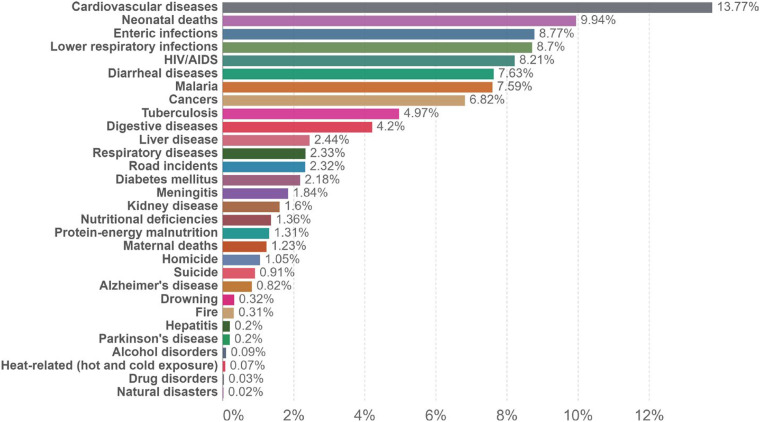
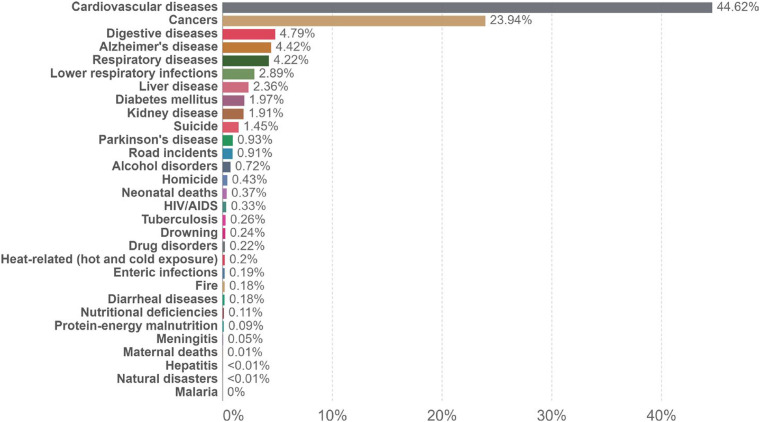
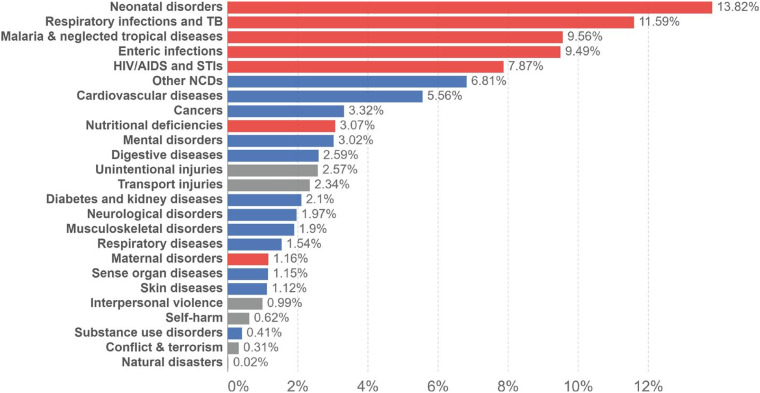
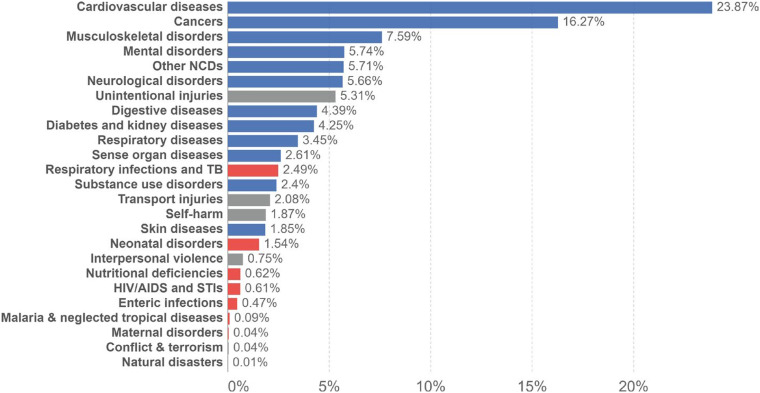
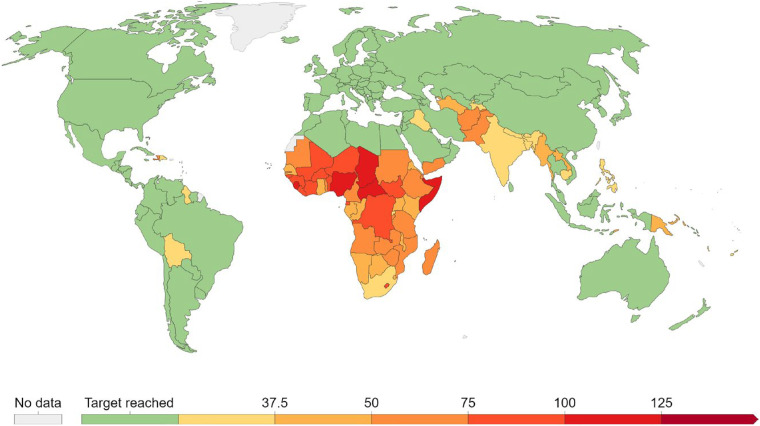
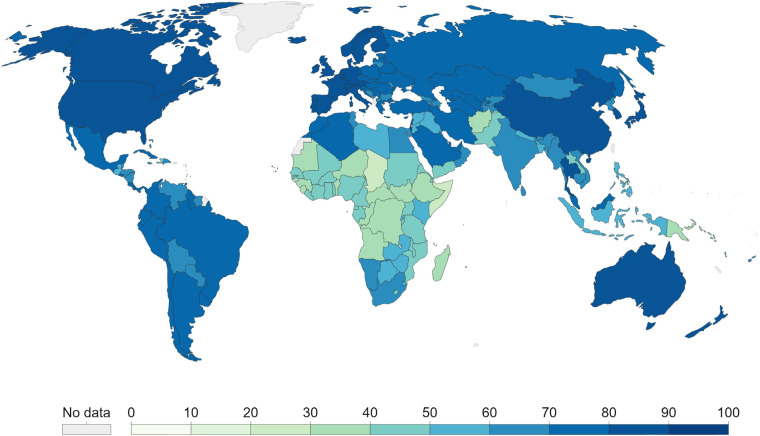
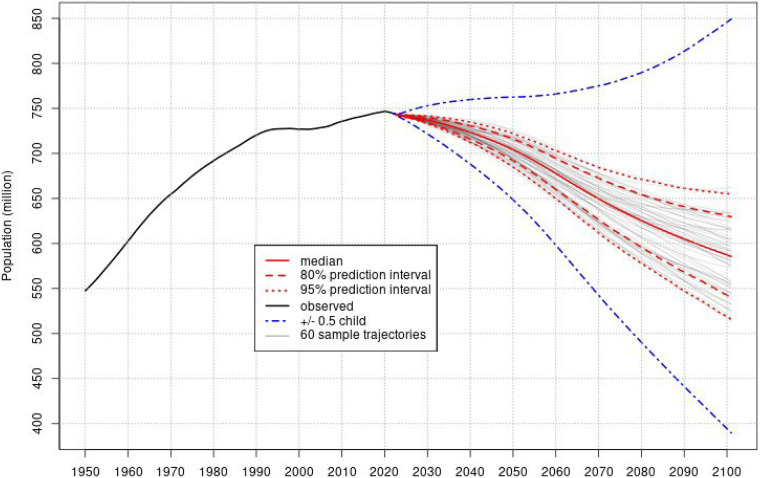
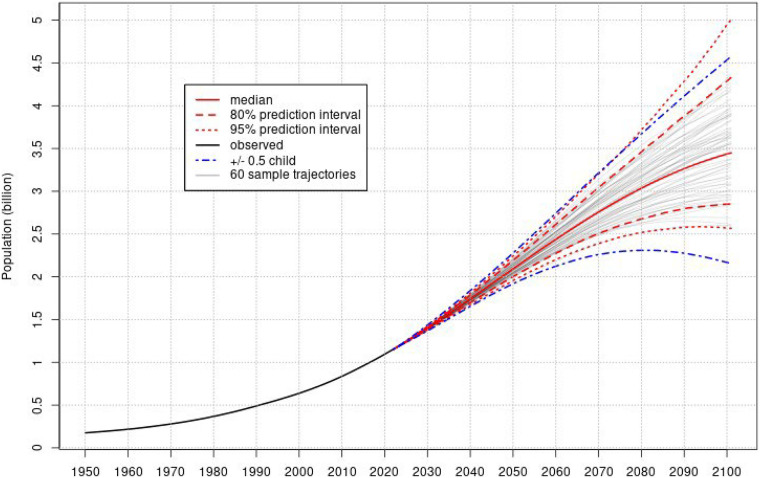
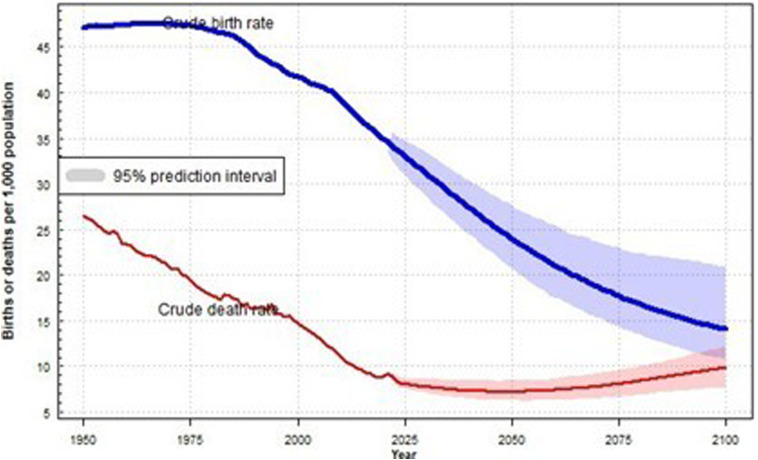
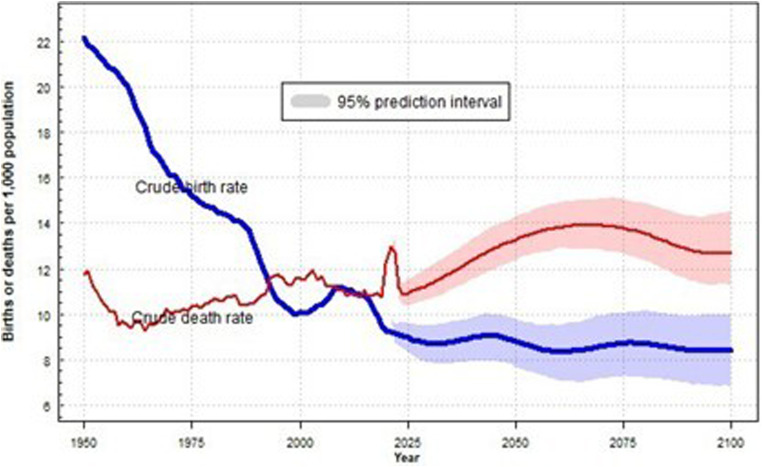
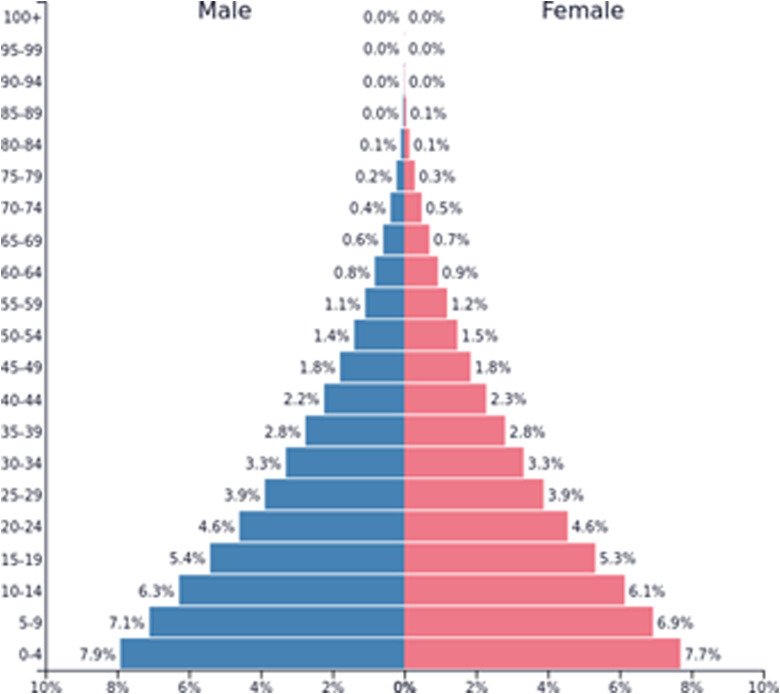
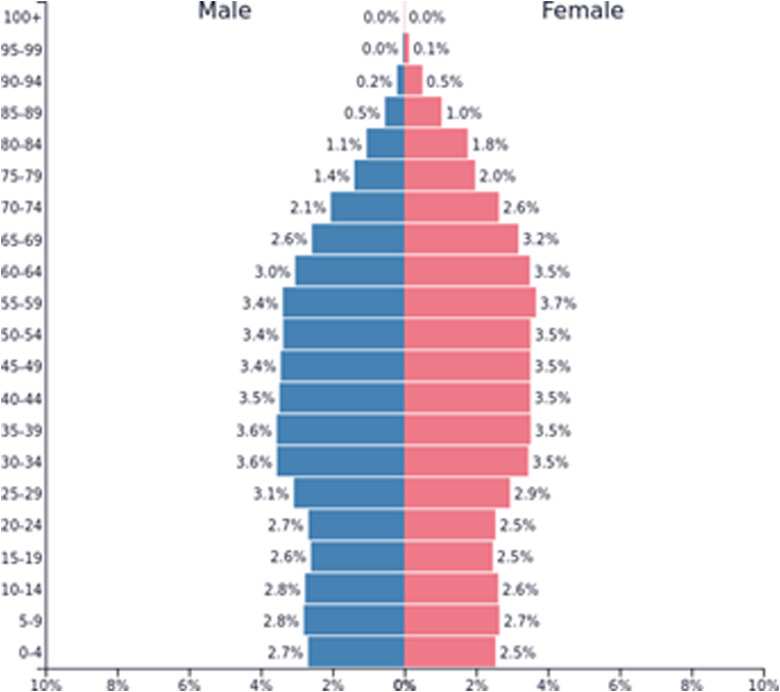
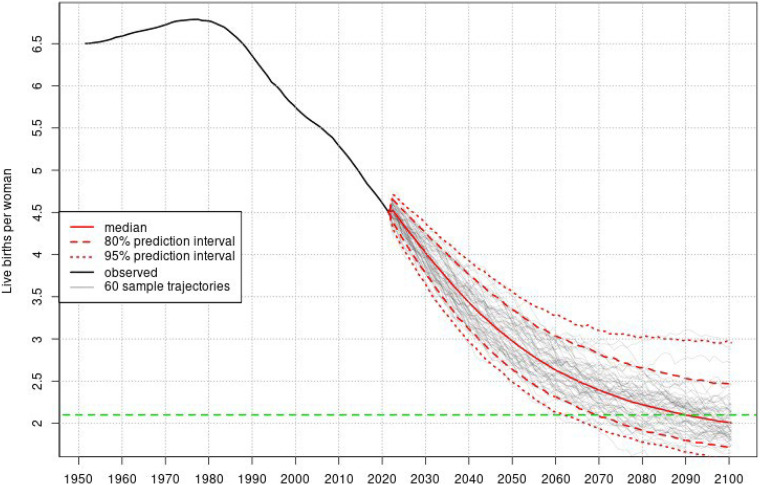
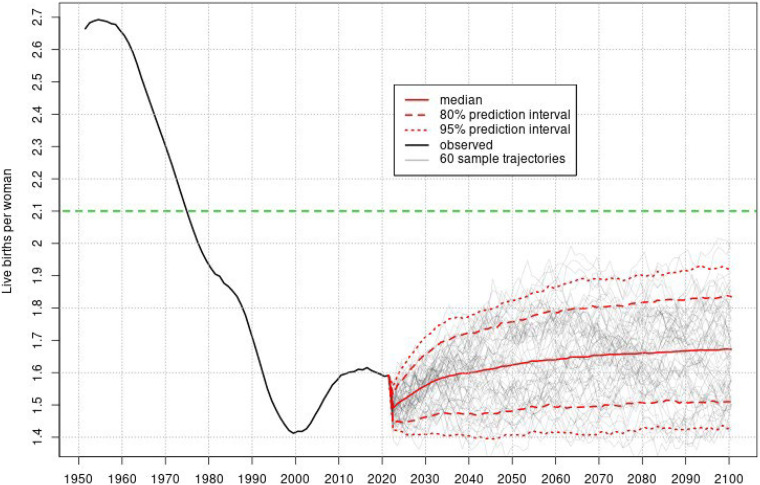
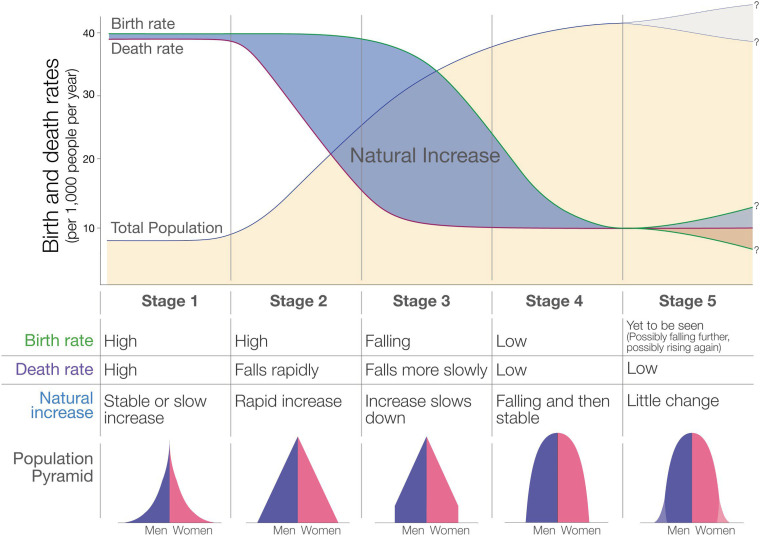
Results: SSA is on the verge of stages 2 and 3 in the demographic transition with a youthful population and high birth rate. Communicable, maternal, neonatal, and nutritional diseases contribute to high mortality and disease burden, including child mortality. Europe is on the verge of stages 4 and 5 in the demographic transition with low birth and death rates. Europe's population is old, and non-communicable diseases (NCDs) pose major health challenges. The mHealth literature adequately covers cardiovascular disease/heart failure, and cancer. However, it lacks approaches for respiratory/enteric infections, malaria, and NCDs.
Conclusions: mHealth systems in SSA are underutilized than in Europe, despite alignment with the region's demographics and major health issues. Most initiatives in SSA lack implementation depth, with only pilot tests or small-scale implementations. Europe's reported cases highlight actual implementation and acceptability, indicating a strong implementation depth of mHealth systems.
Keywords: Demography; Europe; Sub-Saharan Africa; healthcare; mHealth.
© The Author(s) 2023.
Conflict of interest statement
The author(s) declared no potential conflicts of interest with respect to the research, authorship, and/or publication of this article.
Figures
Similar articles
-
mHealth in sub-Saharan Africa and Europe: A systematic review comparing the use and availability of mHealth approaches in sub-Saharan Africa and Europe.Digit Health. 2023 Jun 21;9:20552076231180972. doi: 10.1177/20552076231180972. eCollection 2023 Jan-Dec. Digit Health. 2023. PMID: 37377558 Free PMC article. Review.
-
A realist review of mobile phone-based health interventions for non-communicable disease management in sub-Saharan Africa.BMC Med. 2017 Feb 6;15(1):24. doi: 10.1186/s12916-017-0782-z. BMC Med. 2017. PMID: 28162090 Free PMC article. Review.
-
Mapping mHealth (mobile health) and mobile penetrations in sub-Saharan Africa for strategic regional collaboration in mHealth scale-up: an application of exploratory spatial data analysis.Global Health. 2017 Aug 22;13(1):63. doi: 10.1186/s12992-017-0286-9. Global Health. 2017. PMID: 28830540 Free PMC article.
-
Implementation of mHealth to support cancer diagnosis in Sub-Saharan Africa: A systematic review.Afr J Prim Health Care Fam Med. 2025 Mar 5;17(1):e1-e13. doi: 10.4102/phcfm.v17i1.4683. Afr J Prim Health Care Fam Med. 2025. PMID: 40171699 Free PMC article.
-
Cardiovascular Diseases in Sub-Saharan Africa Compared to High-Income Countries: An Epidemiological Perspective.Glob Heart. 2020 Feb 12;15(1):15. doi: 10.5334/gh.403. Glob Heart. 2020. PMID: 32489788 Free PMC article. Review.
Cited by
-
Associations between text communication engagement and maternal-neonatal outcomes in the Mobile WACh NEO Trial.PLOS Digit Health. 2025 Aug 7;4(8):e0000968. doi: 10.1371/journal.pdig.0000968. eCollection 2025 Aug. PLOS Digit Health. 2025. PMID: 40773418 Free PMC article.
-
Feasibility and acceptability of wearable devices and daily diaries to assess sleep and other health indicators among young women in the slums of Kampala, Uganda.Digit Health. 2024 Oct 18;10:20552076241288754. doi: 10.1177/20552076241288754. eCollection 2024 Jan-Dec. Digit Health. 2024. PMID: 39430703 Free PMC article.
-
Review of Genetic and Artificial Intelligence approaches to improving Gestational Diabetes Mellitus Screening and Diagnosis in sub-Saharan Africa.Yale J Biol Med. 2024 Mar 29;97(1):67-72. doi: 10.59249/ZBSC2656. eCollection 2024 Mar. Yale J Biol Med. 2024. PMID: 38559462 Free PMC article. Review.
-
Navigating the digital landscape: challenges and advancements in fostering a one health approach through humanity-centered design in mobile health.One Health. 2025 Jun 16;21:101108. doi: 10.1016/j.onehlt.2025.101108. eCollection 2025 Dec. One Health. 2025. PMID: 40612687 Free PMC article.
-
Burden of colorectal cancer attributable to diet low in milk among middle-aged and elderly population from 1990 to 2021: a population-based study.Aging Clin Exp Res. 2025 Jul 22;37(1):228. doi: 10.1007/s40520-025-03129-x. Aging Clin Exp Res. 2025. PMID: 40696191 Free PMC article.
References
-
- UN. List of MDGs English—UN. 2015;2015. Available from: www.un.org/millenniumgoals
-
- Ritchie H, Roser M. Now it is possible to take stock – did the world achieve the Millennium Development Goals? Our World Data, 2018.
-
- DESA. Sustainable development. history. New York, USA: United Nations Dep Econ Soc Aff, 2022.
-
- National Academy of Sciences. Defining and measuring population health. Washington (DC): National Academies Press (US), 2010. Available from: https://www.ncbi.nlm.nih.gov/books/NBK53336/#!po=98.8636
Publication types
LinkOut - more resources
Full Text Sources
Research Materials
