

Development of a novel copper metabolism-related risk model to predict prognosis and tumor microenvironment of patients with stomach adenocarcinoma
- PMID: 37284310
- PMCID: PMC10241246
- DOI: 10.3389/fphar.2023.1185418
Development of a novel copper metabolism-related risk model to predict prognosis and tumor microenvironment of patients with stomach adenocarcinoma
Abstract
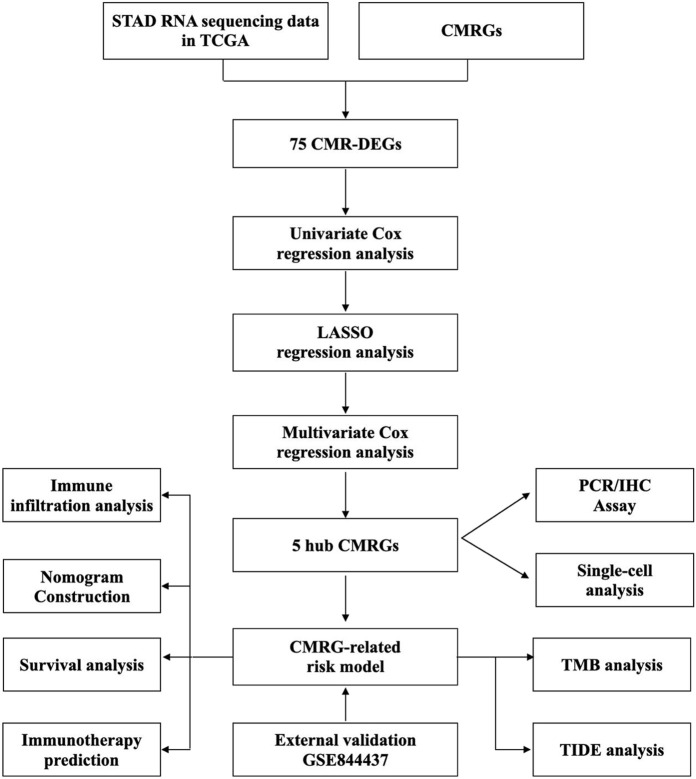
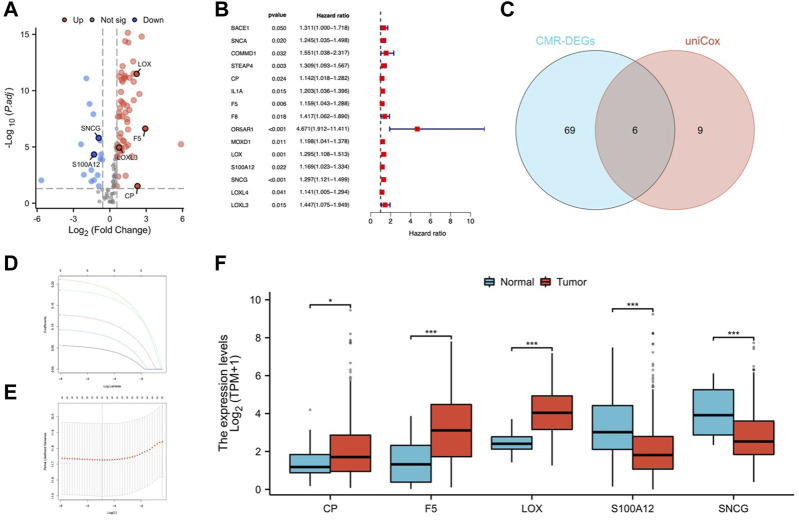
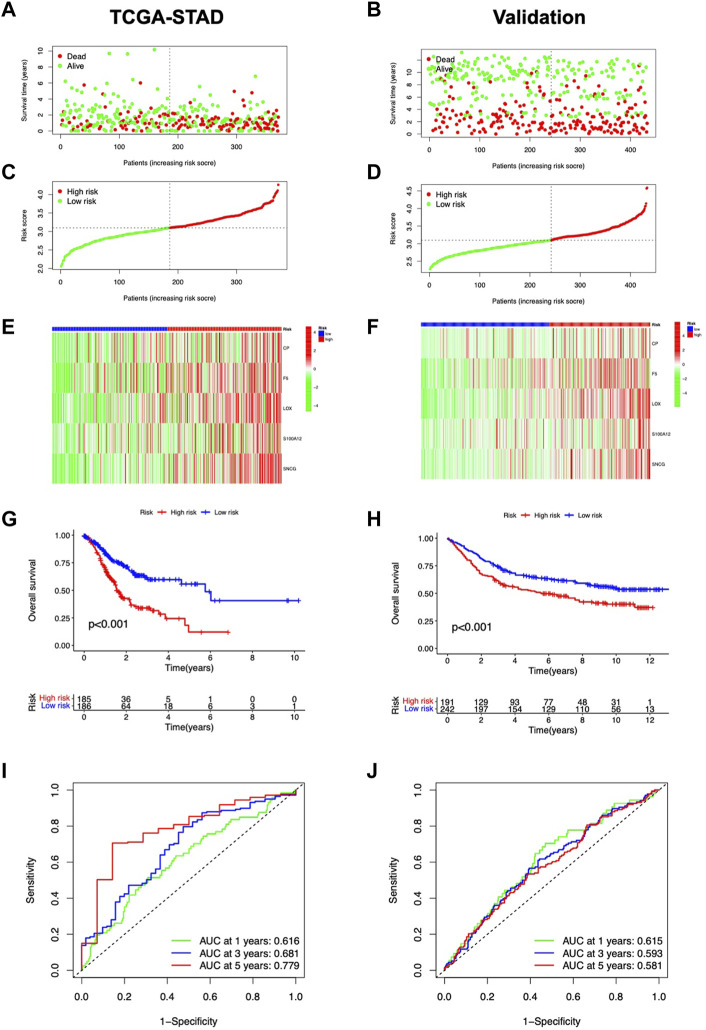
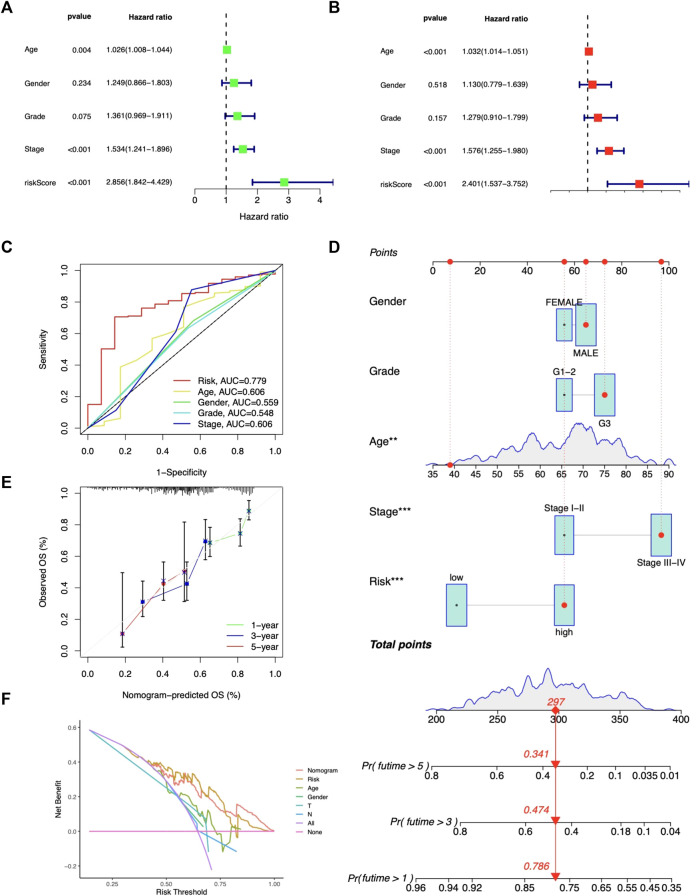
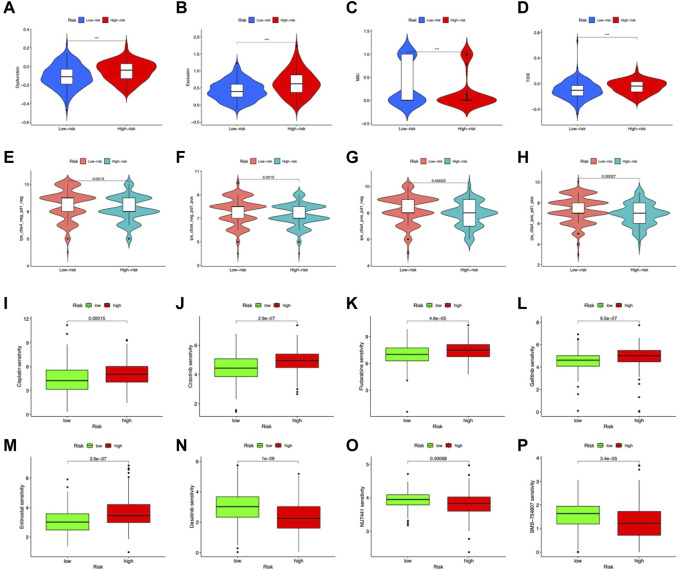
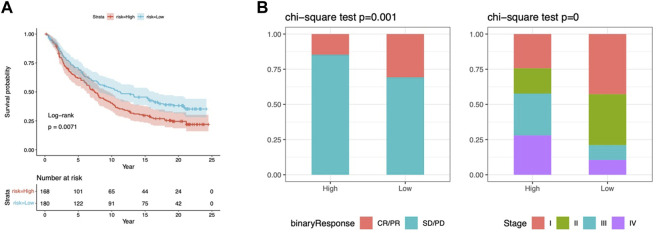
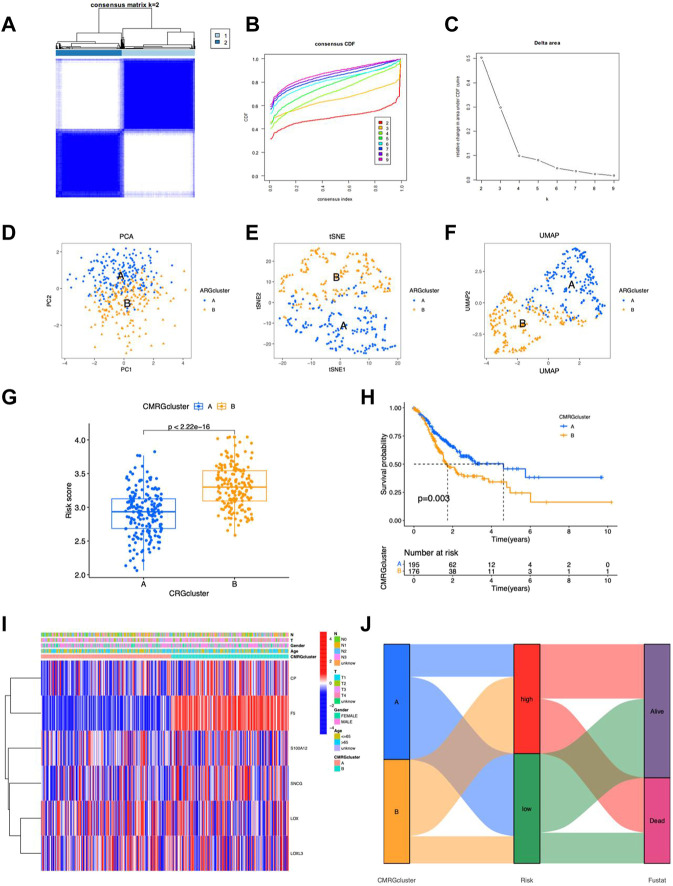
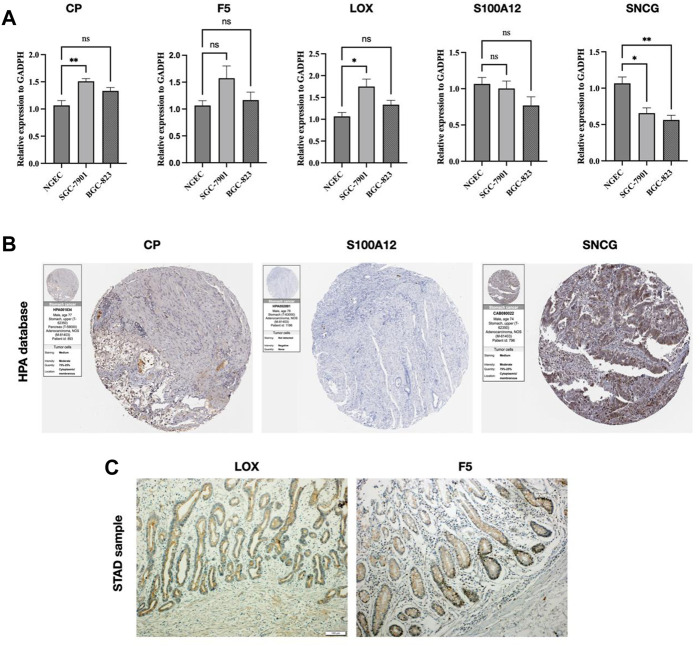
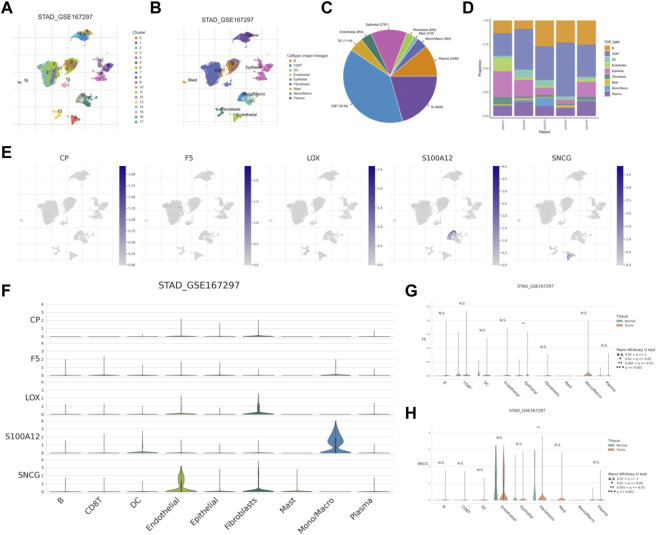
Background: Stomach adenocarcinoma (STAD) is the fourth highest cause of cancer mortality worldwide. Alterations in copper metabolism are closely linked to cancer genesis and progression. We aim to identify the prognostic value of copper metabolism-related genes (CMRGs) in STAD and the characteristic of the tumor immune microenvironment (TIME) of the CMRG risk model. Methods: CMRGs were investigated in the STAD cohort from The Cancer Genome Atlas (TCGA) database. Then, the hub CMRGs were screened out with LASSO Cox regression, followed by the establishment of a risk model and validated by GSE84437 from the Expression Omnibus (GEO) database. The hub CMRGs were then utilized to create a nomogram. TMB (tumor mutation burden) and immune cell infiltration were investigated. To validate CMRGs in immunotherapy response prediction, immunophenoscore (IPS) and IMvigor210 cohort were employed. Finally, data from single-cell RNA sequencing (scRNA-seq) was utilized to depict the properties of the hub CMRGs. Results: There were 75 differentially expressed CMRGs identified, 6 of which were linked with OS. 5 hub CMRGs were selected by LASSO regression, followed by construction of the CMRG risk model. High-risk patients had a shorter life expectancy than those low-risk. The risk score independently predicted STAD survival through univariate and multivariate Cox regression analyses, with ROC calculation generating the highest results. This risk model was linked to immunocyte infiltration and showed a good prediction performance for STAD patients' survival. Furthermore, the high-risk group had lower TMB and somatic mutation counters and higher TIDE scores, but the low-risk group had greater IPS-PD-1 and IPS-CTLA4 immunotherapy prediction, indicating a higher immune checkpoint inhibitors (ICIs) response, which was corroborated by the IMvigor210 cohort. Furthermore, those with low and high risk showed differential susceptibility to anticancer drugs. Based on CMRGs, two subclusters were identified. Cluster 2 patients had superior clinical results. Finally, the copper metabolism-related TIME of STAD was concentrated in endothelium, fibroblasts, and macrophages. Conclusion: CMRG is a promising biomarker of prognosis for patients with STAD and can be used as a guide for immunotherapy.
Keywords: IMvigor210; biomarkers; copper; copper metabolism-related genes; immunotherapy; prognosis; single-cell RNA sequencing.
Copyright © 2023 Sun, Zhang and Zhang.
Conflict of interest statement
The authors declare that the research was conducted in the absence of any commercial or financial relationships that could be construed as a potential conflict of interest.
Figures
Similar articles
-
Development of a copper metabolism-related gene signature in lung adenocarcinoma.Front Immunol. 2022 Nov 29;13:1040668. doi: 10.3389/fimmu.2022.1040668. eCollection 2022. Front Immunol. 2022. PMID: 36524120 Free PMC article.
-
Amino acid metabolism-related genes as potential biomarkers and the role of MATN3 in stomach adenocarcinoma: A bioinformatics, mendelian randomization and experimental validation study.Int Immunopharmacol. 2024 Dec 25;143(Pt 1):113253. doi: 10.1016/j.intimp.2024.113253. Epub 2024 Sep 30. Int Immunopharmacol. 2024. PMID: 39353384
-
Construction of store-operated calcium entry-related gene signature for predicting prognosis and indicates immune microenvironment infiltration in stomach adenocarcinomas.Sci Rep. 2024 Sep 27;14(1):22342. doi: 10.1038/s41598-024-73324-9. Sci Rep. 2024. PMID: 39333689 Free PMC article.
-
Identification of copper metabolism-related subtypes and establishment of the prognostic model in ovarian cancer.Front Endocrinol (Lausanne). 2023 Mar 6;14:1145797. doi: 10.3389/fendo.2023.1145797. eCollection 2023. Front Endocrinol (Lausanne). 2023. PMID: 36950684 Free PMC article.
-
Identification and characterization of nucleotide metabolism and neuroendocrine regulation-associated modification patterns in stomach adenocarcinoma with auxiliary prognostic assessment and immunotherapy response prediction.Front Endocrinol (Lausanne). 2023 Jan 16;13:1076521. doi: 10.3389/fendo.2022.1076521. eCollection 2022. Front Endocrinol (Lausanne). 2023. PMID: 36726460 Free PMC article. Review.
Cited by
-
Cuproplasia-related gene signature: Prognostic insights for glioma therapy.Neurooncol Adv. 2024 Dec 23;7(1):vdae233. doi: 10.1093/noajnl/vdae233. eCollection 2025 Jan-Dec. Neurooncol Adv. 2024. PMID: 39896073 Free PMC article.
-
Development of an immune-related diagnostic predictive model for oral lichen planus.Medicine (Baltimore). 2024 Mar 15;103(11):e37469. doi: 10.1097/MD.0000000000037469. Medicine (Baltimore). 2024. PMID: 38489725 Free PMC article.
References
-
- ATP (2023). Transporters, chaperones, and P-type ATPases controlling grapevine copper homeostasis - PubMed . https://pubmed.ncbi.nlm.nih.gov/26054906/(Accessed March 1, 2023). - PubMed
LinkOut - more resources
Full Text Sources