. 2023 May 2;7(4):100171.
doi: 10.1016/j.rpth.2023.100171. eCollection 2023 May.

Preventing swarm detection in extracellular vesicle flow cytometry: a clinically applicable procedure

Affiliations

Preventing swarm detection in extracellular vesicle flow cytometry: a clinically applicable procedure

Naomi C Buntsma et al. Res Pract Thromb Haemost. .

Abstract

Background: Flow cytometry is commonly used to detect cell-derived extracellular vesicles in body fluids such as blood plasma. However, continuous and simultaneous illumination of multiple particles at or below the detection limit may result in the detection of a single event. This phenomenon is called swarm detection and leads to incorrect particle concentration measurements. To prevent swarm detection, sample dilution is recommended. Since the concentration of particles differs between plasma samples, finding the optimal sample dilution requires dilution series of all samples, which is unfeasible in clinical routine.

Objectives: Here we developed a practical procedure to find the optimal sample dilution of plasma for extracellular vesicle flow cytometry measurements in clinical research studies.

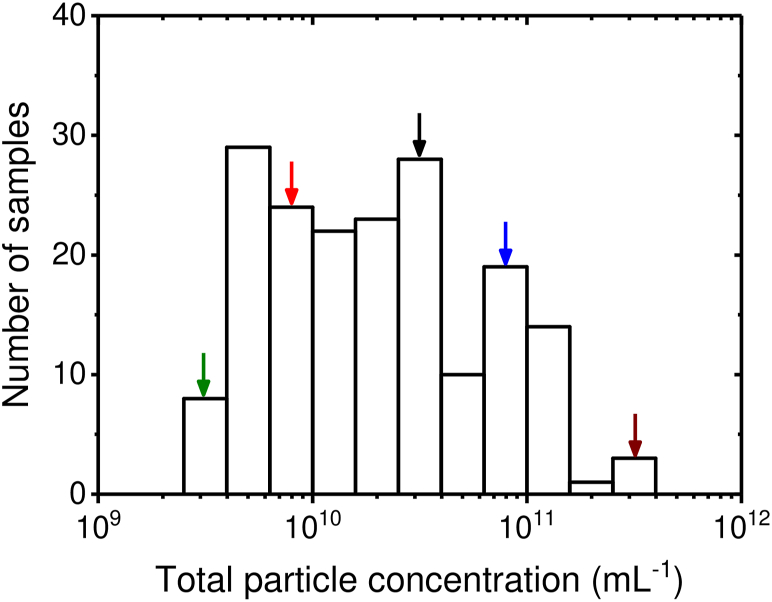
Methods: Dilution series of 5 plasma samples were measured with flow cytometry (Apogee A60-Micro), triggered on side scatter. The total particle concentration between these plasma samples ranged from 2.5 × 10⁹ to 2.1 × 10¹¹ mL-1.

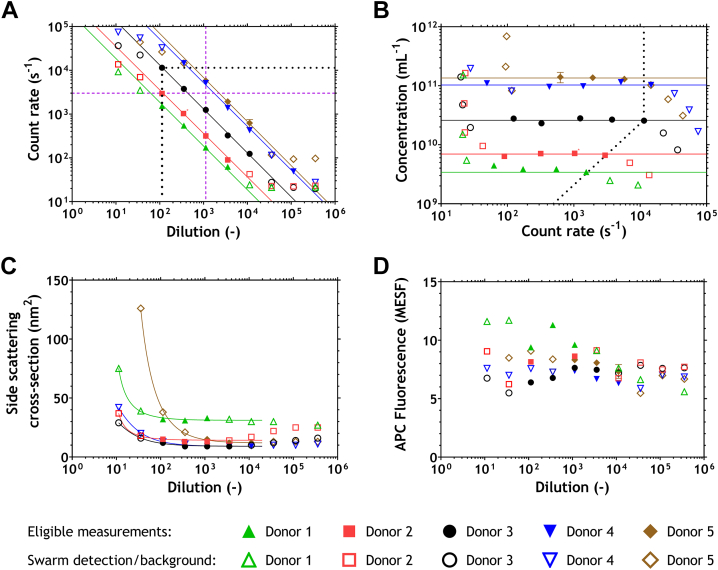
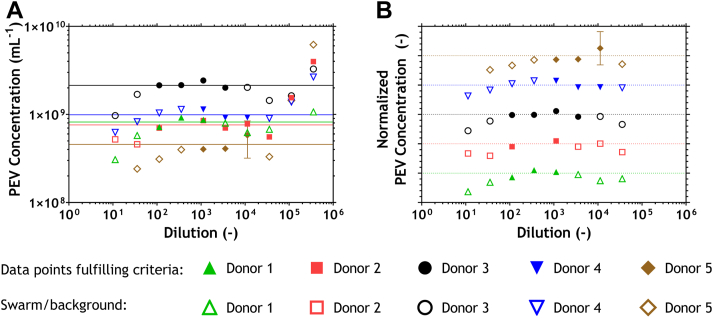
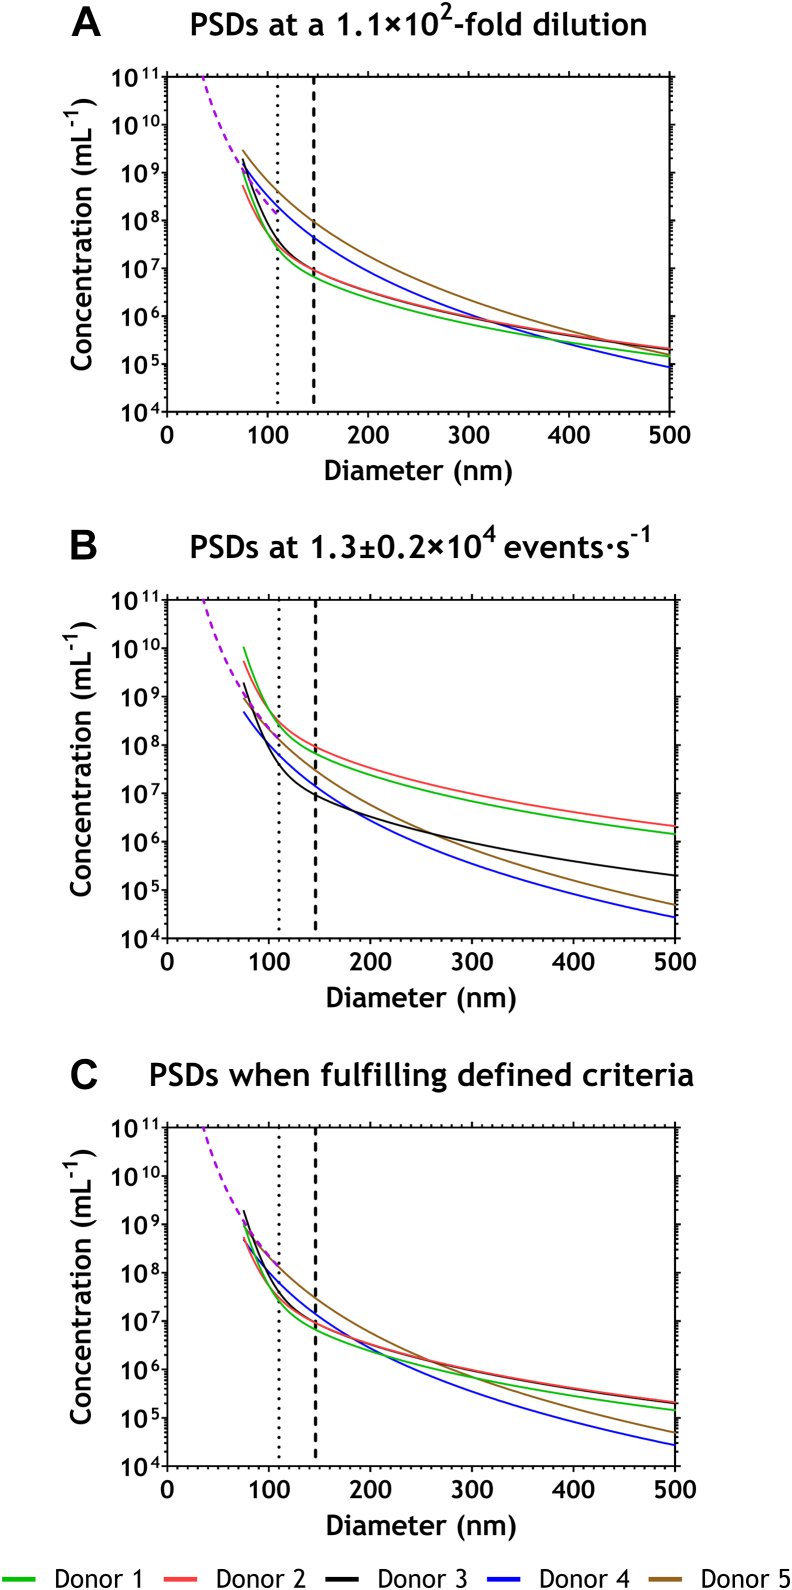
Results: Swarm detection was absent in plasma samples when diluted ≥1.1 × 10³-fold or at particle count rates <3.0 × 10³ events·s-1. Application of either one of these criteria, however, resulted in insignificant particle counts in most samples. The best approach to prevent swarm detection while maintaining significant particle counts was by combining minimal dilution with maximum count rate.

Conclusion: To prevent swarm detection in a series of clinical samples, the measurement count rate of a single diluted plasma sample can be used to determine the optimal dilution factor. For our samples, flow cytometer, and settings, the optimal dilution factor is ≥1.1 × 10²-fold, while the count rate is <1.1 × 10⁴ events·s-1.

Keywords: biomarkers; exosomes; extracellular vesicles; flow cytometry; plasma.


Figures

Figure 1
Figure 1
Distribution of the total particle concentration of samples from the clinical research study AFFECT EV (antiplatelet therapy effect on extracellular vesicles; n = 181). The concentration was determined by flow cytometry (Apogee A60-Micro) and reflects the number of particles exceeding a side scatter cross-section of 10 nm2. The concentrations differed 93-fold among these samples. The arrows indicate the samples that will be used in this study.
Figure 2
Figure 2
Flow cytometry data of 5 selected samples, indicating particles exceeding a side scattering cross-section of 6 nm2. In panels A and B, data were fitted on the first 3 data points that exceed a count rate of 1.5 × 102 events·s−1. Open symbols resemble data points that deviate >20% from the fit lines. (A) Count rate (events·s−1) plotted vs the dilution factor, fitted with a linear function (lines; slope, −1; R2, 0.94, 0.94, 0.99, 0.99, and 0.97 for donors 1 to 5, respectively). Open data points on the left are affected by swarm detection, while those on the right are attributed to background counts. Purple dashed lines visualize a count rate of 3.0 ×·103 events·s−1 (horizontal) and a dilution of 1.1 × 103-fold (vertical). Measurements exceeding a dilution of 1.1 × 102-fold and below a count rate of 1.1 × 104 events·s−1 are unaffected by swarm detection (black dotted line). (B) Total particle concentration plotted vs the count rate (events·s−1), fitted with a horizontal line. Open symbols on the left are attributed to background events (<1.5 × 102 events·s−1), while open data points on the right area are affected by swarm detection. The black dotted line represents a 1.1 × 102-fold dilution and a count rate of 1.1 × 104 events·s−1 and distinguishes eligible measurements from those affected by swarm detection. (C) Median side scattering cross-section (nm2) plotted vs the dilution factor, fitted with a reciprocal function (+ offset) on data points <2 × 104-fold diluted. Open symbols do not fulfill the defined criteria represented by the black lines in panels A and B. Measurements of donor 1 were performed in another time frame than the measurements of donors 2 to 5, thereby affecting the median side scattering cross-section. (D) Median fluorescence on the APC detector plotted vs the dilution factor. APC, allophycocyanin; MESF, molecules of equivalent soluble fluorophore.
Figure 3
Figure 3
Flow cytometry data of 5 selected samples, indicating particles exceeding a side scatter cross-section of 6 nm2, having a diameter <1000 nm, and exceeding 61 molecules of equivalent soluble fluorophore for CD61-APC–labeled particles. Filled data points meet the criteria of being diluted ≥1.1 × 102-fold and having a count rate below 1.1 × 104 events·s−1. (A) PEV concentration vs dilution, in which the filled data points were fitted with a horizontal line. (B) Measured PEV concentration normalized to the mean concentration derived from the fit in panel A and plotted vs the dilution. Data of each donor are separated with an offset of 1. Horizontal lines indicate a ratio of 1, meaning that the measured concentration equals the mean concentration, while minor tick marks indicate a 20% deviation from the mean concentration. APC, allophycocyanin; PEV, platelet-derived extracellular vesicle.
Figure 4
Figure 4
Microfluidic resistive pulse sensing data of selected samples visualizing the fits of the particle size distribution (PSD) with a bin width of 10 nm. Data were acquired at a single dilution and fitted with a third-order polynomial function; fitted data were then adjusted for dilution factors used during the flow cytometry experiment. Plots start from 75 nm, which is the lower limit of detection (LoD) for the microfluidic resistive pulse sensing measurements. The LoD for the flow cytometer is indicated with dotted lines for lipoproteins (110 nm) and with dashed lines for extracellular vesicles (146 nm). The purple, dashed diagonal line indicates the particle concentrations below the LoD of the flow cytometer needed to trigger swarm detection. (A) PSDs at a total dilution of 1.1 × 102-fold for all samples. (B) PSDs at a count rate of 1.3 ± 0.2 × 104 events·s−1, representing total dilutions of 11-fold for donors 1 and 2, 1.1 × 102-fold for donor 3, and 3.6 × 102-fold for donors 4 and 5. (C) PSDs when samples fulfill defined criteria to prevent swarm detection, representing a total dilution of 1.1 × 102-fold for donors 1, 2, and 3 and 3.6 × 102-fold (count rate, 1.3 ± 0.2 × 104 events·s−1) for donors 4 and 5.

References

    1. Dickhout A., Koenen R.R. Extracellular vesicles as biomarkers in cardiovascular disease; chances and risks. Front Cardiovasc Med. 2018;5:113. - PMC - PubMed
    1. van der Pol E., Sturk A., van Leeuwen T., Nieuwland R., Coumans F., ISTH-SSC-VB Working Group Standardization of extracellular vesicle measurements by flow cytometry through vesicle diameter approximation. J Thromb Haemost. 2018;16:1236–1245. - PubMed
    1. Lacroix R., Robert S., Poncelet P., Kasthuri R.S., Key N.S., Dignat-George F. Standardization of platelet-derived microparticle enumeration by flow cytometry with calibrated beads: results of the International Society on Thrombosis and Haemostasis SSC Collaborative workshop. J Thromb Haemost. 2010;8:2571–2574. - PubMed
    1. Nolan J.P., Duggan E. Analysis of individual extracellular vesicles by flow cytometry. Methods Mol Biol. 2018;1678:79–92. - PubMed
    1. Arraud N., Linares R., Tan S., Gounou C., Pasquet J.M., Mornet S., Brisson A.R. Extracellular vesicles from blood plasma: determination of their morphology, size, phenotype and concentration. J Thromb Haemost. 2014;12:614–627. - PubMed

LinkOut - more resources