. 2023 Aug:95:102422.
doi: 10.1016/j.econedurev.2023.102422. Epub 2023 Jun 1.

School closures and effective in-person learning during COVID-19

Affiliations

School closures and effective in-person learning during COVID-19

André Kurmann et al. Econ Educ Rev. 2023 Aug.

Abstract

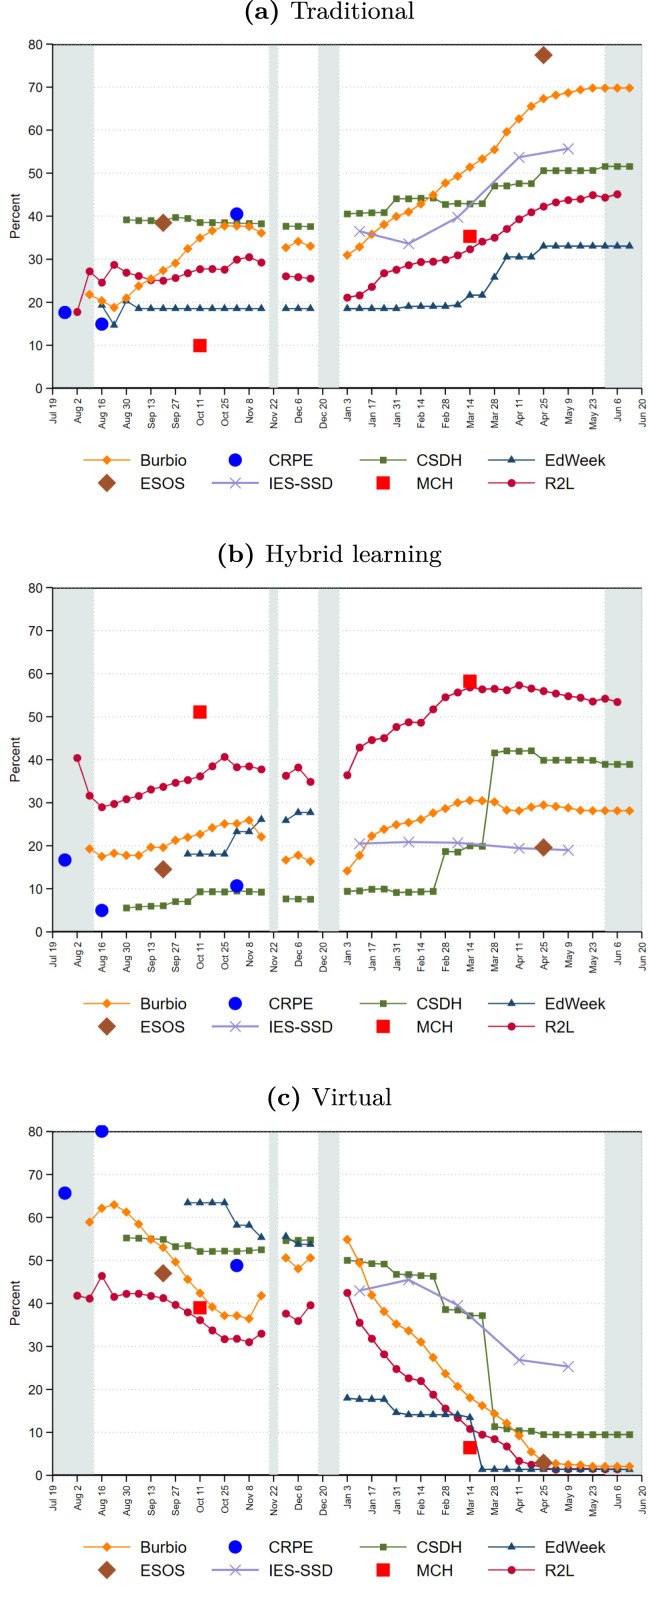
We document large temporal and geographical discrepancies among prominent trackers that measure in-person, hybrid, and remote schooling in the U.S. during COVID-19. We then propose a new measure of effective in-person learning (EIPL) that combines information on schooling modes with cell phone data on school visits and estimate it for a large, representative sample of U.S. public and private schools. The EIPL measure, which we make publicly available, resolves the discrepancies across trackers and is more suitable for many quantitative questions. Consistent with other studies, we find that a school's share of non-white students and pre-pandemic grades and size are associated with less in-person learning during the 2020-21 school year. Notably, we also find that EIPL was lower for schools in more affluent and educated localities with higher pre-pandemic spending and more emergency funding per student. These results are in large part accounted for by systematic regional differences, in particular political preferences.

Keywords: COVID-19; Effective in-person learning; Inequality; School closures and reopenings.


Conflict of interest statement

I declare that I have no relevant or material financial interests that relate to the research described in this paper.

Figures

Fig. 1
Fig. 1
Comparison of schooling mode trackers. Notes: The figures show the average share of each schooling mode according to each of the trackers, weighted by public school student enrollment at either the school, district, county, or state level. The schooling mode trackers are: Burbio, the Center on reinventing public education (CRPE), the COVID-19 school data hub (CSDH), Education Week (EdWeek), the Elementary school operating status (ESOS) database, the School survey dashboard of the Institute of Education Sciences (IES-SSD), MCH strategic data (MCH), and Return2Learn (R2L). The shaded regions denote the Summer, Winter, and Thanksgiving breaks.
Fig. 2
Fig. 2
Regional disparities in effective in-person learning. Notes: The top panel shows the student-weighted average county EIPL from September 2020 to May 2021 by different percentile ranges for all counties for which we have reliable data on at least three schools. The bottom panel shows the top-10 and bottom-10 Core-Based Statistical Areas (CBSAs) in terms of average EIPL among the 50 largest CBSAs by population. EIPL for each CBSA is computed as the student-weighted average across schools with reliable data.
Fig. 3
Fig. 3
Effective in-person learning by local affluence, education, family structure, and race. Notes: The figures show binned scatterplots of average EIPL from September 2020 to May 2021 for public schools and private schools, respectively, by (a) zip-code average household income, (b) zip-code average share of household with a college degree or higher, (c) zip-code share of dual-headed households, and (d) school share of non-white students. Observations are weighted by the school-specific sampling weight described in the appendix.
Fig. 4
Fig. 4
The relationship of effective in-person learning with school and local characteristics. Notes: The figure shows the estimated coefficients and 95% confidence intervals of regressing weekly school EIPL from September 2020 to May 2021 on the different variables. The sample consists of approximately 60,000 public schools. The brown square-shaped estimates show the results of univariate regressions of EIPL on the listed variable only, controlling for school type (charter vs. non-charter school) and school grade (elementary vs. middle vs. high. vs. combined school). The yellow diamond-shaped estimates show the results of multivariate regressions of EIPL, controlling for the other variables in panel (a) and panel (b). The red round-shaped estimates show the result of adding the variables in panel (c) to the multivariate regressions together with pre-pandemic ICU bed capacity, two-week lagged county COVID case and death rates, dummies for various other non-pharmaceutical interventions, maximum weekly temperature in the county, county population density, and rural/urban area indicators. All variables except for the “Mask required in public” indicator are scaled so that the estimates show the implied change in EIPL of going from the 25th percentile to the 75th percentile of the distribution of a variable. All regressions are weighted with standard errors clustered at the county level and school weights calculated as explained in the appendix.

References

    1. Agostinelli Francesco, Doepke Matthias, Sorrenti Giuseppe, Zilibotti Fabrizio. When the great equalizer shuts down: Schools, peers, and parents in pandemic times. Journal of Public Economics. 2022;206 - PMC - PubMed
    1. Amuedo-Dorantes Catalina, Marcén Miriam, Morales Marina, Sevilla Almudena. Schooling and parental labor supply: Evidence from COVID-19 school closures in the United States. Industrial and Labor Relations Review. 2023;76(1):56–85. - PMC - PubMed
    1. Bravata Dena, Cantor Jonathan H, Sood Neeraj, Whaley Christopher M. National Bureau of Economic Research; 2021. Back to school: The effect of school visits during COVID-19 on COVID-19 transmission: NBER working paper 28645.
    1. Camp Andrew M., Zamarro Gema. Determinants of ethnic differences in school modality choices during the COVID-19 crisis. Educational Researcher. 2022;51(1):6–16.
    1. Chernozhukov Victor, Kasahara Hiroyuki, Schrimpf Paul. The association of opening K-12 schools and colleges with the spread of COVID-19 in the United States: County-level panel data analysis. Proceedings of the National Academy of Sciences. 2021;118(42) - PMC - PubMed

LinkOut - more resources