. 2023 Jun 7;80(7):177.
doi: 10.1007/s00018-023-04822-8.

siRNA screening reveals that SNAP29 contributes to exosome release

Affiliations

siRNA screening reveals that SNAP29 contributes to exosome release

Nina Pettersen Hessvik et al. Cell Mol Life Sci. .

Abstract

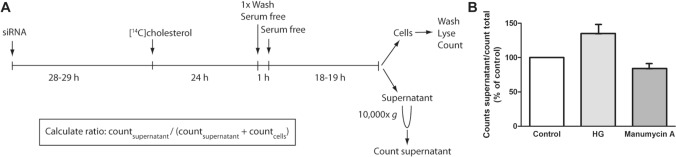
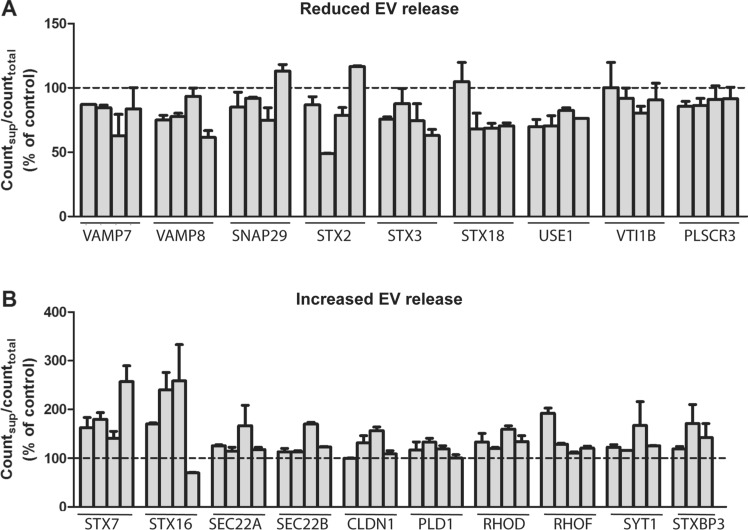
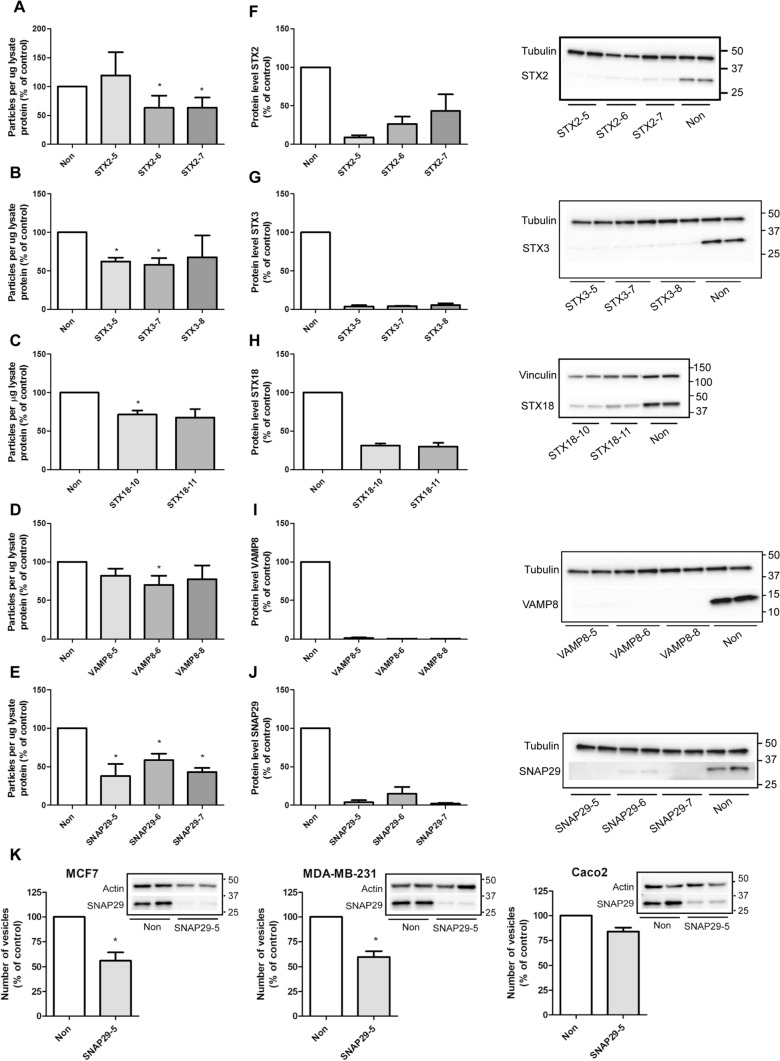
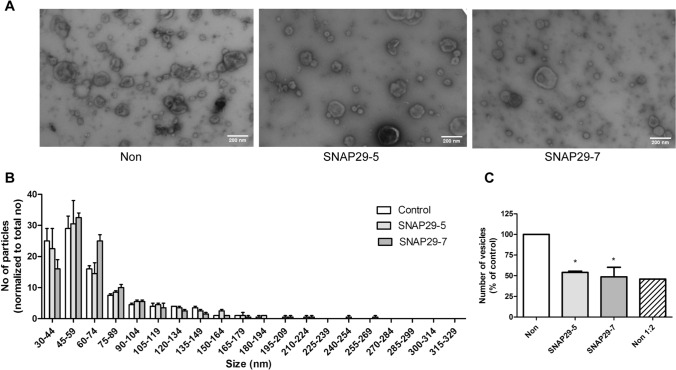
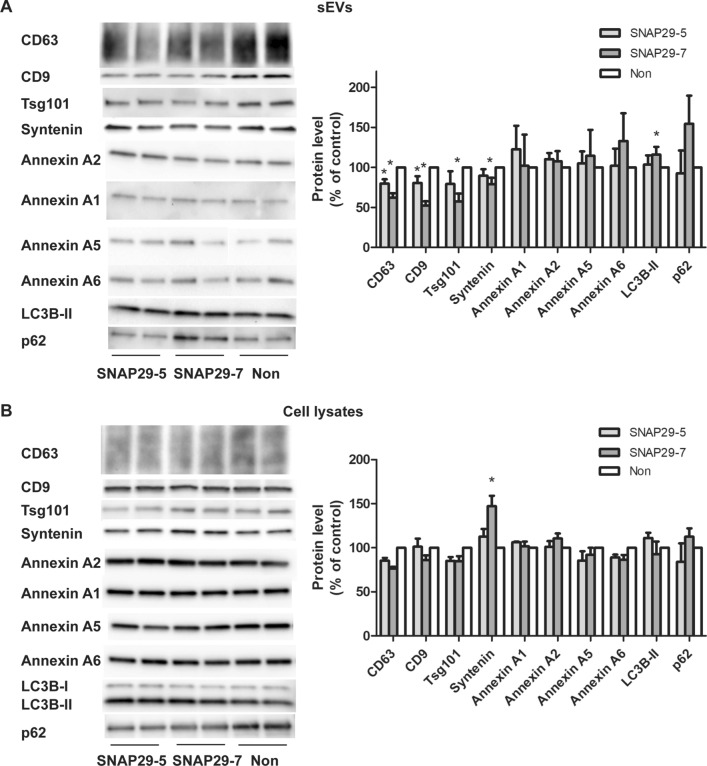
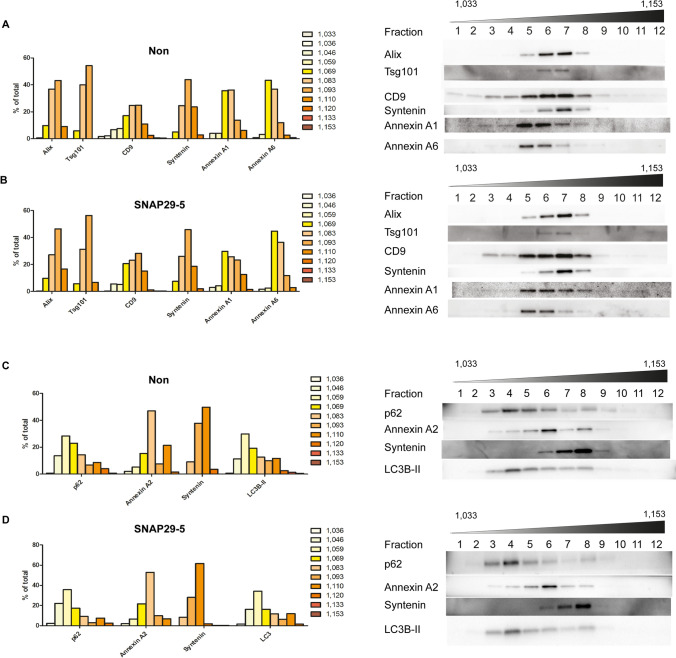
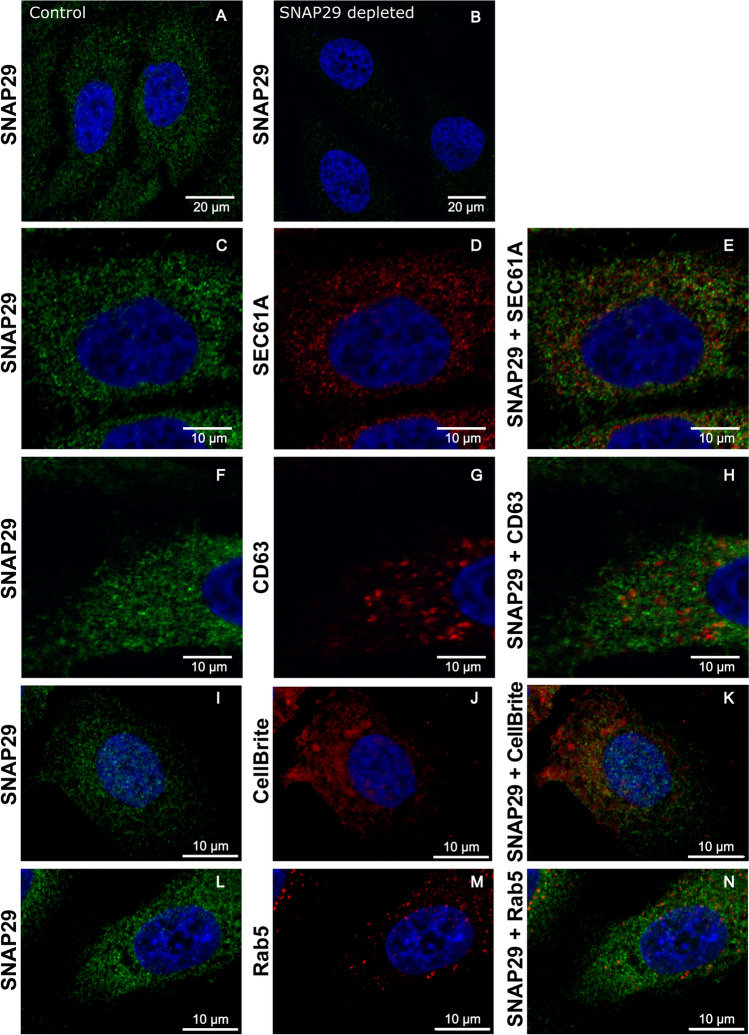
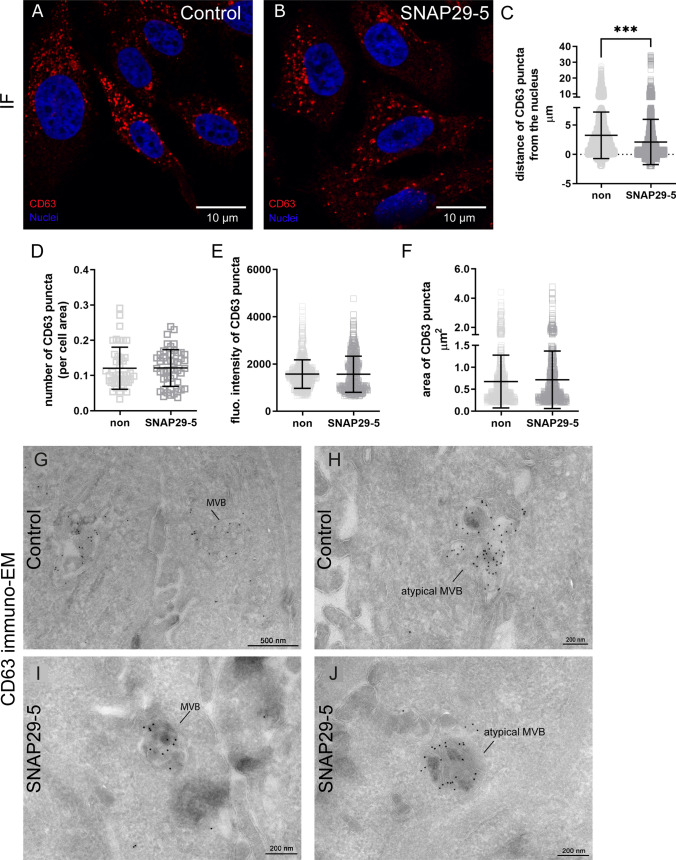
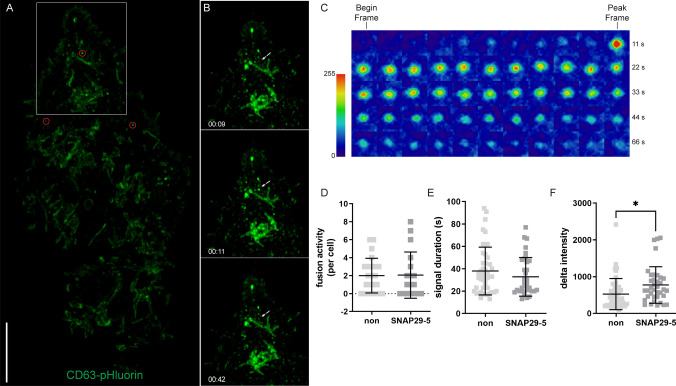
Cells release extracellular vesicles (EVs) of different sizes. Small EVs (< 200 nm) can originate from the fusion of multivesicular bodies with the plasma membrane, i.e. exosomes, and from budding of the plasma membrane, i.e. small ectosomes. To investigate the molecular machinery required for the release of small EVs, we developed a sensitive assay based on incorporation of radioactive cholesterol in EV membranes and used it in a siRNA screening. The screening showed that depletion of several SNARE proteins affected the release of small EVs. We focused on SNAP29, VAMP8, syntaxin 2, syntaxin 3 and syntaxin 18, the depletion of which reduced the release of small EVs. Importantly, this result was verified using gold standard techniques. SNAP29 depletion resulted in the largest effect and was further investigated. Immunoblotting analysis of small EVs showed that the release of several proteins considered to be associated with exosomes like syntenin, CD63 and Tsg101 was reduced, while the level of several proteins that have been shown to be released in ectosomes (annexins) or by secretory autophagy (LC3B and p62) was not affected by SNAP29 depletion. Moreover, these proteins appeared in different fractions when the EV samples were further separated by a density gradient. These results suggest that SNAP29 depletion mainly affects the secretion of exosomes. To investigate how SNAP29 affects exosome release, we used microscopy to study the distribution of MBVs using CD63 labelling and CD63-pHluorin to detect fusion events of MVBs with the plasma membrane. SNAP29 depletion caused a redistribution of CD63-labelled compartments but did not change the number of fusion events. Further experiments are therefore needed to fully understand the function of SNAP29. To conclude, we have developed a novel screening assay that has allowed us to identify several SNAREs involved in the release of small EVs.

Keywords: Cholesterol; Exosomes; SNAP29; SNARE; Small extracellular vesicles; Syntaxins; siRNA screening.


Conflict of interest statement

The authors have no relevant financial or non-financial interests to disclose.

Figures

Fig. 1
Fig. 1
Experimental setup for [14C]cholesterol-based screening assay for sEV release. A PC-3 cells were transfected with ON-target plus individual siRNAs (25 nM). The next day, cells were radiolabeled with [14C]cholesterol (0.1 µCi/ml, 2 µM) for 24 h, washed, and incubated with serum-free medium for 19 h. The medium was collected and centrifuged for 30 min at 10,000×g, before the supernatant was counted using a β-counter. Cells were washed, lysed and counted using a β-counter. The level of cholesterol in sEVs was estimated as the percentage of radioactivity in the medium relative to the total radioactivity in the medium and cells. B Experiments showing the effect of HG (20 µM) and manumycin A (250 nm) on the level of EV-associated [14C]cholesterol. The experiments were performed 4 times with duplicates
Fig. 2
Fig. 2
Proteins identified by the screening assay as candidates that (A) reduce or (B) increase sEV secretion after their knockdown. The error of the controls was 8% (n = 6; samples in each experiment in quadruplicate)
Fig. 3
Fig. 3
Depletion of STX2, STX3, STX18, VAMP8 and SNAP29 reduce the release of sEVs. sEVs were isolated by sequential centrifugation and their concentration measured by NTA after depletion of (A) STX2, (B) STX3, (C) STX18, (D) VAMP8 and (E) SNAP29. Knockdown efficiency was measured by immunoblotting 3 days after transfection with siRNA (25 nM) against (F) STX2, (G) STX3, (H) STX18, (I) VAMP8 and (J) SNAP29. A–J Data shows mean ± SEM from 3–4 independent experiments. *P < 0.05 versus non-targeting control (non). K sEVs were isolated from MCF-7, MDA-MB-231 and Caco-2 cells by sequential centrifugation after depletion of SNAP29 by siRNA (25 nM). For MDA-MB-231 and Caco-2 cells, vesicles were collected for 24 h, starting 2 days after transfection. For MCF-7, vesicles were collected for 42–44 h, starting 1 day after transfection. Particles in the 100,000×g pellet were measured by NTA. Knockdown efficiency 3 days after transfection was measured by immunoblotting, using actin as control. Experiments were performed twice (Caco-2) or 3 times (MCF-7, MDA-MB-231) in duplicate
Fig. 4
Fig. 4
EM analysis of sEVs from SNAP29 depleted and control PC-3 cells. sEVs were isolated by sequential centrifugation, placed onto formvar/carbon coated grids, washed, stained with 4% uranyl acetate and imaged on a JEOL-JEM 1230 at 80 kV. A Representative images of sEVs from SNAP29 depleted and control (non) cells. Size bar (200 nm) is indicated. B Size distribution of sEVs shown as number of particles normalized by total number of particles for each condition. Five images per condition were analyzed by TEM ExosomeAnalyzer. The data shows mean + SEM from three independent experiments. C Number of particles shown as percentage of control. Total number particles were counted in the same images used to prepare B. The data shows mean + SEM from three independent experiments
Fig. 5
Fig. 5
Depletion of SNAP29 decreases the secretion of exosomal proteins, but not of annexins and autophagy-related proteins. sEVs were isolated by sequential centrifugation from SNAP29-depleted PC-3 cells and lysed. Releasing cells were also lysed and equal volumes of sEV or cell lysate loaded on SDS-PAGE gels. A Representative immunoblots and quantification of sEV proteins. B Representative immunoblotting and quantification of cellular proteins. Data shows mean ± SEM, n = 3–5. *P < 0.05 versus non-targeting control (non)
Fig. 6
Fig. 6
The sEV fraction contains material of different density and protein composition. sEVs from (A, C) control and (B, D) SNAP29-depleted PC-3 cells were separated in a bottom-loaded OptiPrep density gradient (6–30%) by centrifugation at 100,000×g for 20 h. Twelve fractions were collected and immunoblotting was used to detect exosomal proteins, annexins and autophagy-related proteins. Equal volumes were loaded on SDS-PAGE gels. Experiments were performed 3 times, representative immunoblottings and quantification are shown. Band intensity is shown as % of signal per fraction normalized by the total signal for each protein
Fig. 7
Fig. 7
Confocal microscopy analysis of SNAP29 in PC-3 cells. Control PC-3 cells (A) and cells depleted of SNAP29 (B) were fixed and permeabilized before incubation with SNAP29 antibody and the corresponding secondary antibodies. C–E Control cells showing SNAP29 labelling (green), Sec61A (ER) labelling (red), and both proteins together. F–H Control cells showing SNAP29 labelling (green), CD63 (MVBs) labelling (red), and both proteins together. I–K Control cells showing SNAP29 labelling (green), CellBrite (plasma membrane) staining (red), and a combination of both. L–N Control cells showing SNAP29 labelling (green), Rab5 (endosome) labelling (red), and both proteins together. In all cases, cells were washed and mounted with ProLong Gold antifade mounting medium containing DAPI to stain the nuclei (blue) and imaged using a Zeiss LSM710 laser scanning confocal microscope (A–H) or a Nikon ECLIPSE Ti2-E confocal spinning disk microscope (I–N). Images were captured with a × 63 objective (A–H) or a  × 100 objective (I–N). Scale bars are indicated (10 μm)
Fig. 8
Fig. 8
Microscopy analysis of MVBs labelled for CD63 in control and SNAP29 depleted cells. Control PC-3 cells (A) and cells depleted of SNAP29 (B) were fixed and permeabilized before incubation with CD63 antibody and the corresponding secondary antibodies. Then, cells were washed and mounted with ProLong Gold antifade mounting medium containing DAPI to stain the nuclei (blue) and imaged using a Zeiss LSM710 laser scanning confocal microscope or a Nikon ECLIPSE Ti2-E confocal spinning disk microscope. Z-stack images were captured with a × 63 or × 100 objective. Scale bars are indicated (10 μm). C Quantification of the distance of CD63-positive puncta from the nucleus in control (mean = 3.26 nm) and SNAP29 depleted (mean = 2.12 nm) cells. The analysis of Z-stack images was performed by using the function Cell in IMARIS 9.0. At least 120 cells per condition, corresponding to more than 4500 puncta, were analyzed. Data shows mean ± SD. ***P < 0.0001. The quantification of the number of CD63 puncta, normalized to total cell area (D), puncta fluorescence intensity (E) and puncta area (F) was performed on Z-stack projections using ImageJ as described in Materials and Methods in control and SNAP29 depleted PC-3 cells. N ≥ 45 cells per condition or N ≥ 590 puncta per condition. Data shows mean ± SD. Cryo-sectioning and immuno-EM with CD63 (10 nm Au particles) in control cells showing (G) a classical MVB morphology and (H) an atypical MVB morphology containing multilaminar structures. Cryo-sectioning and immuno-EM with CD63 (10 nm) in SNAP29 depleted cells showing (I) classical MVB morphology and (J) an atypical MVB morphology containing multilaminar structures
Fig. 9
Fig. 9
Analysis of MVB fusion events at the plasma membrane using CD63-pHluorin. CD63-pHluorin expressing PC-3 cell were imaged with a Nikon ECLIPSE Ti2-E confocal spinning disk microscope using a × 100 objective at or near the plasma membrane. Image analysis was performed using the ImageJ2/Fiji plugin ExoJ. A Total projection of fusion events (red circle) over a time course of 3 min in a representative cell. Scale bar, 10 μm. The white square depicts the region of interest enlarged in B. B Stills from live imaging of a fusion event (indicated by white arrows) over a time course of 33 s in a representative cell: before the event (top picture), at the start of the event (middle picture), and at the end (bottom picture). C Timelapse imaging (heat maps) of a representative CD63-pHluorin fusion event. Begin frame and peak frame are indicated. D Quantification of fusion events in control (mean = 2.00) and SNAP29 depleted (mean = 2.06) PC-3 cells transfected with CD63-pHluorin. N ≥ 18 cells per condition. E Fluorescent signal duration of CD63 fusion events in control (mean = 38.00 s) and SNAP29 depleted (mean = 32.77 s) cells. N ≥ 37 events per condition. F Delta intensity, i.e. the difference of fluorescence intensity between the begin frame and the peak frame, in control (mean = 524.6) and SNAP29 depleted (mean = 772.6) cells. N ≥ 37 events per condition. *P < 0.05; using Student’s two-tailed t test with Welch’s correction. For DF, mean ± SD of two independent experiments is shown

References

    1. Cocucci E, Racchetti G, Meldolesi J. Shedding microvesicles: artefacts no more. Trends Cell Biol. 2009;19:43–51. doi: 10.1016/j.tcb.2008.11.003. - DOI - PubMed
    1. Hristov M, Erl W, Linder S, Weber P. Apoptotic bodies from endothelial cells enhance the number and initiate the differentiation of human endothelial progenitor cells in vitro. Blood. 2004;104:2761–2766. doi: 10.1182/blood-2003-10-3614. - DOI - PubMed
    1. Zernecke A, Bidzhekov K, Noels H, Shagdarsuren E, Gan L, Denecke B, Hristov M, Köppel T, Jahantigh M, Lutgens E, et al. Delivery of microRNA-126 by apoptotic bodies induces CXCL12-dependent vascular protection. Science signaling. 2009;2:ra81–ra81. doi: 10.1126/scisignal.2000610. - DOI - PubMed
    1. Pan BT, Teng K, Wu C, Adam M, Johnstone RM. Electron microscopic evidence for externalization of the transferrin receptor in vesicular form in sheep reticulocytes. J Cell Biol. 1985;101:942–948. doi: 10.1083/jcb.101.3.942. - DOI - PMC - PubMed
    1. Johnstone RM, Adam M, Hammond JR, Orr L, Turbide C. Vesicle formation during reticulocyte maturation. Association of plasma membrane activities with released vesicles (exosomes) J Biol Chem. 1987;262:9412–9420. doi: 10.1016/S0021-9258(18)48095-7. - DOI - PubMed

MeSH terms

Substances