. 2023 Jun 1;39(6):btad372.
doi: 10.1093/bioinformatics/btad372.

NoVaTeST: identifying genes with location-dependent noise variance in spatial transcriptomics data

Affiliations

NoVaTeST: identifying genes with location-dependent noise variance in spatial transcriptomics data

Mohammed Abid Abrar et al. Bioinformatics. .

Abstract

Motivation: Spatial transcriptomics (ST) can reveal the existence and extent of spatial variation of gene expression in complex tissues. Such analyses could help identify spatially localized processes underlying a tissue's function. Existing tools to detect spatially variable genes assume a constant noise variance across spatial locations. This assumption might miss important biological signals when the variance can change across locations.

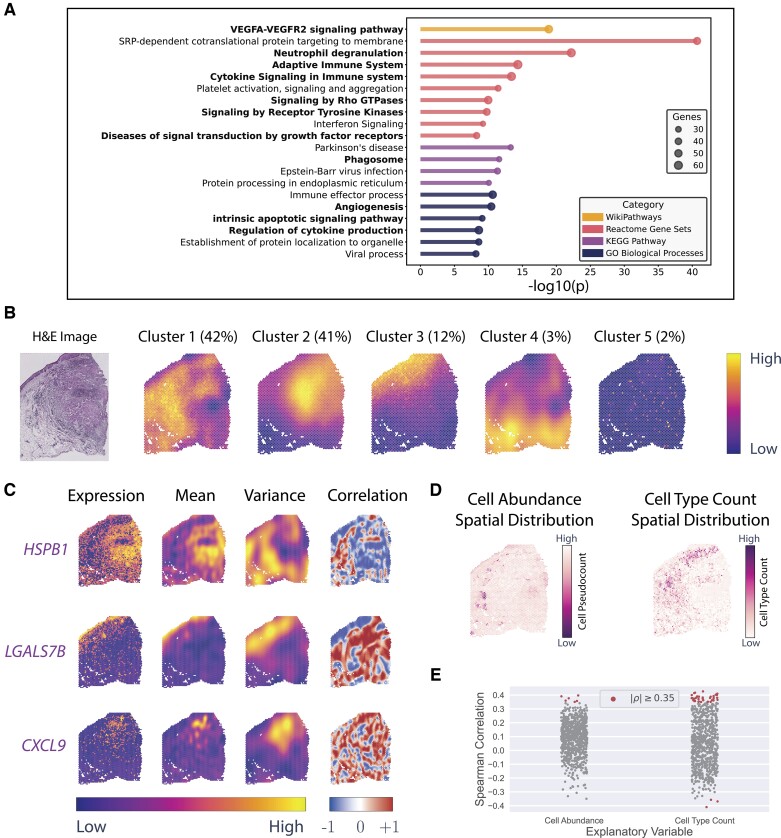
Results: In this article, we propose NoVaTeST, a framework to identify genes with location-dependent noise variance in ST data. NoVaTeST models gene expression as a function of spatial location and allows the noise to vary spatially. NoVaTeST then statistically compares this model to one with constant noise and detects genes showing significant spatial noise variation. We refer to these genes as "noisy genes." In tumor samples, the noisy genes detected by NoVaTeST are largely independent of the spatially variable genes detected by existing tools that assume constant noise, and provide important biological insights into tumor microenvironments.

Availability and implementation: An implementation of the NoVaTeST framework in Python along with instructions for running the pipeline is available at https://github.com/abidabrar-bracu/NoVaTeST.


Conflict of interest statement

None declared.

Financial Support: None declared.

Figures

Figure 1
Figure 1
Simulated example to show the importance of heteroscedastic modeling. (A) Simulated gene expression with heteroscedastic noise. The noise variance increases as x1 decreases and x2 increases. The coordinates are taken from the Visium data of a tissue sample with 3650 spots. (B) Predicted mean and noise variance along with the NLPD of the simulated data for spatial models—homoscedastic and heteroscedastic. A lower NLPD indicates a better model fitting.
Figure 2
Figure 2
ST data acquisition pipeline for Visium and ST technology. (A) Tissue slice placed on top of a slide to acquire ST data at pre-designated spatially barcoded spots. (B) Representation of ST count data. Each column in the expression matrix represents the expression of a particular gene with spot locations given by the spatial matrix. The expression matrix is a N×G matrix, where N is the number of spots and G is the number of genes. The spatial matrix is a N×2 matrix, where each row represents the x1 and x2 coordinates of a spot.
Figure 3
Figure 3
Results obtained from squamous cell carcinoma data using NoVaTeST. (A) Top cluster representative enriched terms for the detected noisy genes using Metascape. Terms associated with cancer and immuno-response are shown in bold font. (B) The average gene expression noise variance, averaged over the cluster members, for the five identified clusters along with the tissue H&E-stained image. The numbers inside the parentheses denote the percentage of noisy genes in each cluster. (C) Gene expression (log scale) and corresponding modeled mean and variance for three representative genes from the first three clusters. Also plotted is the spatial Spearman correlation between the mean and variance of the model, where the correlation for a spot is computed by considering 12 nearby spots. (D) Spatial distribution of two possible explanatory variables for the detected noisy genes, namely cell abundance and cell type count variation across spatial coordinates. (E) Spearman correlation of the bivariate analysis of the noisy genes with the two possible explanatory variables.
Figure 4
Figure 4
Results obtained from cutaneous malignant melanoma data using NoVaTeST. (A) Tissue H&E-stained image of the sample with three histopathological regions—melanoma, lymphoid, and stroma. (B) The average gene expression noise variance, averaged over the cluster members, for the three identified clusters. The numbers inside the parentheses denote the percentage of noisy genes in each cluster. (C) Top cluster representative enriched terms for the detected noisy genes in each detected cluster using Metascape. (D) Gene expression (log scale) and corresponding modeled mean and variance for three representative genes from the three clusters.
Figure 5
Figure 5
Analysis to check the existence and extent of mean–variance artifacts in the datasets. (A) Venn diagram showing the overlap between genes detected by SpatialDE and NoVaTeST for the carcinoma and the melanoma datasets. (B) Cumulative frequency of Spearman correlation between the estimated mean and variance for the common genes (genes detected by both SpatialDE and NoVaTeST).

References

    1. Abhinand CS, Raju R, Soumya SJ. et al. VEGF-A/VEGFR2 signaling network in endothelial cells relevant to angiogenesis. J Cell Commun Signal 2016;10:347–54. 10.1007/s12079-016-0352-8. - DOI - PMC - PubMed
    1. Almosallam IA, Jarvis MJ, Roberts SJ.. GPz: non-stationary sparse Gaussian processes for heteroscedastic uncertainty estimation in photometric redshifts. Mon Not R Astron Soc 2016;462:726–39. 10.1093/mnras/stw1618. - DOI
    1. Anders S, Huber W.. Differential expression analysis for sequence count data. Genome Biol 2010;11:14747596. 10.1186/gb-2010-11-10-r106. - DOI - PMC - PubMed
    1. Anscombe FJ. The transformation of Poisson, binomial and negative-binomial data. Biometrika 1948;35:246–54. 10.2307/2332343. - DOI
    1. Babbie ER. The Practice of Social Research, 15th edn. Boston: Cengage, 2021.

LinkOut - more resources