. 2023 Jun 9;9(23):eadf0284.
doi: 10.1126/sciadv.adf0284. Epub 2023 Jun 7.

Altered fear engram encoding underlying conditioned versus unconditioned stimulus-initiated memory updating

Affiliations

Altered fear engram encoding underlying conditioned versus unconditioned stimulus-initiated memory updating

Shuai-Wen Teng et al. Sci Adv. .

Abstract

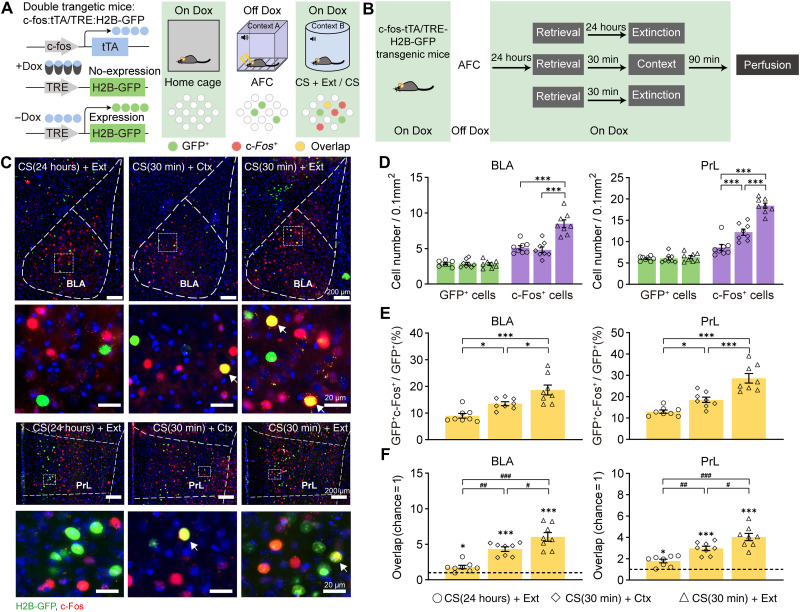
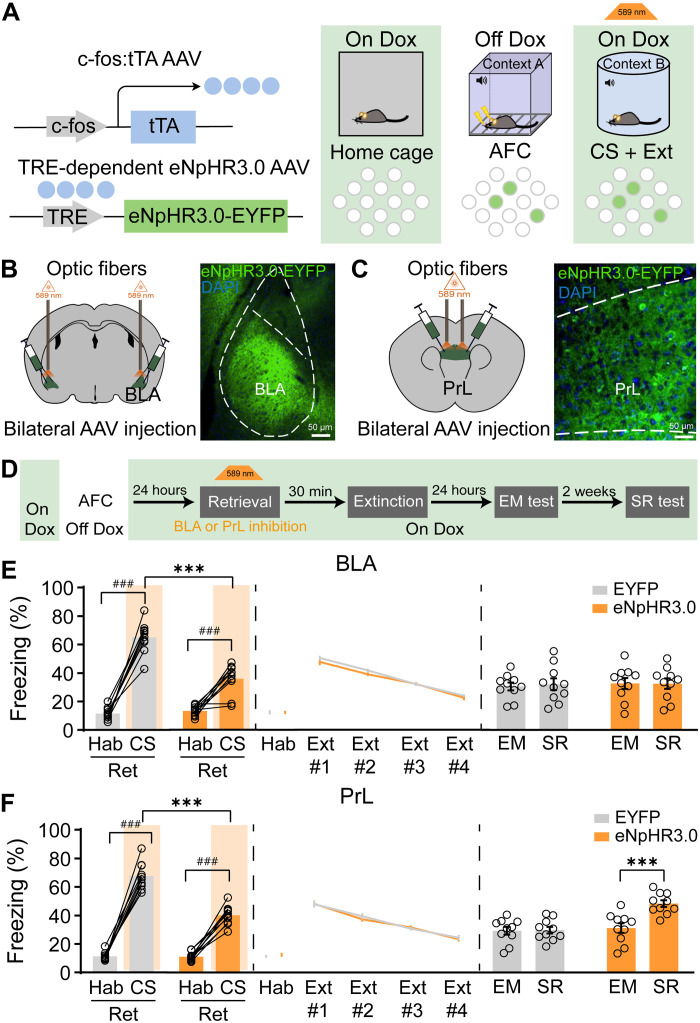
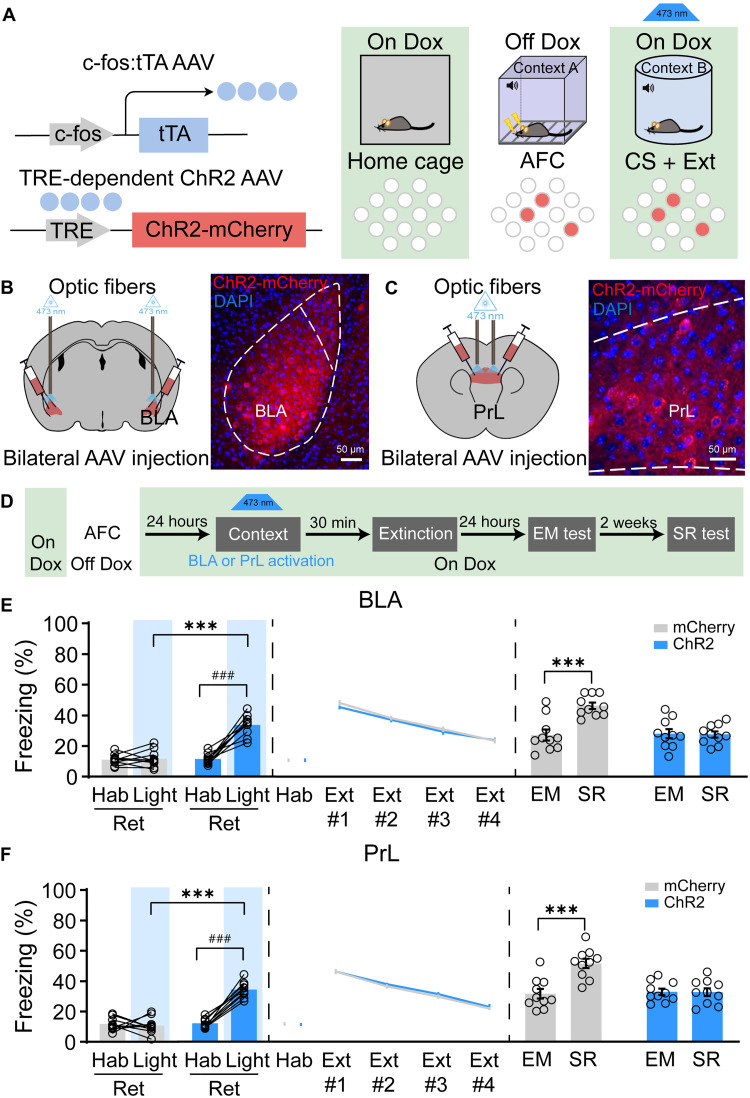
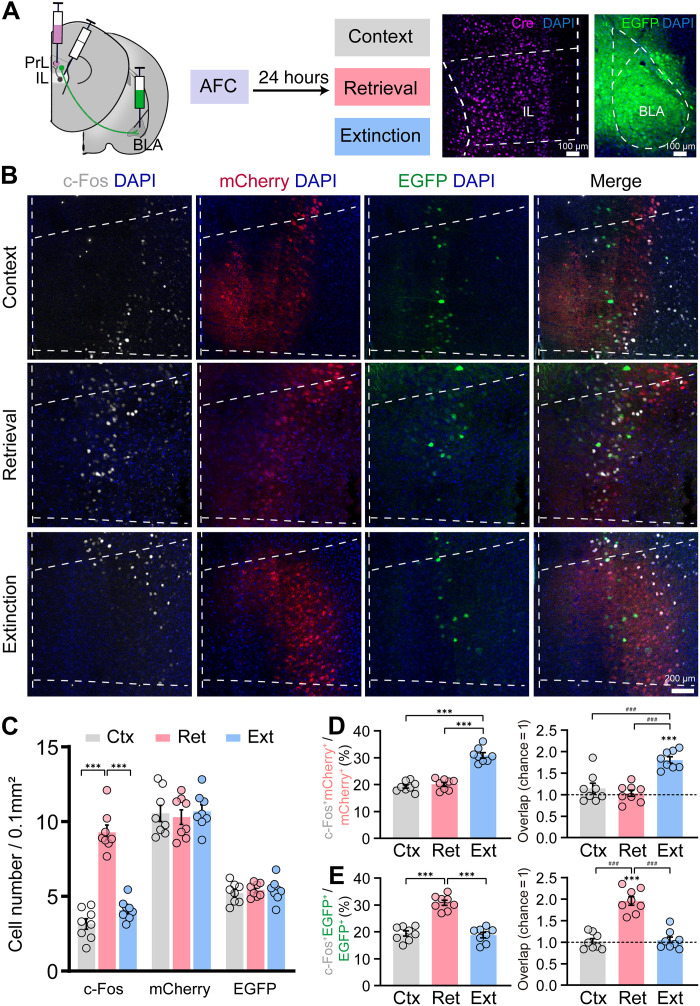
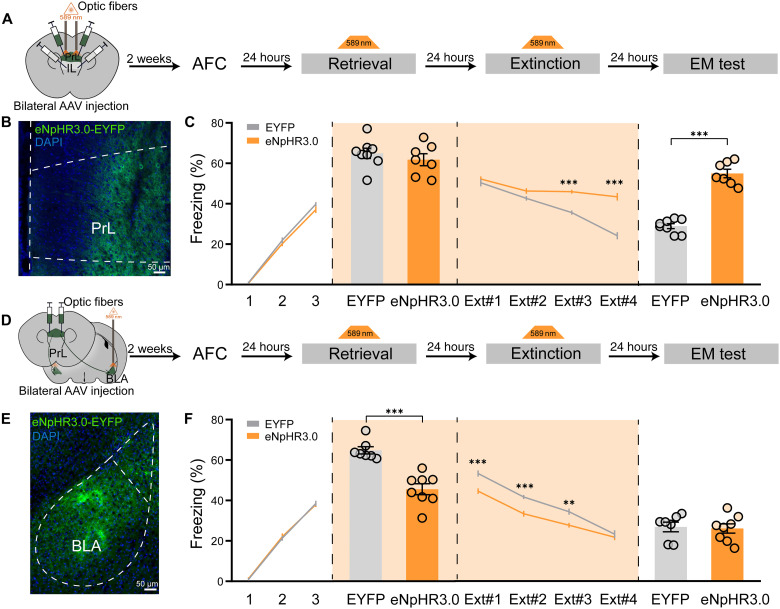
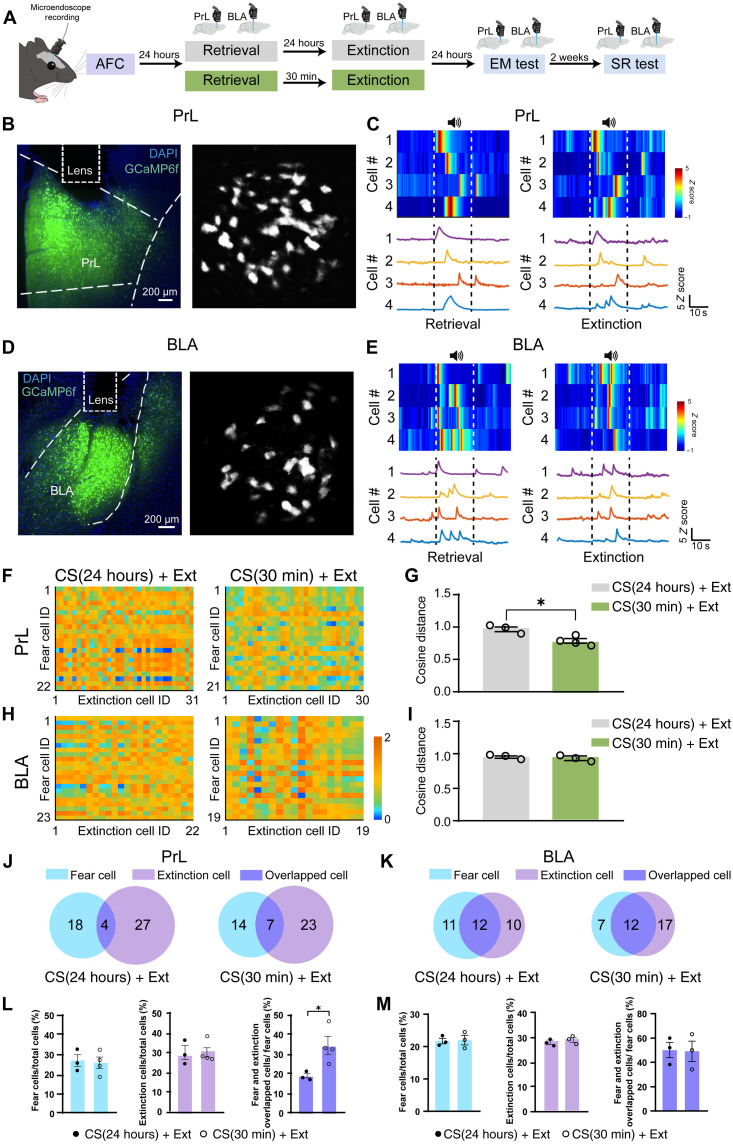
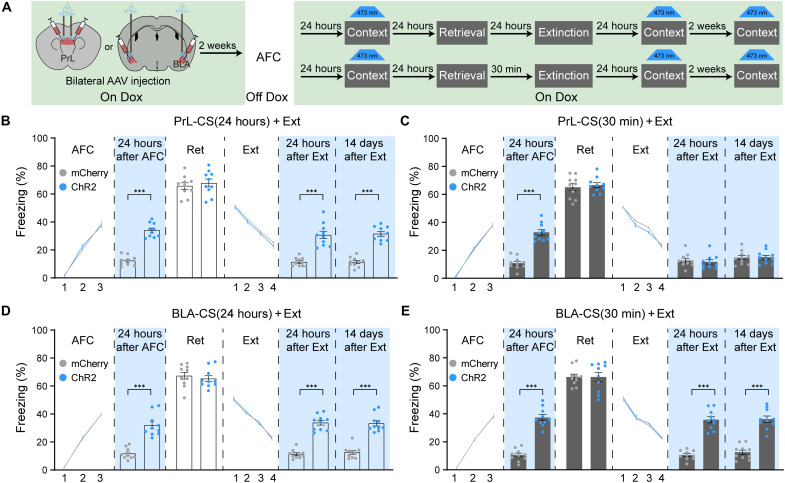
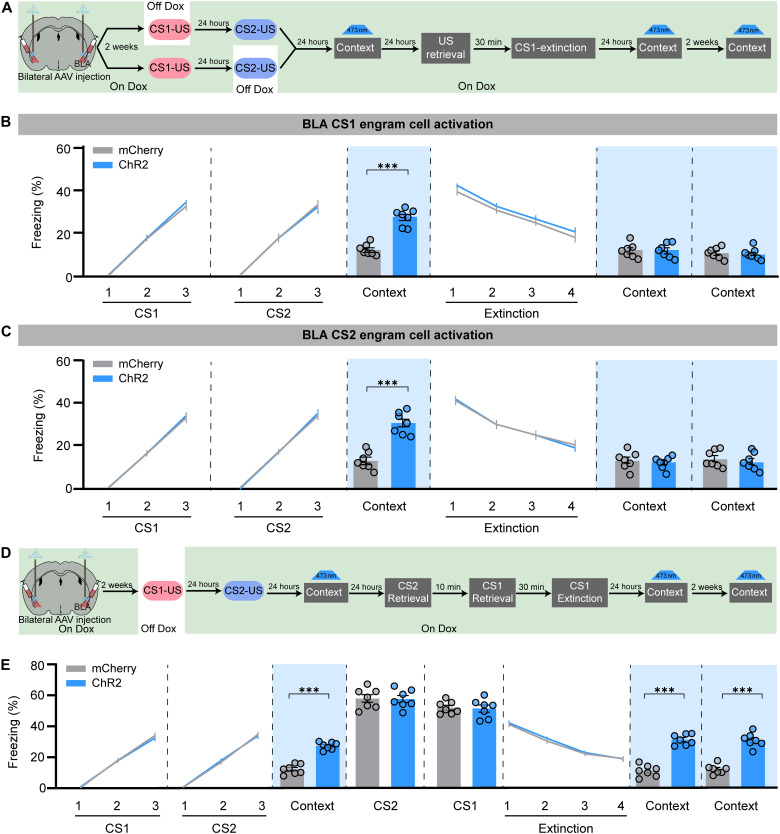
It is known that post-retrieval extinction but not extinction alone could erase fear memory. However, whether the coding pattern of original fear engrams is remodeled or inhibited remains largely unclear. We found increased reactivation of engram cells in the prelimbic cortex and basolateral amygdala during memory updating. Moreover, conditioned stimulus- and unconditioned stimulus-initiated memory updating depends on the engram cell reactivation in the prelimbic cortex and basolateral amygdala, respectively. Last, we found that memory updating causes increased overlapping between fear and extinction cells, and the original fear engram encoding was altered during memory updating. Our data provide the first evidence to show the overlapping ensembles between fear and extinction cells and the functional reorganization of original engrams underlying conditioned stimulus- and unconditioned stimulus-initiated memory updating.


Figures

Fig. 1.
Fig. 1.. The engram cells in BLA and PrL show increased reactivation during CS-initiated memory updating.
(A) Labeling strategy of the inducible double transgenic TetTag mouse and the experimental design used in the CS or CS + Ext paradigm. Activated neurons upon AFC training express H2B-GFP (green), while neurons activated by CS or CS + Ext express endogenous c-Fos (red) and the overlapped cells were labeled (yellow). (B) Experimental schedule of engram cell labeling in CS(24 hours) + Ext, CS(30 min) + Ctx, and CS(30 min) + Ext groups. (C) Representative images of GFP+ (green) and c-Fos+ (red) immunofluorescence in BLA (top) and PrL (bottom) during CS(30 min) + Ext, CS(30 min) + Ctx, and CS(24 hours) + Ext. The white arrowheads marked colabeled GFP+c-Fos+ cells. (D) The CS(24 hours) + Ext, CS(30 min) + Ctx, and CS(30 min) + Ext groups showed similar GFP+ cell density, but the c-Fos+ cell density was significantly higher in the CS(30 min) + Ext group in both PrL and BLA (unpaired t test, ***P < 0.001; n = 8 animals per group). (E) GFP+c-Fos+/GFP+ levels were significantly higher in the CS(30 min) + Ext group than in CS(24 hours) + Ext and CS(30 min) + Ctx groups [one-way analysis of variance (ANOVA) with Tukey’s multiple comparisons test, *P < 0.05, ***P < 0.001]. (F) Compared with the chance (dashed line) level, the overlap between GFP+ and c-Fos+ cells [GFP+c-Fos+/4′,6-diamidino-2-phenylindole (DAPI)] was greater in CS(30 min) + Ext, CS(30 min) + Ctx, and CS(24 hours) + Ext groups, but the overlap was higher in the CS(30 min) + Ext group than in the CS(30 min) + Ctx or CS(24 hours) + Ext group (paired t test, *P < 0.05, ***P < 0.001, ***P < 0.001; one-way ANOVA with Tukey’s multiple comparisons test, #P < 0.05, ##P < 0.01, ###P < 0.001). Data are presented as means ± SEM.
Fig. 2.
Fig. 2.. The activation of engram cells in PrL but not BLA was necessary for CS-initiated fear memory updating.
(A) Labeling strategy of engram cells with eNpHR3.0-EYFP. (B) Coronal sections of BLA with eNpHR3.0-EYFP (green). (C) Coronal sections of PrL with eNpHR3.0-EYFP (green). (D) Schematic and experimental design of the optogenetic inactivation of engram cells in BLA or PrL. (E) Optogenetic silencing of engram cells in BLA during retrieval (Ret) reduced the freezing levels (one-way ANOVA with Tukey’s multiple comparisons test, ***P < 0.001; paired t test, ###P < 0.001; n = 10 animals per group). Freezing behavior during extinction showed no difference. The freezing levels during the SR test and EM test showed no difference. (F) Optogenetic silencing of engram cells in PrL during retrieval reduced the freezing levels (one-way ANOVA with Tukey’s multiple comparisons test, ***P < 0.001; n = 10 animals per group). Freezing behavior during extinction showed no difference. The freezing levels during the SR test were significantly increased compared to the EM test by optogenetic silencing of engram cells in PrL, but there was no difference in the EYFP group [repeated-measures (RM) two-way ANOVA with Sidak’s multiple comparisons test, ***P < 0.001]; freezing levels of habituation showed the freezing levels in the context during the pre-CS or preactivation period. Data are presented as means ± SEM.
Fig. 3.
Fig. 3.. The activation of engram cells in either PrL or BLA could induce CS-initiated fear memory updating.
(A) Labeling strategy of engram cells with ChR2-mCherry. (B) Coronal sections of BLA with ChR2-mCherry (red). (C) Coronal sections of PrL with ChR2-mCherry (red). (D) Schematic and experimental design of the optogenetic activation of engram cells in BLA or PrL. (E) Optogenetic activation of engram cells in BLA in context B without CS-induced increased freezing levels (one-way ANOVA with Tukey’s multiple comparisons test, ***P < 0.001; paired t test, ###P < 0.001; n = 10 animals per group). Freezing behavior during extinction showed no difference. The freezing levels during the SR test were significantly increased compared to the EM test in the mCherry group, but there was no difference in the ChR2-mCherry group in which the engram cells in BLA were activated by optogenetics (RM two-way ANOVA with Sidak’s multiple comparisons test, ***P < 0.001). (F) Schematic and experimental design of the optogenetic activation of engram cells in PrL. Optogenetic activation of engram cells in PrL in context B without CS-induced increased freezing levels (one-way ANOVA with Tukey’s multiple comparisons test, ***P < 0.001; paired t test, ###P < 0.001; n = 10 animals per group). Freezing behavior during extinction showed no difference. The freezing levels during the SR test were significantly increased compared to the EM test in the mCherry group, but there was no difference in the ChR2-mCherry group in which the engram cells in PrL were activated by optogenetics (RM two-way ANOVA with Sidak’s multiple comparisons test, ***P < 0.001). Data are presented as means ± SEM.
Fig. 4.
Fig. 4.. PrL neurons receiving IL inputs showed high activation during memory extinction.
(A) Labeling strategy of the anterograde and retrograde tracing in PrL and the behavioral experimental design; coronal sections of IL with anti-Cre immunostaining (left) and coronal sections of BLA with retroAAV2-hSyn-EGFP expression (right). (B) Representative images of c-Fos+ (white), mCherry+ (red), and EGFP+ (green) cells in PrL during context, retrieval, and extinction. (C) The three groups (Ctx, context; Ret, retrieval; Ext, extinction) showed similar mCherry+ and EGFP+ cell density, but the c-Fos+ cell density during retrieval was significantly higher than in context and extinction groups (one-way ANOVA with Tukey’s multiple comparisons test, ***P < 0.001; n = 8 animals per group). (D) c-Fos+mCherry+/mCherry+ levels were significantly higher in the extinction group than in context and retrieval groups; compared with the chance (dashed line) level, the overlap between mCherry+ and c-Fos+ cells (c-Fos+mCherry+/DAPI) was greater in the extinction group, and the overlap was higher in the extinction group than in context and retrieval groups (paired t test, ***P < 0.001; one-way ANOVA with Tukey’s multiple comparisons test, ###P < 0.001). (E) c-Fos+EGFP+/EGFP+ levels were significantly higher in the retrieval group than in context and extinction groups; compared with the chance (dashed line) level, the overlap between EGFP+ and c-Fos+ cells (c-Fos+EGFP+/DAPI) was greater in retrieval groups, and the overlap was higher in the retrieval group than in context and extinction groups (paired t test, ***P < 0.001; one-way ANOVA with Tukey’s multiple comparisons test, ###P < 0.001). Data are presented as means ± SEM.
Fig. 5.
Fig. 5.. PrL neurons receiving IL inputs regulate memory extinction.
(A) Labeling strategy of PrL neurons receiving IL projection with injection of DIO-eNpHR3.0-EYFP in PrL and injection of AAV1-hSyn-Cre in IL; schematic and experimental design of the optogenetic inactivation of PrL neurons receiving IL projection. (B) Coronal sections of PrL with DIO-eNpHR3.0-EYFP (green). (C) Optogenetic inhibition of PrL neurons receiving IL projection has no effect on retrieval but impairs EM acquisition, and the freezing levels during the EM test were significantly increased in the eNpHR3.0 group compared to the EYFP group (RM two-way ANOVA with Sidak’s multiple comparisons test, ***P < 0.001; n = 8 animals in the EYFP group, n = 7 animals in the eNpHR3.0 group). (D) Labeling strategy of PrL projections into BLA with injection of AAV9-hSyn-eNpHR3.0-EYFP in PrL; schematic and experimental design of the optogenetic inactivation of PrL to BLA projections. (E) Coronal sections of BLA with PrL axons expressing eNpHR3.0-EYFP (green). (F) The freezing levels during retrieval were significantly decreased in the eNpHR3.0 group compared with the EYFP group. The freezing levels during Ext#1, Ext#2, and Ext#3 in the eNpHR3.0 group were significantly lower than those in the EYFP group, while the rate of within-session extinction showed no difference (RM two-way ANOVA with Sidak’s multiple comparisons test, **P < 0.01, ***P < 0.001; n = 8 animals per group). Data are presented as means ± SEM.
Fig. 6.
Fig. 6.. The vector distance and overlapped cells between fear cells and extinction cells during CS-initiated memory updating.
(A) Monitoring of Ca2+ activity of PrL and BLA during different behavioral paradigm in a freely moving mouse by using miniaturized microscope. (B) Virus injection and GRIN lens implantation (left) and maximum intensity projection image (right) in PrL. (C) Example cells selected activated during retrieval or the last trail of extinction in PrL. (D) Virus injection and GRIN lens implantation (left) and maximum intensity projection image (right) in BLA. Scale bar, 50 μm. (E) Example cells selected activated during retrieval or the last trail of extinction in BLA. The matrix showed the cosine distance from example mice between fear cells and extinction cells in PrL (F) or BLA (H) in CS(24 hours) + Ext and CS(30 min) + Ext groups. (G) The cosine distance between fear and extinction cells of PrL in the CS(30 min) + Ext group was significantly smaller than that in the CS(24 hours) + Ext group [two-way ANOVA with Sidak’s multiple comparisons test, *P < 0.05; n = 3 animals; 335 neurons in the CS(24 hours) + Ext group; n = 4 animals, 434 neurons in the CS(30 min) + Ext group]. (I) The cosine distance between fear and extinction cells of BLA showed no difference between CS(24 hours) + Ext and CS(30 min) + Ext groups [n = 3 animals, 396 neurons in the CS(24 hours) + Ext group; n = 3 animals, 375 neurons in the CS(30 min) + Ext group]. The Venn map showed the distribution of fear and extinction cells in PrL (J) or BLA (K) from example mice in CS(24 hours) + Ext and CS(30 min) + Ext groups. The percentage of fear cells (fear cells/total cells), extinction cells (extinction cells/total cells), and overlapped cells (fear and extinction overlapped cells/fear cells) of the CS(30 min) + Ext group in PrL (L) or BLA (M) (RM two-way ANOVA with Sidak’s multiple comparisons test, *P < 0.05). Data are presented as means ± SEM.
Fig. 7.
Fig. 7.. The encoding of engram cells in PrL but not BLA was updated during CS-initiated memory updating.
(A) Schematic and experimental design of the optogenetic activation of engram cells in PrL or BLA at different time points. The freezing levels with activation of PrL engram cells in context B without retrieval at 24 hours after AFC and 24 hours or 14 days after extinction in the PrL-CS(24 hours) + Ext group (B) and the PrL-CS(30 min) + Ext group (C) (RM two-way ANOVA with Sidak’s multiple comparisons test, ***P < 0.001; n = 10 animals per group). The freezing levels with activation of BLA engram cells in context B without retrieval at 24 hours after AFC and 24 hours or 14 days after extinction in the BLA-CS(24 hours) + Ext group (D) and the BLA-CS(30 min) + Ext group (E) (RM two-way ANOVA with Sidak’s multiple comparisons test, ***P < 0.001; n = 10 animals per group). Data are presented as means ± SEM.
Fig. 8.
Fig. 8.. The vector distance and overlapped cells between fear cells and extinction cells in BLA during US-initiated memory updating.
Monitoring of Ca2+ activity of BLA during different sessions of CS1(30 min) + Ext (A) or US(30 min) + Ext (B) in a freely moving mouse by using miniaturized microscope (RM two-way ANOVA with Sidak’s multiple comparisons test, ***P < 0.001). Example cells selected activated during CS1 retrieval, CS2 retrieval, and the last trail of CS1 extinction in BLA during CS (C)– or US (D)–initiated memory updating. (E) The matrix showed the cosine distance from one example mouse between CS1 fear cells and CS1 extinction cells and CS2 fear cells and CS1 extinction cells of BLA. (F) Compared with the CS1(30 min) + Ext group, CS1 fear cells and CS1extinction cells or CS2 fear cells and CS1 extinction cells showed closer cosine distance in the US(30 min) + Ext group [two-way ANOVA with Sidak’s multiple comparisons test, *P < 0.05; n = 3 animals, 320 neurons in the CS1(30 min) + Ext group; n = 3 animals, 328 neurons in the US(30 min) + Ext group]. (G) The Venn map showed the distribution of CS1 fear cells, CS2 fear cells, and CS1 extinction cells in BLA from one example mouse. (H) The percentage of CS1 and CS2 fear cells (fear cells/total cells) in BLA showed no difference. Compared with the CS1(30 min) + Ext group, the percentage of CS2 fear cells or CS1 fear cells and CS1 extinction overlapped cells (fear and extinction overlapped cells/fear cells) in the US(30 min) + Ext group was significantly higher (two-way ANOVA with Sidak’s multiple comparisons test, *P < 0.05). Data are presented as means ± SEM.
Fig. 9.
Fig. 9.. The encoding of fear engram cells in BLA was altered during US-initiated memory updating.
(A) Schematic and experimental design of the optogenetic activation of CS1 or CS2 engram cells in BLA at different time points. The freezing levels with activation of CS1 fear engram cells (B) or CS2 engram cells (C) in BLA in context B without retrieval at 24 hours after CS2-US conditioning and 24 hours or 14 days after extinction during US-initiated memory updating (RM two-way ANOVA with Sidak’s multiple comparisons test, ***P < 0.001; n = 7 animals per group). (D) Schematic and experimental design of the optogenetic activation of CS1 engram cells in the BLA at different time points during CS1(30 min) + Ext. (E) The freezing levels with activation of CS1 fear engram cells in BLA in context C without retrieval at 24 hours after CS2-US conditioning and 24 hours or 14 days after extinction during CS1-initiated memory updating (RM two-way ANOVA with Sidak’s multiple comparisons test, ***P < 0.001; n = 7 animals per group). Data are presented as means ± SEM.

References

    1. Tanner M. K., Hake H. S., Bouchet C. A., Greenwood B. N., Running from fear: Exercise modulation of fear extinction. Neurobiol. Learn. Mem. 151, 28–34 (2018). - PMC - PubMed
    1. Myers K. M., Davis M., Mechanisms of fear extinction. Mol. Psychiatry 12, 120–150 (2007). - PubMed
    1. Monfils M.-H., Cowansage K. K., Klann E., LeDoux J. E., Extinction-reconsolidation boundaries: Key to persistent attenuation of fear memories. Science 324, 951–955 (2009). - PMC - PubMed
    1. Schiller D., Monfils M.-H., Raio C. M., Johnson D. C., LeDoux J. E., Phelps E. A., Preventing the return of fear in humans using reconsolidation update mechanisms. Nature 463, 49–53 (2010). - PMC - PubMed
    1. Liu J., Zhao L., Xue Y., Shi J., Suo L., Luo Y., Chai B., Yang C., Fang Q., Zhang Y., Bao Y., Pickens C. L., Lu L., An unconditioned stimulus retrieval extinction procedure to prevent the return of fear memory. Biol. Psychiatry 76, 895–901 (2014). - PMC - PubMed

MeSH terms