. 2023 Jun 9;9(23):eadf9491.
doi: 10.1126/sciadv.adf9491. Epub 2023 Jun 7.

3D deconvolution of human skin immune architecture with Multiplex Annotated Tissue Imaging System

Affiliations

3D deconvolution of human skin immune architecture with Multiplex Annotated Tissue Imaging System

Manon Scholaert et al. Sci Adv. .

Abstract

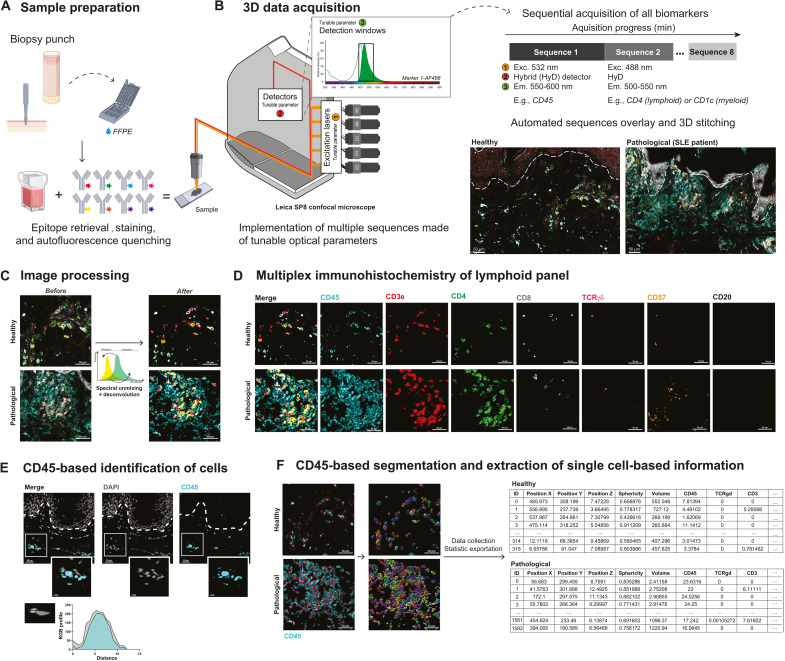
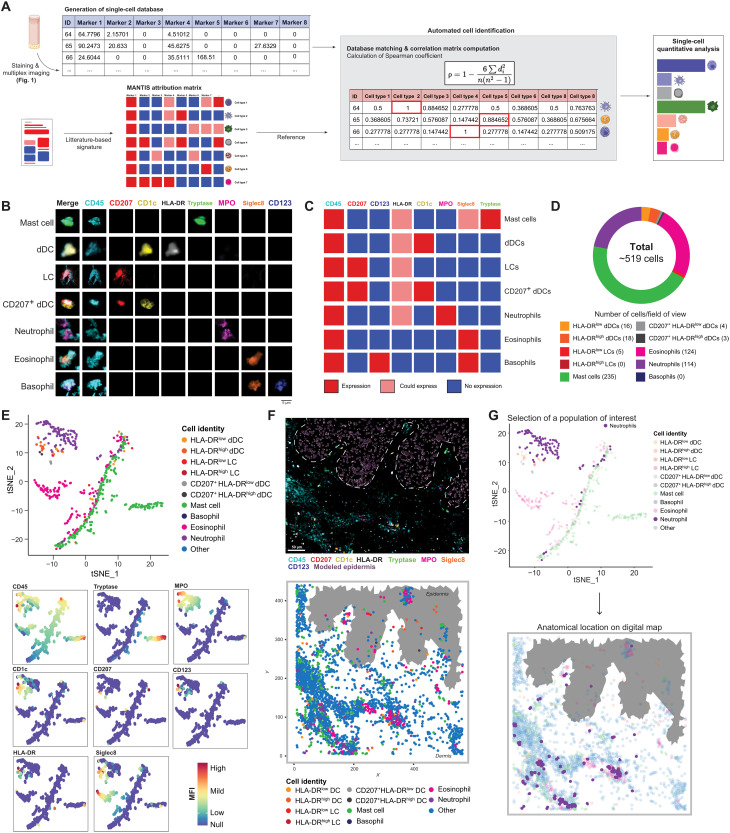
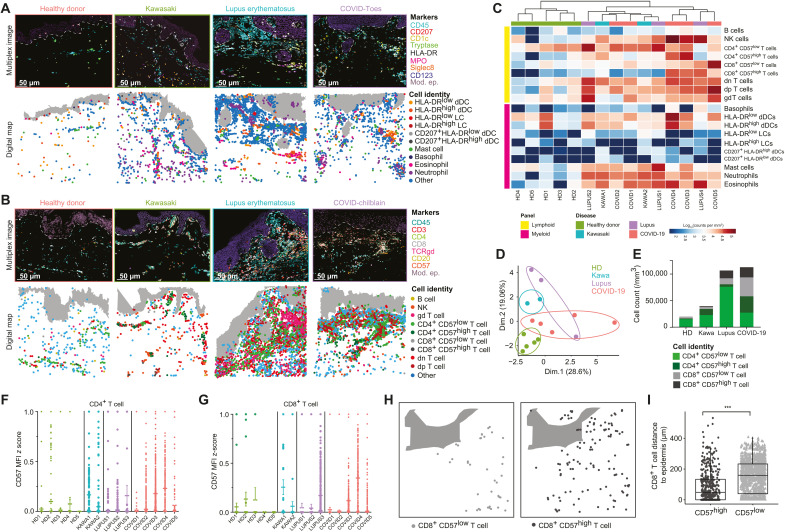
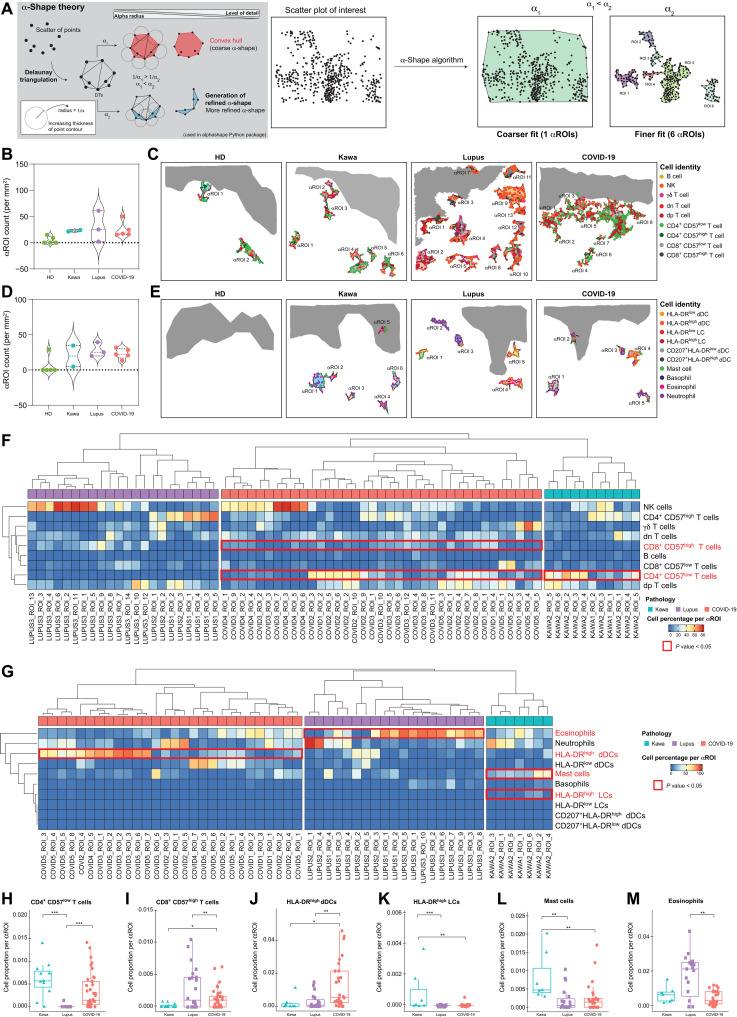
Routine clinical assays, such as conventional immunohistochemistry, often fail to resolve the regional heterogeneity of complex inflammatory skin conditions. We introduce MANTIS (Multiplex Annotated Tissue Imaging System), a flexible analytic pipeline compatible with routine practice, specifically designed for spatially resolved immune phenotyping of the skin in experimental or clinical samples. On the basis of phenotype attribution matrices coupled to α-shape algorithms, MANTIS projects a representative digital immune landscape while enabling automated detection of major inflammatory clusters and concomitant single-cell data quantification of biomarkers. We observed that severe pathological lesions from systemic lupus erythematosus, Kawasaki syndrome, or COVID-19-associated skin manifestations share common quantitative immune features while displaying a nonrandom distribution of cells with the formation of disease-specific dermal immune structures. Given its accuracy and flexibility, MANTIS is designed to solve the spatial organization of complex immune environments to better apprehend the pathophysiology of skin manifestations.


Figures

Fig. 1.
Fig. 1.. Between-stack microscope configuration allows sequential acquisition of 7+ channels with classical image processing.
(A) Sample preparation. FFPE-skin sections were cut and stained for myeloid and lymphoid panels after appropriate epitope retrieval and autofluorescence quenching. Sample images were then acquired using an SP8 confocal microscope from Leica Microsystems as described in (B). (B) Microscope configuration and acquisition settings. Mosaic sequential images were acquired using the between-stack configuration with tunable detection windows. Sequences were overlaid and 3D-stitched. An example of data acquisition is given for healthy (left) and pathological [systemic lupus erythematosus (SLE)] (right) skin. (C) Deconvolution of regions of interest and spectral unmixing. Acquired 3D images were deconvoluted and compensated to correct optical aberrations and 3D fluorescent spectral spillovers. (D) Representative 3D multiplex image of healthy (top) and pathological SLE (bottom) skin sample for lymphoid panel, staining CD45, CD3, CD4, CD8, TCRγδ, CD57, and CD20. (E) Colocalization of DAPI (4′,6-diamidino-2-phenylindole) and CD45 staining and respective RGB profiles. (F) Segmentation and single-cell database creation. Cell segmentation using the CD45 fluorescence channel allowed efficient isolation of individual objects, i.e., immune cells. Individual object statistics (xyz coordinates, sphericity, volume, and MFI) were extracted for each sample. Scale bars, 30 μm.
Fig. 2.
Fig. 2.. MANTIS algorithm allows automated cell type attribution and interactive exploration of skin myeloid immune topology.
(A) Automated tissue annotation. A reference attribution matrix defining the literature-based theoretical signature of a particular cell type was constructed and designated as MANTIS attribution matrix. A correlation matrix calculating Spearman coefficient between the single-cell database and MANTIS attribution matrix was computed. Each segmented cell was annotated to the cell type having the highest correlation coefficient, and cell type proportions were extracted. (B) Single-cell staining of all used biomarkers in identified myeloid cells. Scale bar, 5 μm. (C) MANTIS-simplified attribution matrix for myeloid panel. (D) Tissue annotation and cell proportion of pathological (SLE) skin. (E) Representative t-SNE plot of myeloid cell populations (top) and MFI levels of used markers (colored intensity scale) (bottom). (F) Representative 3D confocal multiplex image (top) and associated digital map (bottom) of predesigned MANTIS myeloid panel of pathological (SLE) skin. Scale bar, 50 μm. (G) Interactive reverse-gating. A population of interest (neutrophils) was selected on the t-SNE plot. Recomputation of the corresponding digital map enabled the visualization of the anatomical distribution of this particular population in the skin biopsy.
Fig. 3.
Fig. 3.. 3D quantitative and spatial analysis of skin immune cells at the cellular level provide insight into disease signatures.
(A and B) Representative 3D confocal multiplex images (top) and associated digital maps (bottom) of predesigned MANTIS myeloid (A) and lymphoid (B) panels of healthy and pathological skin. Scale bar, 50 μm. (C) Representative heatmap of LC and myeloid cell densities in logarithmic scale with hierarchical clustering. (D) Principal components analysis (PCA) of immune signatures of healthy and diseased skin. (E) Cell count per cubic millimeter of CD57low and CD57high T cells. (F and G) Dot plot of CD57 MFI z score in CD4+ (F) and CD8+ (G) T cells in healthy and diseased skin. (H and I) Representative digital map (H) and mean distance to epidermis (in μm) (I) of CD8+ CD57low (left) and CD57high (right) T cells in COVID-19 skin lesions. Means + SEM; ***P < 0.001, Mann-Whitney test.
Fig. 4.
Fig. 4.. Automatic detection of αROI enables exploration of inflammatory cluster topography in healthy and diseased skin.
(A) α-Shape algorithm. Delaunay triangulation of a given set of points formed a bounding polygon that contains all the points of the set. The α parameter was defined by the value α, and a circle with 1/α radius was drawn around each point of the dataset. The line between two circles’ meeting points formed a side of the bounding polygon, i.e., the α-shape. α value defines the detail level of the α-shape and allows modeling of voluminous structures (1/α1) or smaller structures (1/α2) having 1/α1 > 1/α2. (B and C) Violin plot (B) and representative digital maps (C) of lymphoid αROI density in healthy and pathological skin. (D and E) Violin plot (D) and representative digital maps (E) of myeloid αROI density in healthy and diseased skin. (F and G) Representative heatmaps of cell proportions in lymphoid (F) and myeloid (G) αROIs in pathological skin. A hierarchical clustering was applied on rows and on each pathology’s column. (H to M) Mean proportion of CD4+ CD57low T cells (H), CD8+ CD57high T cells (I), HLA-DRhigh dDCs (J), HLA-DRhigh LCs (K), mast cells (L), and eosinophils (M) per αROI in diseased skin. Means ± SEM; *P < 0.05, **P < 0.01, and ***P < 0.001, one-way analysis of variance (ANOVA) (H to M).

References

    1. W. R. Heath, F. R. Carbone, The skin-resident and migratory immune system in steady state and memory: Innate lymphocytes, dendritic cells and T cells. Nat. Immunol. 14, 978–985 (2013). - PubMed
    1. F. O. Nestle, P. Di Meglio, J. Z. Qin, B. J. Nickoloff, Skin immune sentinels in health and disease. Nat. Rev. Immunol. 9, 679–691 (2009). - PMC - PubMed
    1. J. Kanitakis, C. Lesort, M. Danset, D. Jullien, Chilblain-like acral lesions during the COVID-19 pandemic ("COVID toes"): Histologic, immunofluorescence, and immunohistochemical study of 17 cases. J. Am. Acad. Dermatol. 83, 870–875 (2020). - PMC - PubMed
    1. I.-I. Morar, F.-A. Tabăran, T. Mocan, E.-M. Jianu, M.-S. Orăsan, A.-D. Pop, R.-I. Orăsan, Immunohistochemical study of psoriatic plaques and perilesional skin in psoriasis vulgaris patients: A pilot study. Exp. Ther. Med. 18, 888–894 (2019). - PMC - PubMed
    1. K. Heinzmann, L. M. Carter, J. S. Lewis, E. O. Aboagye, Multiplexed imaging for diagnosis and therapy. Nat. Biomed. Eng. 1, 697–713 (2017). - PubMed