

Distinguishing Renal Cell Carcinoma From Normal Kidney Tissue Using Mass Spectrometry Imaging Combined With Machine Learning
- PMID: 37285559
- PMCID: PMC10309512
- DOI: 10.1200/PO.22.00668
Distinguishing Renal Cell Carcinoma From Normal Kidney Tissue Using Mass Spectrometry Imaging Combined With Machine Learning
Abstract
Purpose: Accurately distinguishing renal cell carcinoma (RCC) from normal kidney tissue is critical for identifying positive surgical margins (PSMs) during partial and radical nephrectomy, which remains the primary intervention for localized RCC. Techniques that detect PSM with higher accuracy and faster turnaround time than intraoperative frozen section (IFS) analysis can help decrease reoperation rates, relieve patient anxiety and costs, and potentially improve patient outcomes.
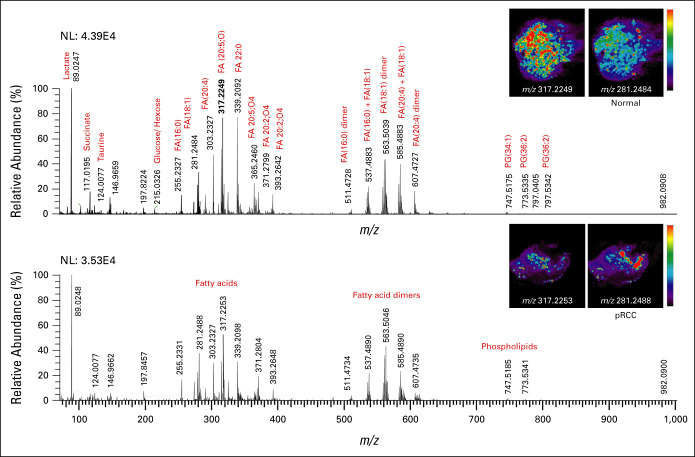
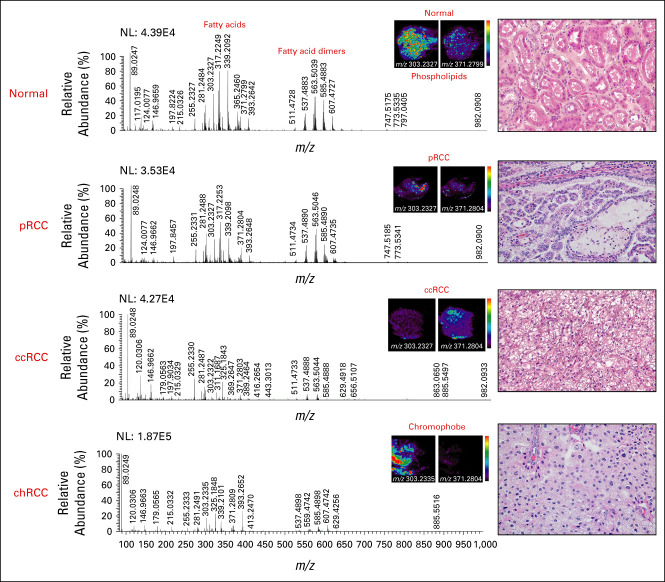
Materials and methods: Here, we extended our combined desorption electrospray ionization mass spectrometry imaging (DESI-MSI) and machine learning methodology to identify metabolite and lipid species from tissue surfaces that can distinguish normal tissues from clear cell RCC (ccRCC), papillary RCC (pRCC), and chromophobe RCC (chRCC) tissues.
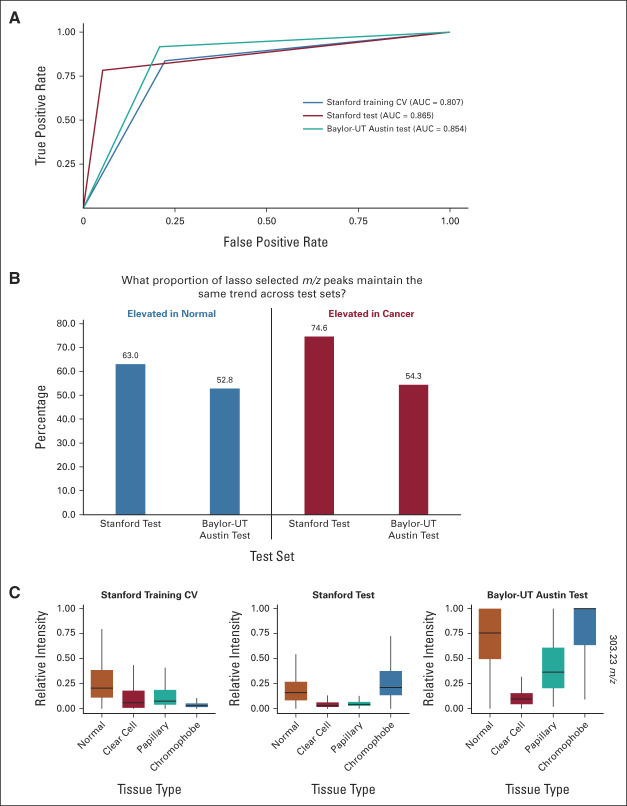
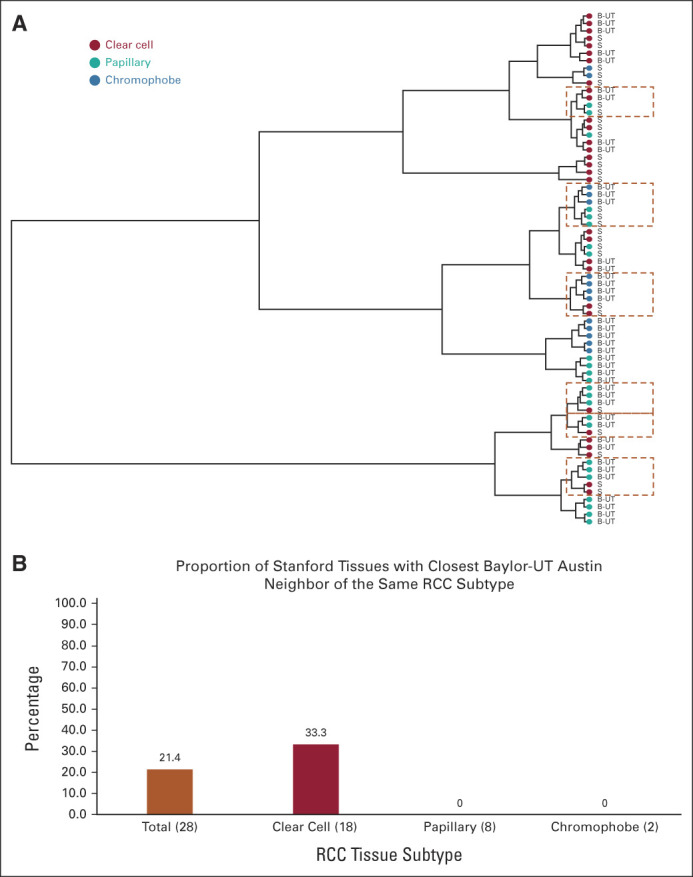
Results: From 24 normal and 40 renal cancer (23 ccRCC, 13 pRCC, and 4 chRCC) tissues, we developed a multinomial lasso classifier that selects 281 total analytes from over 27,000 detected molecular species that distinguishes all histological subtypes of RCC from normal kidney tissues with 84.5% accuracy. On the basis of independent test data reflecting distinct patient populations, the classifier achieves 85.4% and 91.2% accuracy on a Stanford test set (20 normal and 28 RCC) and a Baylor-UT Austin test set (16 normal and 41 RCC), respectively. The majority of the model's selected features show consistent trends across data sets affirming its stable performance, where the suppression of arachidonic acid metabolism is identified as a shared molecular feature of ccRCC and pRCC.
Conclusion: Together, these results indicate that signatures derived from DESI-MSI combined with machine learning may be used to rapidly determine surgical margin status with accuracies that meet or exceed those reported for IFS.
Conflict of interest statement
The following represents disclosure information provided by authors of this manuscript. All relationships are considered compensated unless otherwise noted. Relationships are self-held unless noted. I = Immediate Family Member, Inst = My Institution. Relationships may not relate to the subject matter of this manuscript. For more information about ASCO's conflict of interest policy, please refer to
Open Payments is a public database containing information reported by companies about payments made to US-licensed physicians (
Figures
Similar articles
-
Identification of diagnostic metabolic signatures in clear cell renal cell carcinoma using mass spectrometry imaging.Int J Cancer. 2020 Jul 1;147(1):256-265. doi: 10.1002/ijc.32843. Epub 2020 Jan 21. Int J Cancer. 2020. PMID: 31863456 Free PMC article.
-
Identification of novel biomarkers to distinguish clear cell and non-clear cell renal cell carcinoma using bioinformatics and machine learning.PLoS One. 2024 Jun 10;19(6):e0305252. doi: 10.1371/journal.pone.0305252. eCollection 2024. PLoS One. 2024. PMID: 38857246 Free PMC article.
-
The Impact of Histological Subtype on the Incidence, Timing, and Patterns of Recurrence in Patients with Renal Cell Carcinoma After Surgery-Results from RECUR Consortium.Eur Urol Oncol. 2021 Jun;4(3):473-482. doi: 10.1016/j.euo.2020.09.005. Epub 2020 Oct 24. Eur Urol Oncol. 2021. PMID: 33109495
-
Diagnostic and prognostic tissuemarkers in clear cell and papillary renal cell carcinoma.Cancer Biomark. 2010;7(6):261-8. doi: 10.3233/CBM-2010-0195. Cancer Biomark. 2010. PMID: 21694464 Review.
-
The Cancer Genome Atlas of renal cell carcinoma: findings and clinical implications.Nat Rev Urol. 2019 Sep;16(9):539-552. doi: 10.1038/s41585-019-0211-5. Epub 2019 Jul 5. Nat Rev Urol. 2019. PMID: 31278395 Review.
Cited by
-
Optical sensor for fast and accurate lung cancer detection with tissue autofluorescence and diffuse reflectance spectroscopy.Thorac Cancer. 2025 Jan;16(1):e15476. doi: 10.1111/1759-7714.15476. Epub 2024 Nov 18. Thorac Cancer. 2025. PMID: 39558507 Free PMC article.
-
Direct Three-Dimensional Mass Spectrometry Imaging with Laser Ablation Remote Atmospheric Pressure Photoionization/Chemical Ionization.Anal Chem. 2024 Aug 13;96(32):13326-13334. doi: 10.1021/acs.analchem.4c03402. Epub 2024 Jul 30. Anal Chem. 2024. PMID: 39077860 Free PMC article.
References
-
- Laganosky DD, Filson CP, Master VA. Surgical margins in nephron-sparing surgery for renal cell carcinoma. Curr Urol Rep. 2017;18:8. - PubMed
-
- Maurice MJ, Zhu H, Kim SP, et al. Reexamining the association between positive surgical margins and survival after partial nephrectomy in a large American cohort. J Endourol. 2016;30:698–703. - PubMed
-
- Borghesi M, Brunocilla E, Schiavina R, et al. Positive surgical margins after nephron-sparing surgery for renal cell carcinoma: Incidence, clinical impact, and management. Clin Genitourin Cancer. 2013;11:5–9. - PubMed
Publication types
MeSH terms
Grants and funding
LinkOut - more resources
Full Text Sources
Medical
Miscellaneous
