Review
. 2023 Nov;33(11):924-938.
doi: 10.1016/j.tcb.2023.05.002. Epub 2023 Jun 5.

How it feels in a cell

Affiliations
Review

How it feels in a cell

Martina Bonucci et al. Trends Cell Biol. 2023 Nov.

Abstract

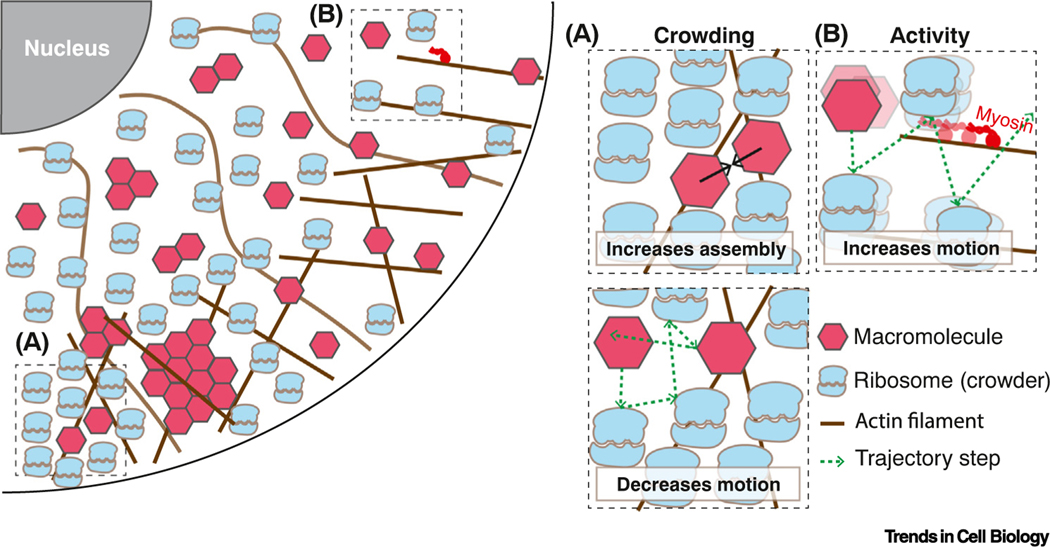
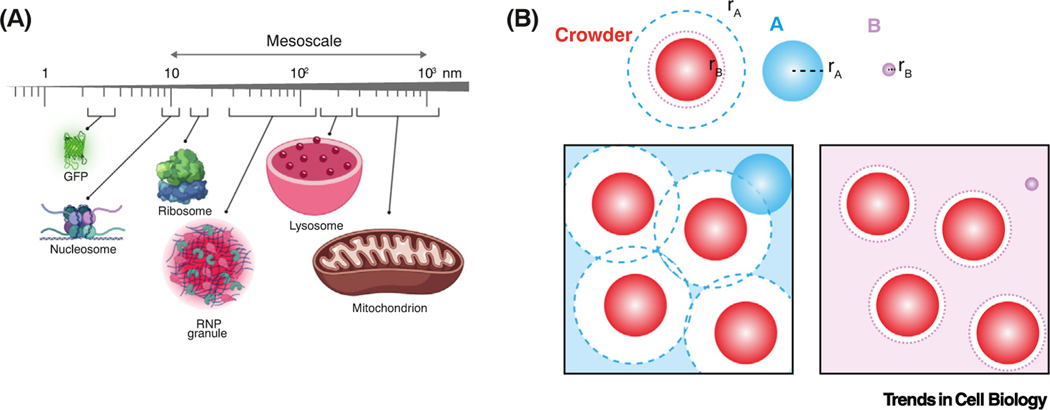
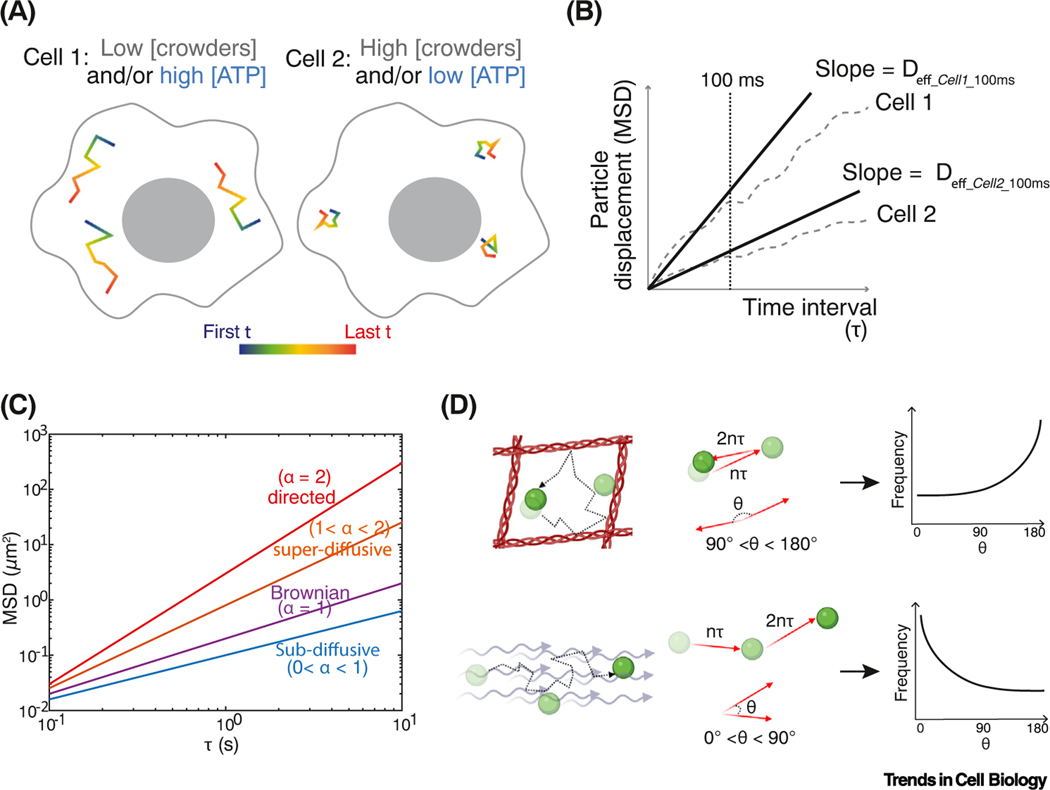
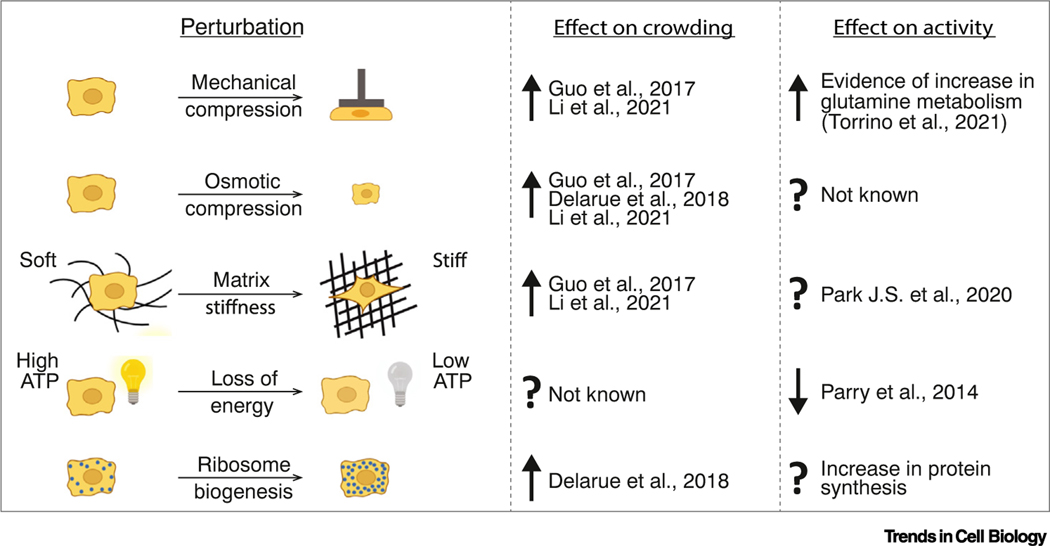
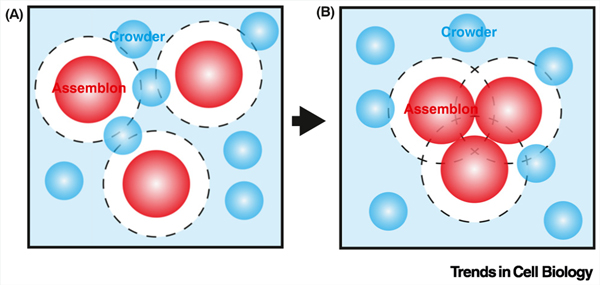
Life emerges from thousands of biochemical processes occurring within a shared intracellular environment. We have gained deep insights from in vitro reconstitution of isolated biochemical reactions. However, the reaction medium in test tubes is typically simple and diluted. The cell interior is far more complex: macromolecules occupy more than a third of the space, and energy-consuming processes agitate the cell interior. Here, we review how this crowded, active environment impacts the motion and assembly of macromolecules, with an emphasis on mesoscale particles (10-1000 nm diameter). We describe methods to probe and analyze the biophysical properties of cells and highlight how changes in these properties can impact physiology and signaling, and potentially contribute to aging, and diseases, including cancer and neurodegeneration.

Keywords: active matter; mechanobiology; mesoscale; microrheology; molecular crowding.


Conflict of interest statement

Declaration of interests The authors declare no competing interests.

Figures

Figure 1.
Figure 1.. The cell interior is crowded and far from thermal equilibrium.
(A) Macromolecular crowding can drive molecular assembly (top) and decrease particle diffusion (bottom). (B) Energy-consuming activities increase particle motion.
Figure 2.
Figure 2.. Size-scales in cells, and size-dependent volume exclusion.
(A) Diameter of molecules, molecular complexes, and organelles, mesoscale range indicated. (B) Crowders occupying the box limit the volume available to other particles depending on particle size. The center of particle B (lilac) can only occupy positions at least one radius (rB) away from the crowders (lilac broken circle). A larger particle A (blue) is excluded from a larger volume, also defined by its radius (rA, blue broken line). The lilac- and blue-shaded regions indicate the accessible volumes for particle A (left) and B (right), respectively. Abbreviation: RNP, ribonucleoprotein.
Figure 3.
Figure 3.. Particle-tracking microrheology and one-point rheology analysis.
(A) Hypothetical trajectories of tracer particles in different intracellular environments. Motion is decreased by high crowding, and increased by ATP-driven agitation. (B) Ensemble and time-averaged mean-squared displacement (MSD) plots of these hypothetical cells. Effective diffusion coefficients (Deff) are calculated from the slope of MSD as a function of time interval (τ). The cell is crowded, heterogeneous, and structured, giving different effective diffusion coefficients at different time scales. We therefore define an effective diffusion coefficient at a specific time scale, for example, effective diffusivity at 100 ms = Deff_100ms. Deff_100ms is higher for particles in cell 1 than in cell 2. Note: the choice of time scales (broken line) that can be investigated is dependent on the distribution of trajectory lengths that can be experimentally obtained. If the time scale chosen is much longer than the median track length, analysis will be biased to slow-moving particles, which can be misleading. (C) MSD is calculated at each time lag τ from an ensemble of particle trajectories after both time and ensemble averaging. Here, MSD is plotted on a log–log scale where the slope (exponent α) indicates different types of motion. (D) Next step angle bias of particles moving in a confined local region (top) or moving persistently in an active flow (bottom). Next step angle frequency distributions are plotted to the right.
Figure 4.
Figure 4.. Perturbations that impact crowding and activity.
Examples of how the extracellular environment and the cell state can influence molecular crowding and intracellular non-thermal energy, with references. See [23,44,107,109,126,133].
Figure I.
Figure I.. Illustration for depletion-attraction force.
(A) Due to steric constraints, crowders (cyan color) cannot access regions (black broken line) around the assemblons (red color). (B) When assemblons cluster, the extra space available to crowders (cyan color) increases the overall entropy of the system. The system tends toward maximum entropy; therefore, crowders favor assembly. This is called the depletion-attraction force.

References

    1. Zimmerman SB and Trach SO (1991) Estimation of macromolecule concentrations and excluded volume effects for the cytoplasm of Escherichia coli. J. Mol. Biol 222, 599–620 - PubMed
    1. Medalia O. et al. (2002) Macromolecular architecture in eukaryotic cells visualized by cryoelectron tomography. Science 298, 1209–1213 - PubMed
    1. Dill KA et al. (2011) Physical limits of cells and proteomes. Proc. Natl. Acad. Sci. U. S. A 108, 17876–17882 - PMC - PubMed
    1. Brocchieri L. and Karlin S. (2005) Protein length in eukaryotic and prokaryotic proteomes. Nucleic Acids Res. 33, 3390–3400 - PMC - PubMed
    1. Zhang J. (2000) Protein-length distributions for the three domains of life. Trends Genet. 16, 107–109 - PubMed

Publication types

LinkOut - more resources