. 2023 Jun 7;9(1):34.
doi: 10.1038/s41522-023-00397-1.

The ribonuclease PNPase is a key regulator of biofilm formation in Listeria monocytogenes and affects invasion of host cells

Affiliations

The ribonuclease PNPase is a key regulator of biofilm formation in Listeria monocytogenes and affects invasion of host cells

Ana Patrícia Quendera et al. NPJ Biofilms Microbiomes. .

Abstract

Biofilms provide an environment that protects microorganisms from external stresses such as nutrient deprivation, antibiotic treatments, and immune defences, thereby creating favorable conditions for bacterial survival and pathogenesis. Here we show that the RNA-binding protein and ribonuclease polynucleotide phosphorylase (PNPase) is a positive regulator of biofilm formation in the human pathogen Listeria monocytogenes, a major responsible for food contamination in food-processing environments. The PNPase mutant strain produces less biofilm biomass and exhibits an altered biofilm morphology that is more susceptible to antibiotic treatment. Through biochemical assays and microscopical analysis, we demonstrate that PNPase is a previously unrecognized regulator of the composition of the biofilm extracellular matrix, greatly affecting the levels of proteins, extracellular DNA, and sugars. Noteworthy, we have adapted the use of the fluorescent complex ruthenium red-phenanthroline for the detection of polysaccharides in Listeria biofilms. Transcriptomic analysis of wild-type and PNPase mutant biofilms reveals that PNPase impacts many regulatory pathways associated with biofilm formation, particularly by affecting the expression of genes involved in the metabolism of carbohydrates (e.g., lmo0096 and lmo0783, encoding PTS components), of amino acids (e.g., lmo1984 and lmo2006, encoding biosynthetic enzymes) and in the Agr quorum sensing-like system (lmo0048-49). Moreover, we show that PNPase affects mRNA levels of the master regulator of virulence PrfA and PrfA-regulated genes, and these results could help to explain the reduced bacterial internalization in human cells of the ΔpnpA mutant. Overall, this work demonstrates that PNPase is an important post-transcriptional regulator for virulence and adaptation to the biofilm lifestyle of Gram-positive bacteria and highlights the expanding role of ribonucleases as critical players in pathogenicity.


Conflict of interest statement

The authors declare no competing interests.

Figures

Fig. 1
Fig. 1. PNPase is important for Listeria monocytogenes invasion of human epithelial cell lines.
Quantification of intracellular bacteria in HeLa and HepG2 cells at 2 hours post-infection, at MOI 50 for HeLa and MOI 40 for HepG2. Averaged replicate values were normalized to inoculum concentration (CFU/mL at the time of infection) and the transformed data expressed as the percentage of surviving bacteria relative to the wild-type. Data represent mean ± SD of three independent experiments. Significance was determined by an unpaired t test; *P < 0.05, **P < 0.01.
Fig. 2
Fig. 2. Inactivation of PNPase affects colony morphology and motility of Listeria monocytogenes.
a Representative images of individual bacterial cells at mid-exponential phase (OD600 at 0.7–0.8) to assess cell size and morphology. Scale bars, 1 µm (left). Bar-plot of average cell sizes of two independent biological replicates of each strain (right). Data represent mean ± SD. Significance was determined by an unpaired t test. ns, not significant; *P < 0.05. b Representative images of macrocolony observation using a zoom microscope. Each strain was inoculated on BHI agar plate and incubated at 37 °C for 8 days. The lower panel corresponds to a zoom magnification. Scale bars, 1000 µm. c Representative images of swimming motility assessment from bacteria cultures spotted on 0.3% (w/v) BHI agar and incubated at 25 °C for 48 h (left). Bar-plot of swimming areas of each strain (right). Averaged replicate values were transformed as the percentage motility relative to the wild-type. Data represent mean ± SD of three independent experiments. Significance was determined by an unpaired t test; **P < 0.01, ***P < 0.005.
Fig. 3
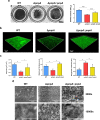
Fig. 3. PNPase affects the formation and structure of Listeria monocytogenes biofilms.
a Biofilms were grown statically at 37 °C for 48 h and biofilm biomass was determined using crystal violet staining method. On the left, biofilms were imaged after the addition of crystal violet. On the right, averaged values of the absorbance at 595 nm were plotted. Data represent mean ± SD of three independent experiments. Significance was determined by an unpaired t test; ***P < 0.005. b Representative three-dimensional structures of the biofilms were reconstructed after acquiring z-stack images by CLSM after growth at 37 °C for 48 h. c The biomass, maximum thickness and roughness coefficient of the imaged biofilms were quantified by COMSTAT. Replicate values were averaged and plotted. Data represent mean ± SD of three independent experiments. Significance was determined by an unpaired t test; *P < 0.05. d Representative images of biofilms observed by SEM at 2000x and ×10,000 magnifications.
Fig. 4
Fig. 4. Biofilm extracellular matrix content is reduced in ΔpnpA mutant biofilms.
a Relative quantification of extracellular DNA, protein, and polysaccharide content in the matrix of biofilms grown during 48 h at 37 °C. Averaged replicate values were transformed as the percentage relative to the wild-type. Data represent mean ± SD of three independent experiments. Significance was determined by an unpaired t test; *P < 0.05, **P < 0.01. b Representative images of CLSM analysis of the biofilm matrix composition. SYTO™ 9 was used as a control to dye bacteria, TO-PRO™-3 iodide was used for extracellular DNA staining, SYPRO® Ruby for protein staining, and RR-OP for polysaccharide staining.
Fig. 5
Fig. 5. Biofilms of the PNPase-depleted strain are more susceptible to antibiotics.
Biofilms grown for 48 h at 37 °C were subjected to a treatment of 24 h with high doses of gentamicin (10X MIC) or erythromycin (100X MIC). As bacterial cultivability control, BHI was added instead of antibiotic. After each treatment, recovered cultivable cells were quantified as CFU/mL. Replicate values were averaged and transformed as the percentage of CFU/mL relative to the wild-type. Data represent mean ± SD of three independent experiments. Significance was determined by two-way ANOVA; ns, not significant; ****P < 0.0001.
Fig. 6
Fig. 6. Transcriptomic analysis of PNPase-deficient biofilms.
a MA scatterplot comparing the expression of transcripts between two biological replicates of L. monocytogenes EGD-e wild-type and ΔpnpA mutant biofilms. Genes with significantly different expressions are highlighted in red if they are upregulated or in green if they are downregulated in ΔpnpA biofilms compared to wild-type. The FDR cut-off is <0.10. The two horizontal lines correspond to the cut-off of a log2 fold change of 1, and the vertical line to the cut-off of the log2 CPM of 3. NS not significant. b Global visualization of differentially expressed genes (DEGs) divided into general biological categories. The number of genes belonging into each category is in white. c DEGs with significantly increased enrichment grouped into predicted KEGG pathways. d Heatmap of the transcriptional profile of the DEGs. Hierarchical clustering was done to group genes with similar expression pattern in terms of log2 RPKM. e Read coverage plots of three upregulated (lmo0096, lmo0783, lmo0784) and three downregulated genes (lmo1984, lmo1986, lmo2006). lmo0783-0784 are shown in operon. Blue line corresponds to wild-type, while red line corresponds to ΔpnpA mutant. The y axis represents the coverage of reads and the maximum value of each gene is shown. The x axis represents the gene position.
Fig. 7
Fig. 7. The role of PNPase in the stability and mRNA levels of biofilm and virulence-related genes.
a Northern blots probed with specific oligos for the detection of lmo0048, lmo0096, lmo2125, and lmo2006, comparing RNA extracted from rifampicin-treated cultures of wild-type and ΔpnpA mutant strain. RNA stability is shown in minutes under the respective transcript. tmRNA serves as a loading control. A representative gel is shown for each probe from two independent replicates. An RNA size marker is shown on the left of the panel. Two bands were detected with the lmo0048 probe; half-life quantification shown below the corresponding image is related to the shorter band. Quantification of the upper band showed a stability of 6.2 ± 0.6 in the wild-type and 7.0 ± 0.58 in the ΔpnpA mutant. NQ non-quantifiable. b β-galactosidase activity of Plmo0048-lacZ fusion and Plmo2006-lacZ fusion in wild-type and ΔpnpA mutant strain grown in BHI until stationary phase. Data represent mean ± SEM of three independent experiments. Significance was determined by two-way ANOVA; ns, not significant; *P < 0.05. c Northern blots probed with specific oligos for the detection of prfA, hly, inlA and mogR, comparing RNA extracted from rifampicin-treated cultures of wild-type and ΔpnpA mutant strain. RNA stability is shown in minutes under the corresponding image. tmRNA serves as a loading control. A representative gel is shown for each probe from two independent replicates. An RNA size marker is shown on the left of the panel. d Western blot analysis of total protein extract using anti-InlA antibody. Anti-EF-Tu antibody was used as loading control. RQ relative quantification.

Similar articles

Cited by

References

    1. da Silva RAG, Afonina I, Kline KA. Eradicating biofilm infections: an update on current and prospective approaches. Curr. Opin. Microbiol. 2021;63:117–125. doi: 10.1016/j.mib.2021.07.001. - DOI - PubMed
    1. Penesyan A, Paulsen IT, Kjelleberg S, Gillings MR. Three faces of biofilms: a microbial lifestyle, a nascent multicellular organism, and an incubator for diversity. NPJ Biofilms Microbiomes. 2021;7:1–9. doi: 10.1038/s41522-021-00251-2. - DOI - PMC - PubMed
    1. Vestby LK, Grønseth T, Simm R, Nesse LL. Bacterial biofilm and its role in the pathogenesis of disease. Antibiotics. 2020;9:59. doi: 10.3390/antibiotics9020059. - DOI - PMC - PubMed
    1. Shi X, Zhu X. Biofilm formation and food safety in food industries. Trends Food Sci. Technol. 2009;20:407–413. doi: 10.1016/j.tifs.2009.01.054. - DOI
    1. Sauer K, et al. The biofilm life cycle: expanding the conceptual model of biofilm formation. Nat. Rev. Microbiol. 2022;20:608–620. doi: 10.1038/s41579-022-00767-0. - DOI - PMC - PubMed

Publication types