. 2023 Jun 8;13(1):92.
doi: 10.1038/s41408-023-00863-1.

Integrated multi-omics analyses reveal homology-directed repair pathway as a unique dependency in near-haploid leukemia

Affiliations

Integrated multi-omics analyses reveal homology-directed repair pathway as a unique dependency in near-haploid leukemia

Yunpeng Liu-Lupo et al. Blood Cancer J. .

Abstract

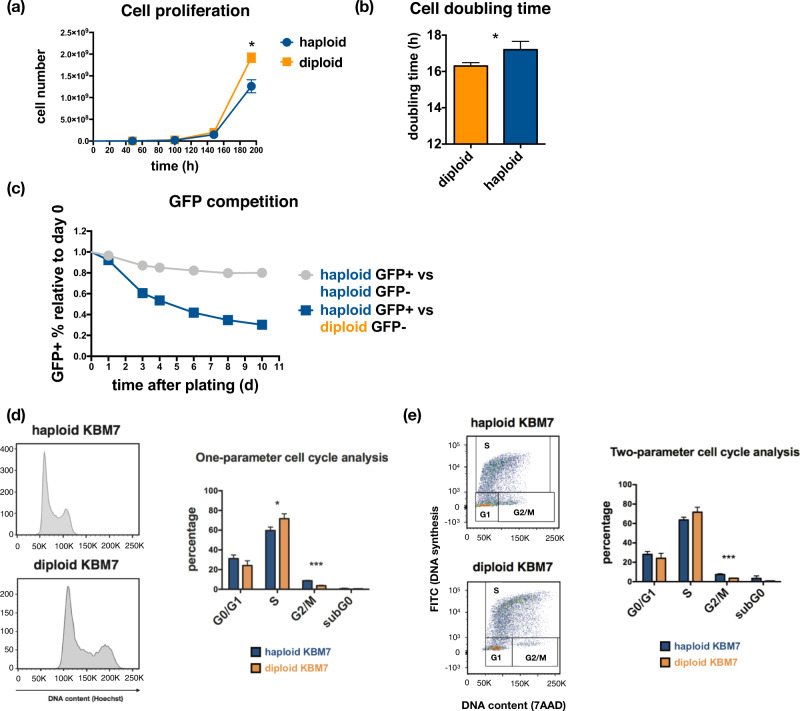
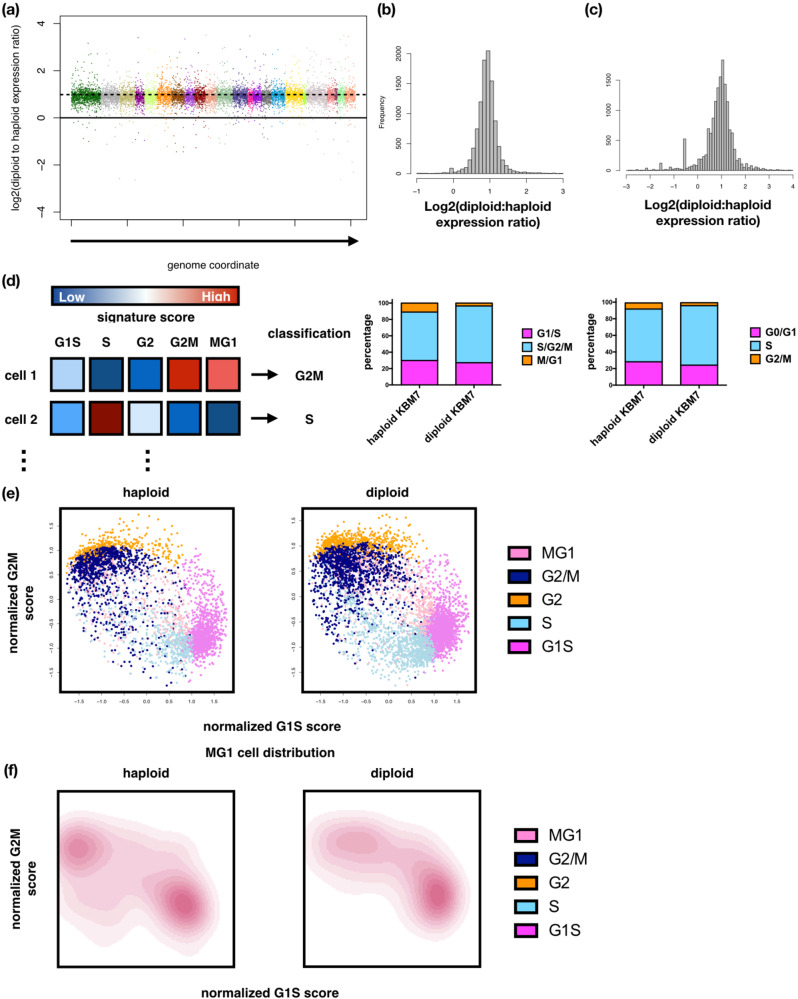
Whole chromosome losses resulting in near-haploid karyotypes are found in a rare subgroup of treatment-refractory acute lymphoblastic leukemia. To systematically dissect the unique physiology and uncover susceptibilities that can be exploited in near-haploid leukemia, we leveraged single-cell RNA-Seq and computational inference of cell cycle stages to pinpoint key differences between near-haploid and diploid leukemia cells. Combining cell cycle stage-specific differential expression with gene essentiality scores from a genome-wide CRISPR-Cas9-mediated knockout screen, we identified the homologous recombination pathway component RAD51B as an essential gene in near-haploid leukemia. DNA damage analyses revealed significantly increased sensitivity of RAD51-mediated repair to RAD51B loss in the G2/M stage of near-haploid cells, suggesting a unique role of RAD51B in the homologous recombination pathway. Elevated G2/M and G1/S checkpoint signaling was part of a RAD51B signature expression program in response to chemotherapy in a xenograft model of human near-haploid B-ALL, and RAD51B and its associated programs were overexpressed in a large panel of near-haploid B-ALL patients. These data highlight a unique genetic dependency on DNA repair machinery in near-haploid leukemia and demarcate RAD51B as a promising candidate for targeted therapy in this treatment-resistant disease.


Conflict of interest statement

D.M.W. is an employee of Merck Research Laboratories. A.R. is a co-founder and equity holder of Celsius Therapeutics, an equity holder in Immunitas, and until July 31, 2020 was an SAB member of ThermoFisher Scientific, Syros Pharmaceuticals, Neogene Therapeutics and Asimov. From August 1, 2020, A.R. is an employee of Genentech, and has equity in Roche.

Figures

Fig. 1
Fig. 1. Near-haploid and diploidized KBM7 cells show different proliferation rates due to differences in cell cycle profiles.
a Proliferation curves of near-haploid (haploid) and diploidized (diploid) KBM7 cells. *: Student’s t-test p-value = 0.0234 (n = 3). b Cell doubling time (hours) quantified from data in (a). *: Student’s t-test p-value = 0.034 (n = 3). c In vitro growth competition assay between haploid and diploid KBM7 cells. Shown are relative percentages (average from 3 technical replicates) of GFP-labeled haploid cells in a mixture of GFP+ and GFP− haploid (gray curve) or diploid (blue curve) cells. d Cell cycle content analysis of KBM7 cells using Hoechst live-staining and mathematical modeling of cell cycle stage distribution in FlowJo. *: Student’s t-test p-value = 0.026 (n = 3), ***: Student’s t-test p-value = 0.0002 (n = 3). e Two-parameter cycle content analysis of KBM7 cells using BrdU pulse-labeling and total DNA content staining with 7-AAD. 3 replicates are used for each sample in (d) and (e) *: Student’s t-test p-value = 0.0015 (n = 3). Data shown in (d) and (e) are mean values of replicates.
Fig. 2
Fig. 2. Single-cell RNA-seq of KBM7 cells and computational inference of cell cycle stages reveal aberrant cell cycle expression programs in near-haploid cells.
a Bulk gene expression ratios between diploid and haploid KBM7 cells. Shown are log2-ratios computed from the mean expression calculated from 3 independent DNA content-verified clones in each group. Each color group represents an individual chromosome. b Histogram of expression ratios shown in (a). c Histogram of log2-expression ratios computed from single-cell gene expression profiles in diploid and haploid KBM7 cells. d Left panel: schematic of method for assigning cell cycle stages using single-cell expression profiles. Middle panel: computationally assigned cell cycle stages. Right panel: flow cytometry-based cell cycle stage assignment of KBM7 cells. e G1S and G2M metagene scores of single haploid (left) and diploid (right) KBM7 cells. Cells are colored according to cell cycle stages. f Density estimation of the distribution of M/G1 haploid (left) and diploid (right) KBM7 cells.
Fig. 3
Fig. 3. Near-haploid KBM7 cells show overexpression of genes in DNA damage repair and mitochondria function in post-replication phases.
a Relative expression of key cyclins in haploid (upper panels) and diploid (lower panels) KBM7 cells throughout the cell cycle. Cell cycle stage assignments are shown on the rightmost panels. Horizontal axes are G1S metagene scores and vertical axes are G2M metagene scores. b Example of elliptical trajectory (gray curve) fitted to diploid KBM7 cells, with the neighborhood of cells used for smoothing pseudo-time expression estimation shown as dotted rolling circle. c Inferred cell cycle pseudo-time trajectory of cyclin genes shown in (a), with estimated 95% confidence interval shown as shaded regions. d Left panel: empirical cumulative distribution functions (CDFs) of diploid to haploid single-cell gene expression ratios in log2 space, grouped by cell cycle stages. Dotted vertical line shows cutoff of 0.5 (~1.4 in linear space) for identifying cell cycle stages with ratios substantially lower than 2:1 (1 in logarithm space). Right panel: number of genes in each cell cycle stage with diploid:haploid expression ratios less than the cutoff set on the left panel. Colored arrows point to the cell cycle stages with the largest number of genes below the cutoff.
Fig. 4
Fig. 4. Near-haploid KBM7 cells show elevated expression of RAD51 and RAD51B in post-replication phases and unique genetic dependency on RAD51B compared to diploidized cells.
a Expression patterns of RAD51 and RAD51B throughout the cell cycle in diploid (left panels) and haploid (right panels) KBM7 cells. Arrows highlight cells with peak expression in each cell type for each gene. b Inferred cell cycle pseudo-time trajectory for RAD51 and RAD51B, with estimated 95% confidence interval shown as shaded regions. c Schematic for genome-wide CRISPR-Cas9 gene essentiality screen in haploid and diploid KBM7 cells. d Gene set enrichment analysis (GSEA) of genes essential to haploid but not diploid KBM7 cells. Shown are normalized enrichment scores. All categories show significant enrichment (Kolmogorov–Smirnov test p-values < 0.01 with false discovery rate <0.25). e Volcano plots of relative enrichment/depletion scores of genes (horizontal axis) and the associated significance levels of the scores (vertical axis). RAD51B is highlighted in green. f Venn-diagram highlighting RAD51B and other genes as uniquely important to near-haploid KBM7 cells by comparing essential genes across a panel of cell lines [44], hematologic cell lines, and haploid KBM7 cells (this study and Wang et al. 2015 study [38]). Genes shown were pre-filtered for those showing higher cell cycle stage-specific expression in near-haploid KBM7 cells as identified by our single-cell analyses. g 1-D density distribution plots (darker gray denotes higher relative density of values) of the log2-fold change of individual sgRNAs. Log2-fold change values of sgRNAs targeting the 6 essential genes specific to near-haploid cells as shown in (f) are highlighted with red bars.
Fig. 5
Fig. 5. Near-haploid KBM7 cells display survival disadvantages upon RAD51B loss due to impairment of RAD51-mediated repair of double-strand DNA breaks.
a Growth competition assay between haploid (blue) or diploid (orange) KBM7 cells with inducible shRNA-mediated knockdown of RAD51B expression and those expressing hairpins against the firefly luciferase gene (shCtrl). Plotted are relative enrichment/depletion of shRAD51B hairpin-expressing cells (shRAD51B:shCtrl), normalized to data from day 0 of the assay (72 h after doxycycline induction). Shown are 2 different hairpins against RAD51B. Western blots verifying knockdown are shown next to the competition assay curves. b Left panel: growth competition between KBM7 haploid and diploid cells with sgRNA-mediated depletion of RAD51B. Shown are relative proportions of cells with sgRNA expression in a 1:1 starting mixture with cells expressing a control sgRNA against LacZ. Right panel: estimated proportion of cells in each cell cycle stage using DNA content by Hoechst 33342 staining for RAD51B-/- clones 2.4 (haploid) and 2.5 (diploid) as well as knockout control (sgLacZ) cells. c Left panel: γ-H2AX foci counts in haploid and diploid KBM7 cells as well as a near-triploid CML cell line, K562, across 3 replicates each. Bars show mean foci count +/- SEM. Right panel: Ratio of γ-H2AX foci counts in diploid to haploid KBM7 cells. *: One-sample Student’s t-test p-value = 0.015 (n = 3). d Number (left panels) and diploid:haploid ratios (right panels) of γ-H2AX (upper panels) and RAD51 foci (lower panels) in haploid and diploid KBM7 cells, grouped by DNA content (DAPI signal) bins corresponding to different cell cycle stages. One-sample Student’s t-test p-value = 0.04 for γ-H2AX foci ratios (n = 3) and 0.021 for RAD51 foci ratios (n = 3). e Co-localization of γ-H2AX and RAD51 foci in haploid and diploid KBM7 cells quantified using two different metrics of co-localization (schematic shown above plots), grouped by cell cycle stages. *: Student’s t-test p-value = 0.042 (n = 3). f γ-H2AX and RAD51 foci counts in Cas9-expressing KBM7 cells with gRNA-mediated knockout of RAD51B compared to control cells (expressing gRNA against the LacZ gene). g Co-localization of γ-H2AX and RAD51 foci in haploid and diploid KBM7 cells with or without RAD51B knockout, quantified using two different metrics of co-localization (schematic shown above plots) and grouped by cell cycle stages. *: Student’s t-test p-value 0.004 (n = 3 for sgLacZ cells and n = 4 for RAD51B knockout cells).
Fig. 6
Fig. 6. A pre-clinical model of near-haploid B-ALL shows in vivo up-regulation of RAD51B and G2/M checkpoint signatures in response to combination chemotherapy.
a Uniform Manifold Approximation and Projection (UMAP) plot of single-cell transcriptomic profiles across PDX leukemia cells in different conditions. BM: bone marrow, SP: spleen. Cells are color-coded according to their treatment groups. b Violin plots showing single-cell expression of a RAD51B signature program in response to combination chemotherapy (red) vs cells treated with vehicle (gray) in a PDX model of near-haploid B-ALL. VXDL: vincristine, dexamethasone, doxorubicin and L-asparaginase. ****: Wilcoxon rank-sum test p-value < 2.2 × 10−16, ***: Wilcoxon rank-sum test p-value = 0.0017. n.s.: Wilcoxon rank-sum test p-value = 0.424. c Left panel: combined UMAP plot of all 11,922 single leukemia cell transcriptomes in the experiment, with cells color-coded according to their labels assigned by unsupervised clustering. Middle (near-haploid B-ALL) and right (diploidized B-ALL) panels: participation of each sample in each of the clusters, shown in colored bars representing percentages. d Violin plots of expression of top 10 (ranked by log2 fold change values) Cluster 2 marker genes in each cluster. e, f Analysis of microarray expression profiles in B-ALL patients showing gross chromosome gains or losses. e PCA plot of individual samples colored by karyotype groups. f Same plot as (e) with individual data points colored by the relative expression of the RAD51B signature. g Violin plots showing normalized RAD51B expression in B-ALL patient samples in each karyotype group. Wilcoxon rank-sum test p-values are labeled between groups. Number of samples in each group: Near-diploid: n = 19, low hypodiploid: n = 17, masked low hypodiploid: n = 6, near-haploid: n = 35, masked near-haploid: n = 17, high hyperdiploid: n = 4, high hypodiploid: n = 1).

References

    1. Ries LAG, Smith MA, Gurney JG, Linet M, Tamra T, Young JL, et al. Cancer incidence and survival among children and adolescents: United States SEER Program 1975–1995. NIH Pub No 99-4649. 1999; 179 pp.
    1. Nachman JB, Heerema NA, Sather H, Camitta B, Forestier E, Harrison CJ, et al. Outcome of treatment in children with hypodiploid acute lymphoblastic leukemia. Blood. 2007;110:1112–5. doi: 10.1182/blood-2006-07-038299. - DOI - PMC - PubMed
    1. Lemez P, Attarbaschi A, Béné MC, Bertrand Y, Castoldi G, Forestier E, et al. Childhood near-tetraploid acute lymphoblastic leukemia: an EGIL study on 36 cases. Eur J Haematol. 2010;85:300–8. doi: 10.1111/j.1600-0609.2010.01493.x. - DOI - PubMed
    1. Holmfeldt L, Wei L, Diaz-Flores E, Walsh M, Zhang J, Ding L, et al. The genomic landscape of hypodiploid acute lymphoblastic leukemia. Nat Genet. 2013;45:242–52. doi: 10.1038/ng.2532. - DOI - PMC - PubMed
    1. Kotecki M, Reddy PS, Cochran BH. Isolation and characterization of a near-haploid human cell line. Exp Cell Res. 1999;252:273–80. doi: 10.1006/excr.1999.4656. - DOI - PubMed

Publication types