. 2023 Jun 7;14(1):3280.
doi: 10.1038/s41467-023-38383-y.

Elevated plasma complement factor H related 5 protein is associated with venous thromboembolism

Affiliations

Elevated plasma complement factor H related 5 protein is associated with venous thromboembolism

Maria Jesus Iglesias et al. Nat Commun. .

Erratum in

  • Author Correction: Elevated plasma complement factor H related 5 protein is associated with venous thromboembolism.
    Iglesias MJ, Sanchez-Rivera L, Ibrahim-Kosta M, Naudin C, Munsch G, Goumidi L, Farm M, Smith PM, Thibord F, Kral-Pointner JB, Hong MG, Suchon P, Germain M, Schrottmaier W, Dusart P, Boland A, Kotol D, Edfors F, Koprulu M, Pietzner M, Langenberg C, Damrauer SM, Johnson AD, Klarin DM, Smith NL, Smadja DM, Holmström M, Magnusson M, Silveira A, Uhlén M, Renné T, Martinez-Perez A, Emmerich J, Deleuze JF, Antovic J, Soria Fernandez JM, Assinger A, Schwenk JM, Souto Andres JC, Morange PE, Butler LM, Trégouët DA, Odeberg J. Iglesias MJ, et al. Nat Commun. 2023 Nov 27;14(1):7752. doi: 10.1038/s41467-023-43764-4. Nat Commun. 2023. PMID: 38012230 Free PMC article. No abstract available.

Abstract

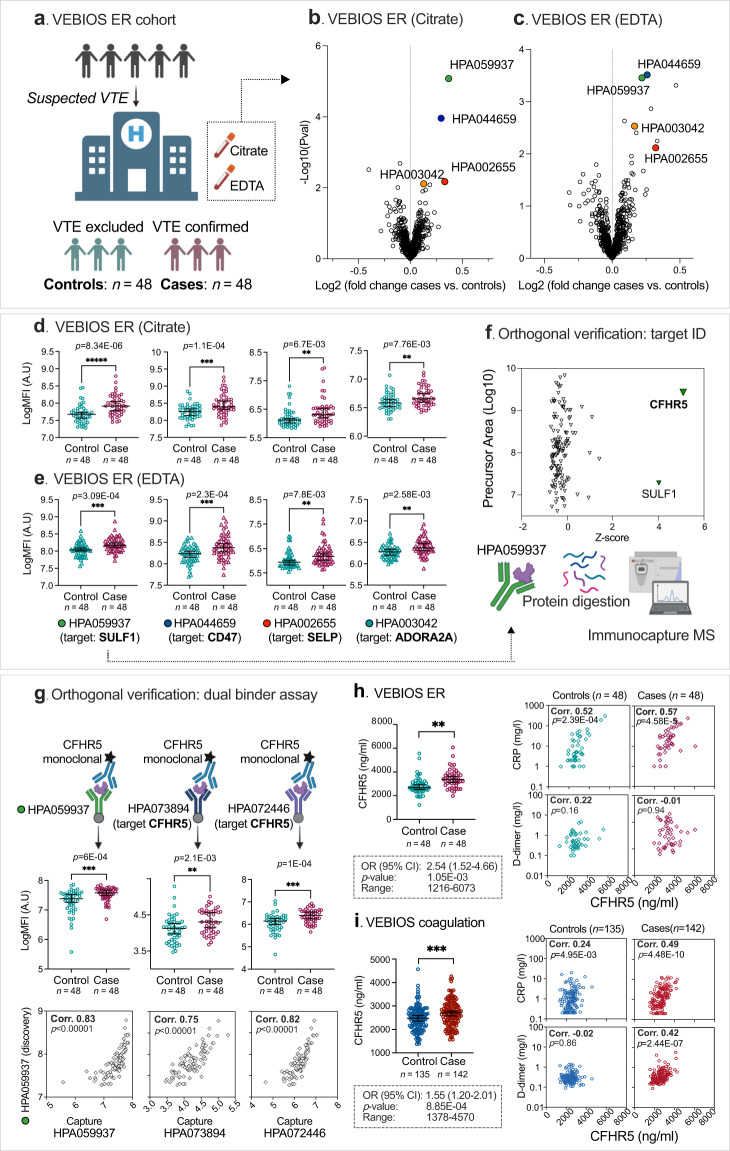
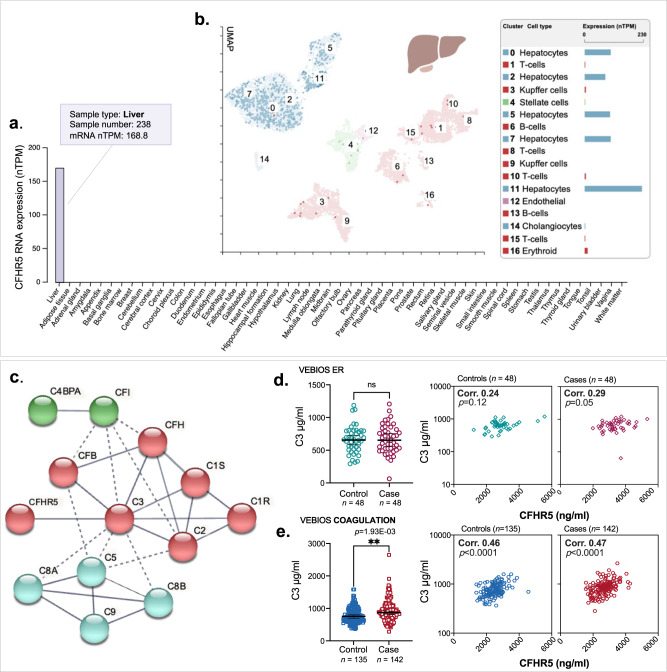
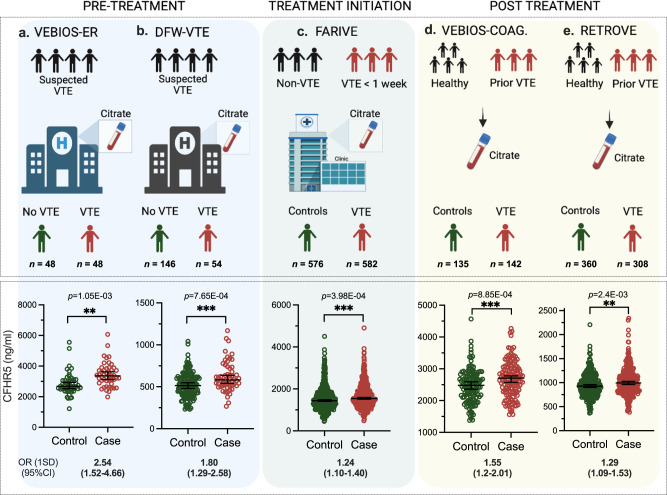
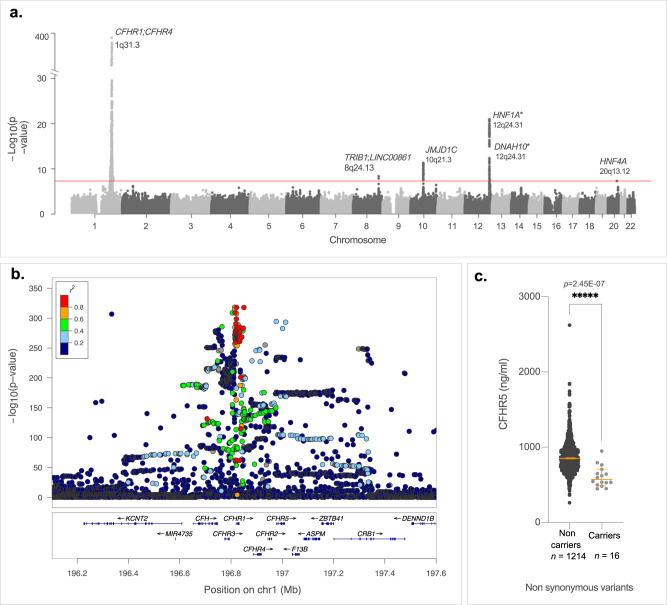
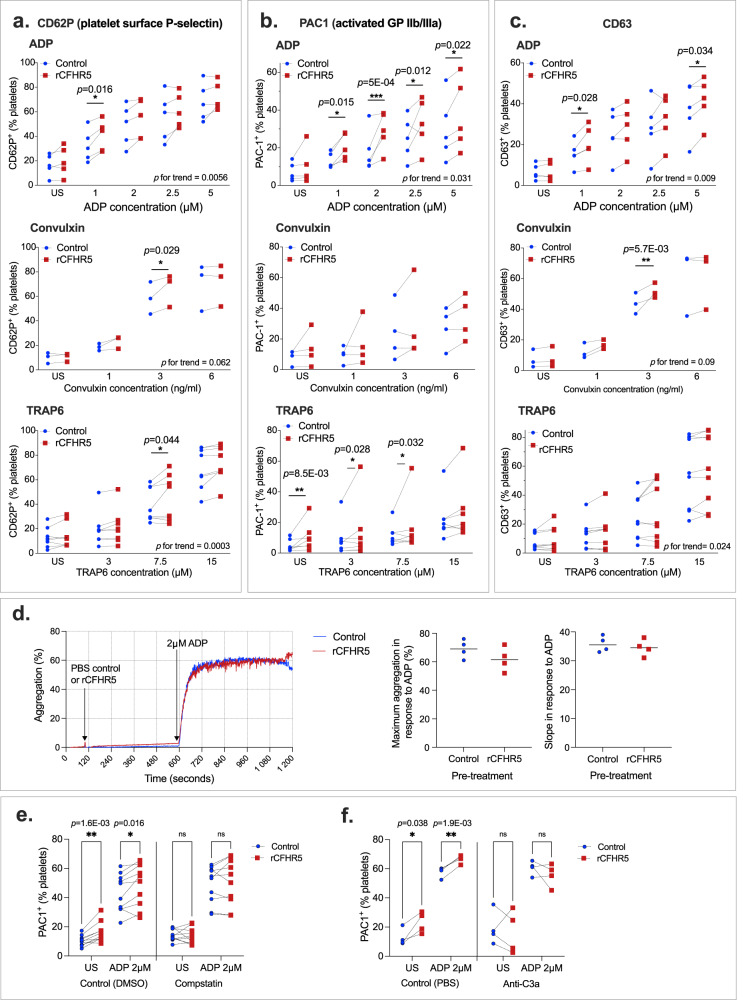
Venous thromboembolism (VTE) is a common, multi-causal disease with potentially serious short- and long-term complications. In clinical practice, there is a need for improved plasma biomarker-based tools for VTE diagnosis and risk prediction. Here we show, using proteomics profiling to screen plasma from patients with suspected acute VTE, and several case-control studies for VTE, how Complement Factor H Related 5 protein (CFHR5), a regulator of the alternative pathway of complement activation, is a VTE-associated plasma biomarker. In plasma, higher CFHR5 levels are associated with increased thrombin generation potential and recombinant CFHR5 enhanced platelet activation in vitro. GWAS analysis of ~52,000 participants identifies six loci associated with CFHR5 plasma levels, but Mendelian randomization do not demonstrate causality between CFHR5 and VTE. Our results indicate an important role for the regulation of the alternative pathway of complement activation in VTE and that CFHR5 represents a potential diagnostic and/or risk predictive plasma biomarker.


Conflict of interest statement

Dr. Klarin is a scientific advisor and reports consulting fees from Bitterroot Bio, Inc unrelated to the present work. All other authors declare no competing interests.

Figures

Fig. 1
Fig. 1. Plasma proteomics profiling identifies CFHR5 associated with VTE.
a Overview of the VEBIOS ER discovery cohort. 756 HPA antibodies, targeting 408 candidate proteins, were used to analyse plasma samples using affinity proteomics. Log fold changes in antibody MFI (median fluorescent intensity) signal were calculated between VTE cases (n = 48) and controls (n = 48) in (b) citrate or (c) EDTA anticoagulated plasma; coloured circles indicate antibodies that generated signals significantly associated with VTE in both. MFI signals generated by these antibodies for controls (n = 48) and cases (n = 48) in (d) citrate plasma and (e) EDTA plasma. f Immunocapture-mass spectrometry identification of protein targets of HPA059937 (n = 3 of independent biological replicates). g Dual binder assays were developed using an anti-CFHR5 detection antibody, combined with HPA059937 (raised against SULF1), anti-CFHR5 HPA073894 or anti-CFHR5 HPA072446 as capture antibodies. Monoclonal anti-CFHR5 (MAB3845) was applied as detection antibody in the three combinations. CFHR5 levels in the citrated plasma samples were re-analysed, using the respective dual binder assays, to determine levels (MFI) in controls (n = 48) vs. cases (n = 48) and the correlation between the signal and those generated by the original single binder assay using HPA059937 [all p < 1E-04]. Dual binder assay using capture antibody HPA072446 with a recombinant protein standard and MAB3845 as detection antibody, was used for absolute quantification of CFHR5 in samples from: (h) VEBIOS ER and (i) VEBIOS Coagulation (controls = 135, cases = 142). CFHR5 concentration was measured in controls and cases, with associated OR (odds ratio per 1 standard deviation increase [h and i, left]) or used to determine the correlation with C-reactive protein (CRP), or D-dimer concentration [h and i, right panels]. All data in dot plots (1 di) are represented as median value with 95% CI (confidence interval). Case and control groups was compared using a linear model adjusting for age and sex in d, e, g, h and i.*****p < 0.00001, ****p < 0.0001, ***p < 0.001, **p < 0.01. Two-sided Spearman´s correlation analysis for h and i. For summary statistics see Supplementary data 1 [Tab_2, Panel A]. Source data are provided as a Source Data file (bi).
Fig. 2
Fig. 2. CFHR5 is expressed in hepatocytes and is VTE-associated independent of C3.
a mRNA expression of CFHR5 across 55 different human tissue types. b Expression of CFHR5 in different liver cell types, analysed by ssRNAseq. c STRING protein-protein interaction analysis for genes identified as potentially co-expressed with CFHR5 in liver by correlation-based analysis of bulk mRNAseq. Complement component 3 (C3) concentration was measured in plasma from (d) VEBIOS ER (n = 48 + 48) or (e) VEBIOS coagulation (n = 135 + 142) to determine: differences between controls and cases (d and e, left), or correlation with CFHR5 in controls or cases (d and e, right panels). Case and control groups was compared using a linear model adjusting for age and sex (d, e) **p < 0.01. Dot plots (d, e) are represented as median value with 95% CI. Two-sided Spearman´s correlation analysis for 2d and 2e. Summary of statistical analysis can be found in Supplementary data 1 [Tab_2, Panel B]. Source data are provided as a Source Data file (d, e). C4BPA complement factor 4 binding protein, CFI complement factor I, CFB complement factor B, CFH complement factor H, C1S complement component 1, C1R complement component 1, C2 complement component 2, C8a complement component C8 alpha chain, C8b complement component C8 beta chain, C5 complement component 5, C9 complement component 9.
Fig. 3
Fig. 3. CFHR5 concentration is associated with VTE in 5 independent studies.
Plasma samples were generated as part of: (a) the Swedish VEBIOS ER or (b) the Swedish DFW-VTE study, both of which recruited patients presenting with suspected VTE. Samples were drawn pre- treatment, and cases and controls were identified based on confirmed or ruled out diagnosis. c The French FARIVE study recruited patients with confirmed acute VTE, with controls recruited from hospital patients treated for non-VTE causes. Samples were drawn within 1 week from diagnosis, during initiation of treatment (d) The Swedish VEBIOS Coagulation or (e), Spanish RETROVE study recruited cases from patients who had a prior first time VTE, sampled post-treatment (6–12 months anticoagulants), with healthy controls recruited from the general population. CFHR5 concentration was measured in the respective samples using a dual binder assay. Case and control groups was compared using a linear model adjusting for age and sex (3a–e). ***p < 0.001, ****p < 0.0001. OR (1 SD) = Odds ratio for 1 standard deviation elevation. CI confidence interval. All dot plots are represented as median value with 95% CI. Source data are provided as a Source Data file.
Fig. 4
Fig. 4. GWAS analysis identifies a CFHR5 pQTL on Chromosome 1 q31.3.
a Manhattan plot of the meta-analysis on INVENT-MVP consortium resources [17] showing six loci associated with CHFR5 plasma levels and VTE risk: CFHR1, CFHR4 (rs10737681, p = 2.94E-396), HNF1A (rs2393776, p = 1.48E-21), JMJD1C (rs7916868, p = 4.61E-12), TRIB1 (rs28601761, p = 4.39E-09), DNAH10 (rs7133378, p = 2.43E-08) and HNF4A (rs1800961, p = 4.97E-08). Lead SNPs at HNF1A and DNAH10 are rs2393776 and rs7133378, respectively. They are ~3 Mb apart and do not show any linkage disequilibrium (pairwise r2 = 0). b Regional association plot at the Chromosome 1 locus covering >10 Mb from CFHR1 to CFHR5 around the lead SNP associated with CFHR5 plasma levels. c CFHR5 plasma levels for 16 patients who are carriers of rare non-synonymous CFHR5-associated variants (rs139017763, rs41299613 or rs35662416) and non-carriers (n = 1214). t-test, two sided. *****p < 0.00001. Dot plot (c) is represented as median value with 95% CI. See also Supplementary data 1 [Tabs_11–13]. Source data are provided as a Source Data file (c).
Fig. 5
Fig. 5. Recombinant CFHR5 enhances platelet activation in platelet rich plasma.
Platelet activation was measured by surface expression of (a) P-selectin, (b) activated GP IIb/IIIa (PAC1+) or (c) CD63, following treatment of platelet rich plasma with different concentrations of adenosine diphosphate (ADP), convulxin or TRAP6, [ac: top, middle and bottom panels, respectively] following pre-incubation with recombinant CFHR5, or PBS control. d Platelet aggregation was measured in response to ADP (2 μm) following pre-incubation with recombinant CFHR5, or PBS control: representative aggregation curve [left], maximum aggregation [middle] and slope [right], of four independent experiments. ADP-induced platelet activated GP IIb/IIIa (PAC1+) was measured following preincubation with: (e) DMSO (control) or compstatin, or (f) PBS (control) or an anti-C3a antibody, followed by treatment with PBS or rCFHR5. US: unstimulated (PBS control). Each experiment is represented by an individual point and paired experiments connected by a dotted line. Anova (ac) and t-test (df) were performed (two-tailed). *p < 0.05 **p < 0.01 ***p < 0.001 (p for trend bottom right). Source data are provided as a Source Data file (Fig. 5).

References

    1. Johansson M, Johansson L, Lind M. Incidence of venous thromboembolism in northern Sweden (VEINS): a population-based study. Thromb. J. 2014;12:6. doi: 10.1186/1477-9560-12-6. - DOI - PMC - PubMed
    1. Heit JA. Epidemiology of venous thromboembolism. Nat. Rev. Cardiol. 2015;12:464–474. doi: 10.1038/nrcardio.2015.83. - DOI - PMC - PubMed
    1. Sogaard KK, Schmidt M, Pedersen L, Horvath-Puho E, Sorensen HT. 30-year mortality after venous thromboembolism: a population-based cohort study. Circulation. 2014;130:829–836. doi: 10.1161/CIRCULATIONAHA.114.009107. - DOI - PubMed
    1. Martinez C, Cohen AT, Bamber L, Rietbrock S. Epidemiology of first and recurrent venous thromboembolism: A population-based cohort study in patients without active cancer. Thromb. Haemost. 2014;112:255–263. doi: 10.1160/TH13-09-0793. - DOI - PubMed
    1. Wells PS, et al. Evaluation of D-dimer in the diagnosis of suspected deep-vein thrombosis. N. Engl. J. Med. 2003;349:1227–1235. doi: 10.1056/NEJMoa023153. - DOI - PubMed

Publication types