

A case study of an individual participant data meta-analysis of diagnostic accuracy showed that prediction regions represented heterogeneity well
- PMID: 37286580
- PMCID: PMC10247712
- DOI: 10.1038/s41598-023-36129-w
A case study of an individual participant data meta-analysis of diagnostic accuracy showed that prediction regions represented heterogeneity well
Abstract
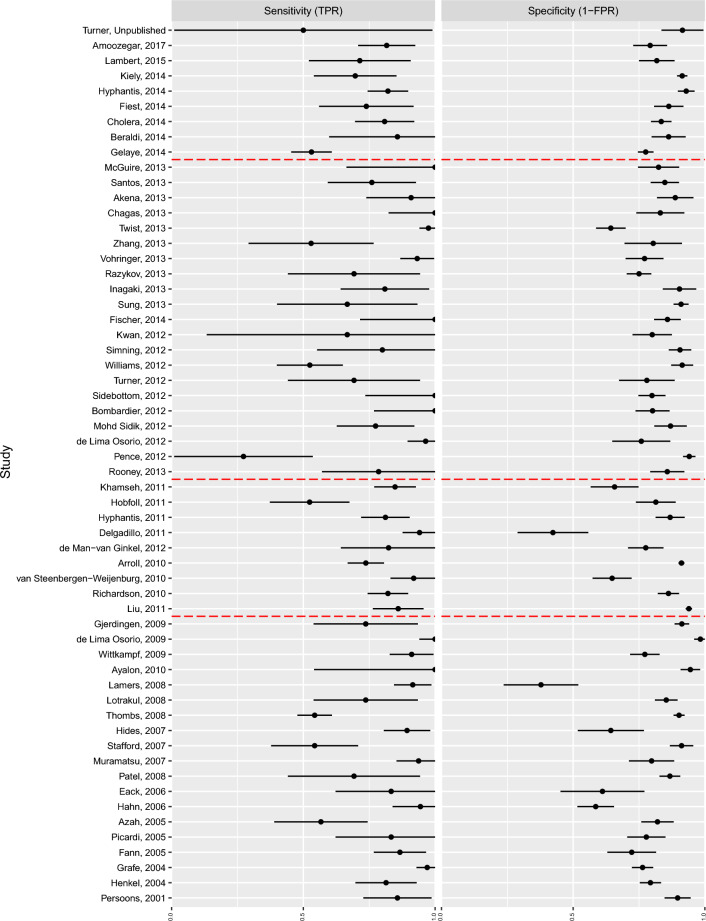
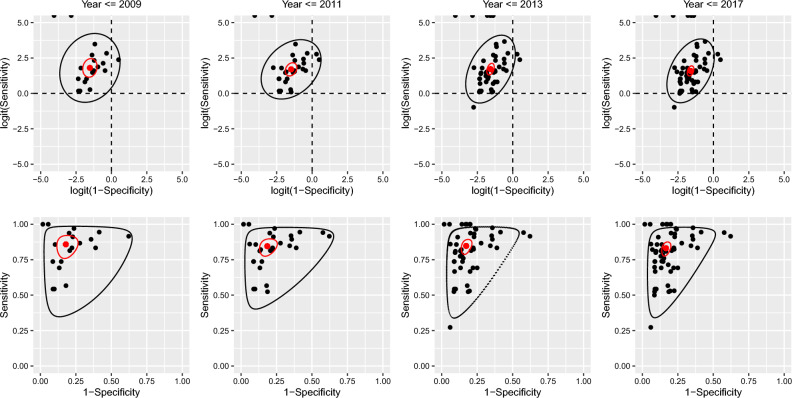
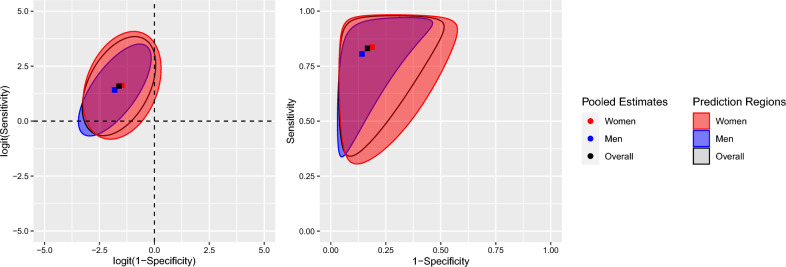
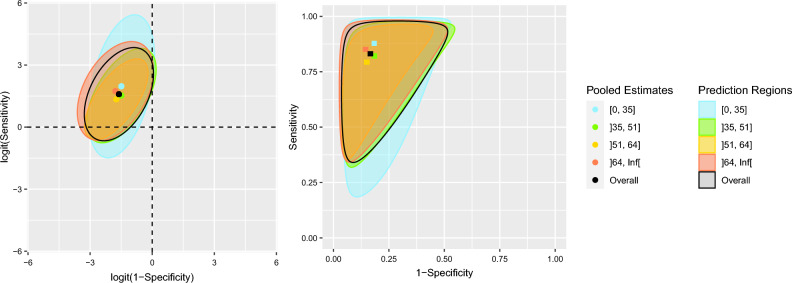
The diagnostic accuracy of a screening tool is often characterized by its sensitivity and specificity. An analysis of these measures must consider their intrinsic correlation. In the context of an individual participant data meta-analysis, heterogeneity is one of the main components of the analysis. When using a random-effects meta-analytic model, prediction regions provide deeper insight into the effect of heterogeneity on the variability of estimated accuracy measures across the entire studied population, not just the average. This study aimed to investigate heterogeneity via prediction regions in an individual participant data meta-analysis of the sensitivity and specificity of the Patient Health Questionnaire-9 for screening to detect major depression. From the total number of studies in the pool, four dates were selected containing roughly 25%, 50%, 75% and 100% of the total number of participants. A bivariate random-effects model was fitted to studies up to and including each of these dates to jointly estimate sensitivity and specificity. Two-dimensional prediction regions were plotted in ROC-space. Subgroup analyses were carried out on sex and age, regardless of the date of the study. The dataset comprised 17,436 participants from 58 primary studies of which 2322 (13.3%) presented cases of major depression. Point estimates of sensitivity and specificity did not differ importantly as more studies were added to the model. However, correlation of the measures increased. As expected, standard errors of the logit pooled TPR and FPR consistently decreased as more studies were used, while standard deviations of the random-effects did not decrease monotonically. Subgroup analysis by sex did not reveal important contributions for observed heterogeneity; however, the shape of the prediction regions differed. Subgroup analysis by age did not reveal meaningful contributions to the heterogeneity and the prediction regions were similar in shape. Prediction intervals and regions reveal previously unseen trends in a dataset. In the context of a meta-analysis of diagnostic test accuracy, prediction regions can display the range of accuracy measures in different populations and settings.
© 2023. The Author(s).
Conflict of interest statement
All authors have completed the ICJME uniform disclosure form at
Figures
References
Publication types
MeSH terms
Grants and funding
- R49 CE002093/CE/NCIPC CDC HHS/United States
- R24 MH071604/MH/NIMH NIH HHS/United States
- R01 HD039415/HD/NICHD NIH HHS/United States
- T37 MD001449/MD/NIMHD NIH HHS/United States
- R01 MH073687/MH/NIMH NIH HHS/United States
- P30 DK050456/DK/NIDDK NIH HHS/United States
- K02 MH065919/MH/NIMH NIH HHS/United States
- R34 MH072925/MH/NIMH NIH HHS/United States
- R01 MH069666/MH/NIMH NIH HHS/United States
- R34 MH084673/MH/NIMH NIH HHS/United States
- TL1 RR024135/RR/NCRR NIH HHS/United States
- R24 MH071604/MH/NIMH NIH HHS/United States
- R36 HS018246/HS/AHRQ HHS/United States
- T32 GM007356/GM/NIGMS NIH HHS/United States
- R01 CA078400/CA/NCI NIH HHS/United States
- R01 HL079235/HL/NHLBI NIH HHS/United States
LinkOut - more resources
Full Text Sources
Research Materials
