. 2023 Jun 7;13(1):9249.
doi: 10.1038/s41598-023-35302-5.

Imaging of atherosclerosis with [64Cu]Cu-DOTA-TATE in a translational head-to-head comparison study with [18F]FDG, and Na[18F]F in rabbits

Affiliations

Imaging of atherosclerosis with [64Cu]Cu-DOTA-TATE in a translational head-to-head comparison study with [18F]FDG, and Na[18F]F in rabbits

Constance E Grandjean et al. Sci Rep. .

Abstract

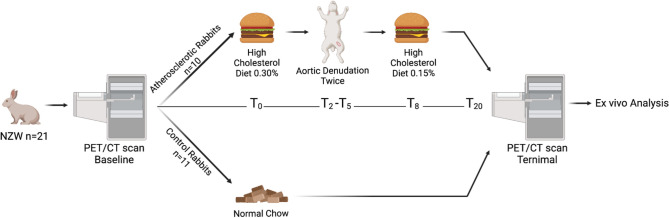
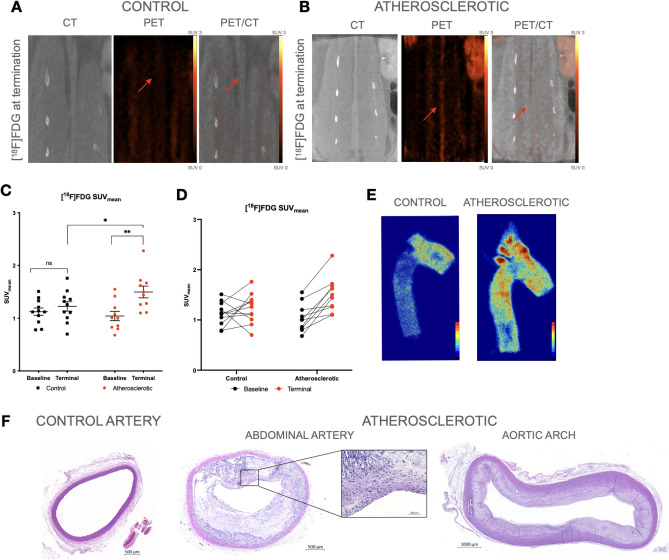
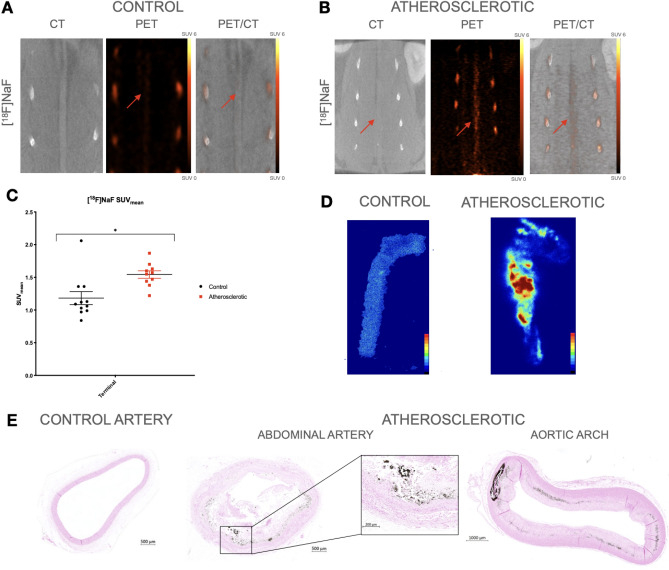
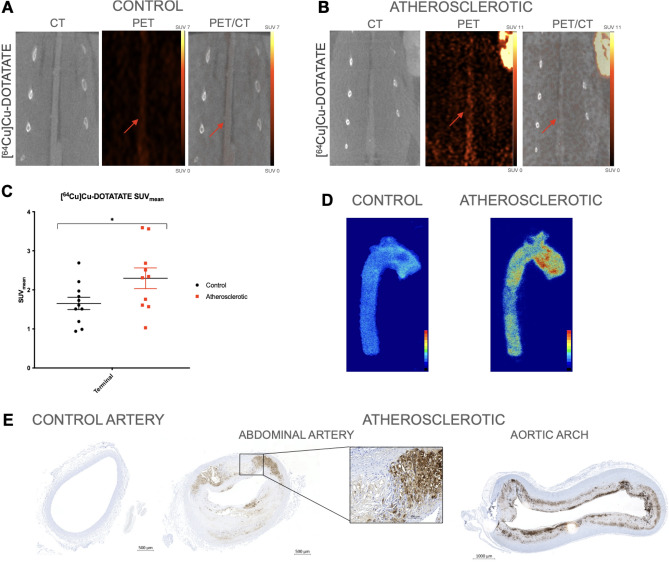
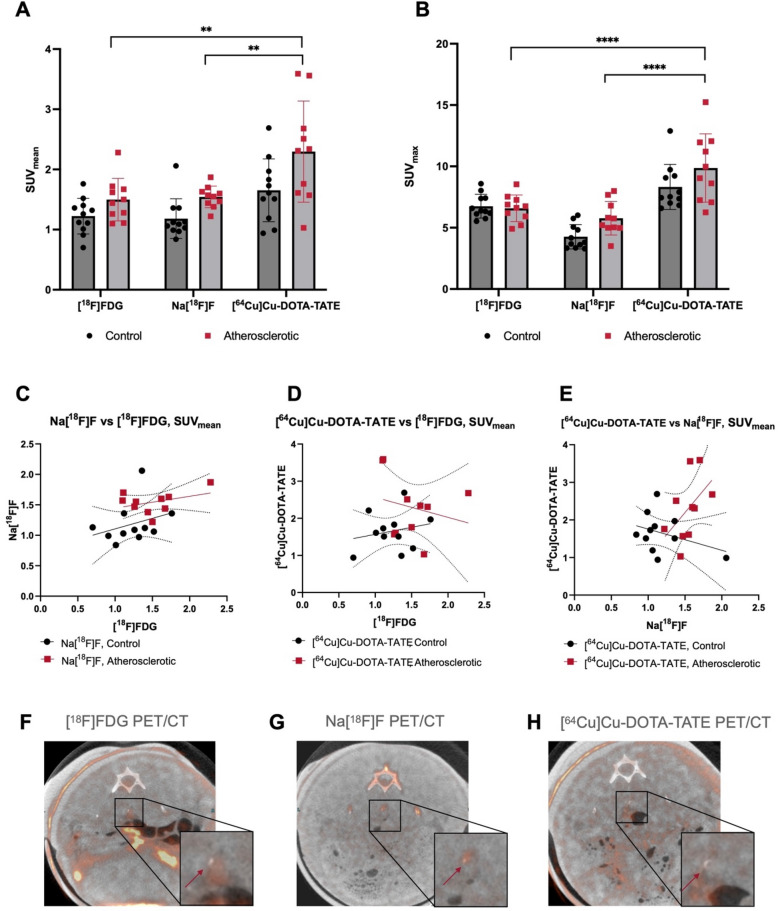
Atherosclerosis is a chronic inflammatory disease of the larger arteries that may lead to cardiovascular events. Identification of patients at highest risk of cardiovascular events is challenging, but molecular imaging using positron emission tomography (PET) may prove useful. The aim of this study was to evaluate and compare head-to-head three different PET tracers. Furthermore, tracer uptake is compared to gene expression alterations of the arterial vessel wall. Male New Zealand White rabbits (control group; n = 10, atherosclerotic group; n = 11) were used for the study. Vessel wall uptake was assessed with the three different PET tracers: [18F]FDG (inflammation), Na[18F]F (microcalcification), and [64Cu]Cu-DOTA-TATE (macrophages), using PET/computed tomography (CT). Tracer uptake was measured as standardized uptake value (SUV), and arteries from both groups were analyzed ex vivo by autoradiography, qPCR, histology, and immunohistochemistry. In rabbits, the atherosclerotic group showed significantly higher uptake of all three tracers compared to the control group [18F]FDG: SUVmean 1.50 ± 0.11 versus 1.23 ± 0.09, p = 0.025; Na[18F]F: SUVmean 1.54 ± 0.06 versus 1.18 ± 0.10, p = 0.006; and [64Cu]Cu-DOTA-TATE: SUVmean 2.30 ± 0.27 versus 1.65 ± 0.16; p = 0.047. Of the 102 genes analyzed, 52 were differentially expressed in the atherosclerotic group compared to the control group and several genes correlated with tracer uptake. In conclusion, we demonstrated the diagnostic value of [64Cu]Cu-DOTA-TATE and Na[18F]F for identifying atherosclerosis in rabbits. The two PET tracers provided information distinct from that obtained with [18F]FDG. None of the three tracers correlated significantly to each other, but [64Cu]Cu-DOTA-TATE and Na[18F]F uptake both correlated with markers of inflammation. [64Cu]Cu-DOTA-TATE was higher in atherosclerotic rabbits compared to [18F]FDG and Na[18F]F.


Conflict of interest statement

Andreas Kjaer is an inventor/holds IPR on 64Cu-DOTA-TATE for human use. The authors declare no competing interests.

Figures

Figure 1
Figure 1
General characteristics of the control group and the atherosclerotic group. Study outline with both dietary (High Cholesterol Diet containing 0.30% cholesterol and 0.15% cholesterol) and surgical interventions for the atherosclerotic group together with scan times for both groups. T0 = study initiation, two weeks after (T2) the first surgical intervention was performed and five weeks after initiation (T5) the second surgical intervention was performed. After eight weeks (T8) the diet was switched from 0.30% HCD to 0.15% HCD. The study continued for another 16 weeks and after 20 weeks (T20) the study was finalized by PET/CT scans of the rabbits followed by ex vivo analyses.
Figure 2
Figure 2
[18F]FDG in vivo PET/CT Imaging and ex vivo analysis. (A) CT, PET, and fused PET/CT images in the coronal plane, from a control rabbit with uptake of [18F]FDG. The control rabbits show a homogenous uptake of [18F]FDG (red arrow marking the artery on the PET and PET/CT images). (B) CT, PET, and fused PET/CT images in the coronal plane of [18F]FDG uptake in an atherosclerotic rabbit. The uptake is clearly visualized throughout the abdominal artery on both the PET and PET/CT images marked with the red arrows. Color bars are calibrated in SUV and with no background subtracted. Color bars are identical for the two groups. (C) Dot plots show in vivo SUVmean values ± SEM from baseline and terminal scans of [18F]FDG. The baseline scan shows no significant (ns) difference between the groups. The control group (n = 10) from baseline to terminal scan showed no significant difference, while for the atherosclerotic group (n = 11) there was a significant difference in [18F]FDG uptake (**), p = 0.0029. The terminal scans reveal a significant (*) difference in [18F]FDG uptake between the atherosclerotic group and the control group (SUVmean 1.50 ± 0.112 vs SUVmean 1.23 ± 0.089, p = 0.025). (D) Spaghetti plots showing the change in [18F]FDG uptake from baseline to end of study for each rabbit of both groups. (E) Autoradiographic images show the binding of [18F]FDG in the aortic arch and descending thoracic artery from a control and an atherosclerotic artery. (F) Cross section H&E stains of the abdominal artery and aortic arch. The atherosclerotic artery show wall thickening and plaque formation causing a narrowed lumen of the artery compared to the lumen of the normal artery. The aortic arch show similar morphological changes as the abdominal artery with present atherosclerosis.
Figure 3
Figure 3
[18F]NaF in vivo PET/CT imaging and ex vivo analysis. (A) CT, PET, and fused PET/CT images in the coronal plane, from a control rabbit. The control rabbits show a homogenous uptake of [18F]NaF marked with red arrows on the PET and PET/CT. (B) An atherosclerotic rabbit CT, PET, and fused PET/CT images showed higher uptake of [18F]NaF. [18F]NaF showed specific higher uptake in calcified lesions of the abdominal artery, which can be seen on the CT, PET and PET/CT marked with a red arrow on each image. Color bars are calibrated in SUV with no background subtracted. Same scale bar used on both images. (C) SUVmean values ± SEM of terminal [18F]NaF scans of the control group and atherosclerotic group presented by dot plots. The atherosclerotic group had a significantly higher uptake compared to the control group (SUVmean 1.54 ± 0.057 vs SUVmean 1.18 ± 0.099, p = 0.006). (D) Phosphor autoradiographic images show the binding of [18F]NaF in the aortic arch and descending thoracic artery from a control and an atherosclerotic artery. (E) Cross section of the abdominal artery stained with Von Kossa. No calcium deposits were evident, since none of the control arteries stained positive for Von Kossa. The Von Kossa stain of the atherosclerotic abdominal artery and the aortic arch show calcium deposits (black).
Figure 4
Figure 4
[64Cu]Cu-DOTA-TATE PET/CT imaging and ex vivo analysis. (A) CT, PET, and fused PET/CT images in the coronal plane, from a control rabbit with uptake of [64Cu]Cu-DOTA-TATE. The artery is marked with a red arrow. (B) CT, PET, and fused PET/CT images of an atherosclerotic rabbit with uptake of [64Cu]Cu-DOTA-TATE showed a high and homogenous uptake in the artery marked with the red arrow in both images. Color bars were calibrated in SUV with no background subtracted. Same scale bar used for both images. (C) Dot plots showed in vivo SUVmean values ± SEM of the terminal scan of [64Cu]Cu-DOTA-TATE. The dot plot showed a significant (*) difference in [64Cu]Cu-DOTA-TATE uptake between the atherosclerotic group and the control group (SUVmean 2.30 ± 0.266 vs SUVmean 1.65 ± 0.157, p = 0.047). (D) Autoradiographic images show the binding of [64Cu]Cu-DOTA-TATE in the aortic arch and descending aorta from a control and an atherosclerotic artery. The binding of [64Cu]Cu-DOTA-TATE was higher in the atherosclerotic artery than in the control artery. (E) Cross section of the abdominal artery. The arteries were embedded in paraffin and IHC with was performed. The anti-rabbit macrophage (RAM11) staining shows macrophages surrounding the cholesterol crystals in the plaque in both the abdominal part and the aortic arch of the atherosclerotic artery.
Figure 5
Figure 5
Head-to-head comparison of the three PET tracers together with corresponding PET/CT images. Grouped comparison of the three tracers with significantly higher uptake of [64Cu]Cu-DOTA-TATE compared to Na[18F] and [64Cu]Cu-DOTA-TATE compared to [18F]FDG for (A) SUVmean and (B) SUVmax. Correlation plots between (C) [18F]FDG and Na[18F]F, (D) [18F]FDG and [64Cu]Cu-DOTA-TATE and (E) between Na[18F]F and [64Cu]Cu-DOTA-TATE. (F) [18F]FDG PET/CT of atherosclerotic artery (red arrow). (G) Na[18F]F PET/CT in the same lesion (red arrow) and (H) [64Cu]Cu-DOTA-TATE uptake in the same area (red arrow).
Figure 6
Figure 6
Gene Expression of the control group and the atherosclerotic group. Clustergram showing gene expression in the control group and the atherosclerotic group. Each group shows a specific cluster of highly expressed genes compared to the other group.

References

    1. Lusis AJ. Atherosclerosis. Nature. 2000;407(6801):233–241. doi: 10.1038/35025203. - DOI - PMC - PubMed
    1. Calcagno C, et al. Systems biology and noninvasive imaging of atherosclerosis. Arterioscler. Thromb. Vasc. Biol. 2016;36(2):e1–8. doi: 10.1161/ATVBAHA.115.306350. - DOI - PMC - PubMed
    1. Perez-Medina C, et al. In vivo PET imaging of HDL in multiple atherosclerosis models. JACC Cardiovasc. Imaging. 2016;9(8):950–961. doi: 10.1016/j.jcmg.2016.01.020. - DOI - PMC - PubMed
    1. Meester EJ, et al. Perspectives on small animal radionuclide imaging; considerations and advances in atherosclerosis. Front. Med. (Lausanne) 2019;6:39. doi: 10.3389/fmed.2019.00039. - DOI - PMC - PubMed
    1. Sriranjan RS, et al. Atherosclerosis imaging using PET: Insights and applications. Br. J. Pharmacol. 2019;178:2186–2203. doi: 10.1111/bph.14868. - DOI - PubMed

Publication types

Substances