. 2023 Jun;618(7966):834-841.
doi: 10.1038/s41586-023-06156-8. Epub 2023 Jun 7.

Ultraviolet radiation shapes dendritic cell leukaemia transformation in the skin

Affiliations

Ultraviolet radiation shapes dendritic cell leukaemia transformation in the skin

Gabriel K Griffin et al. Nature. 2023 Jun.

Abstract

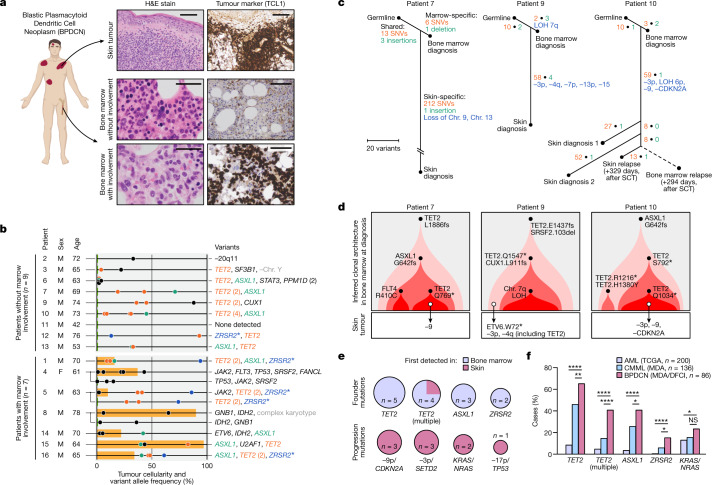
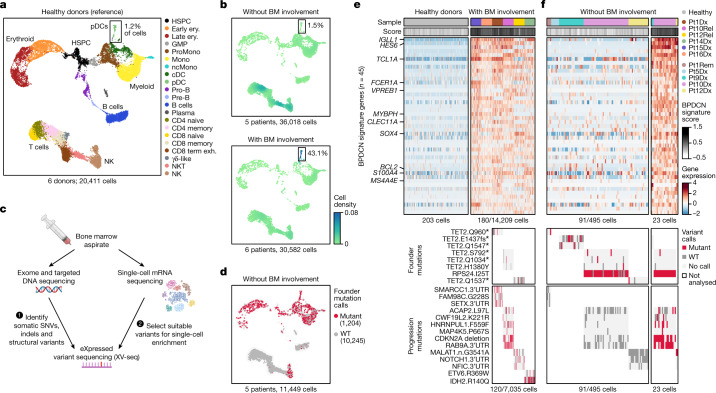
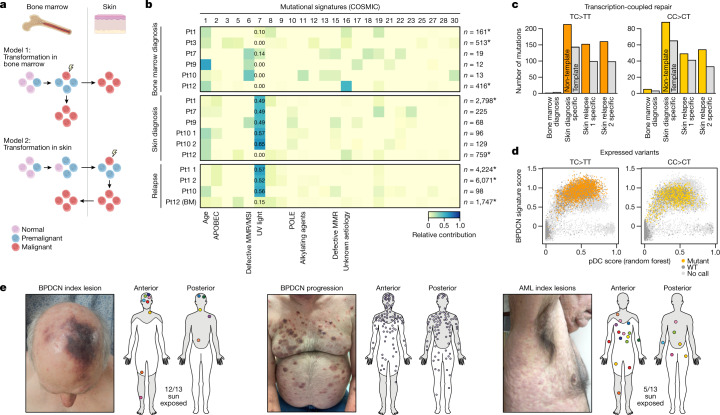
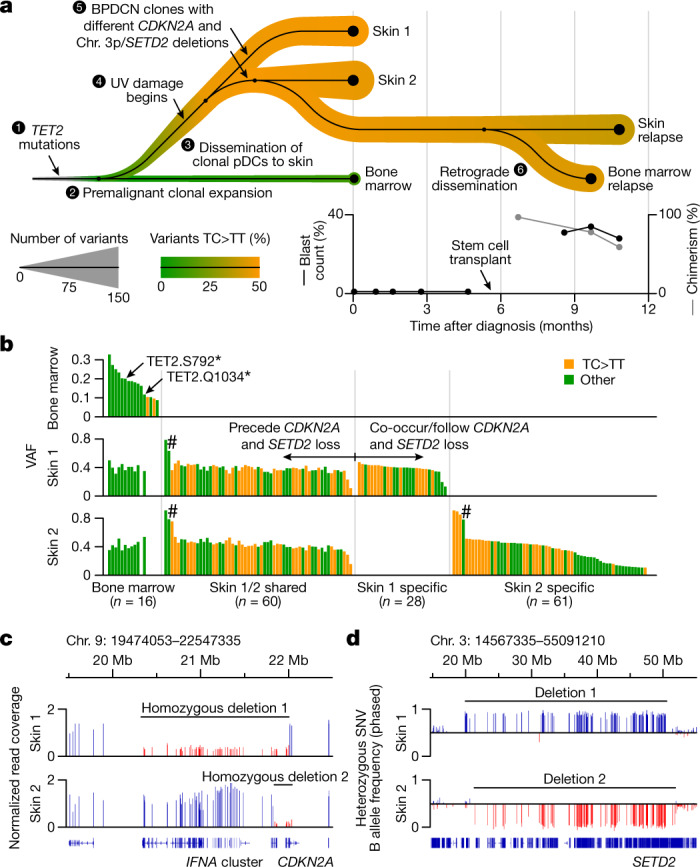
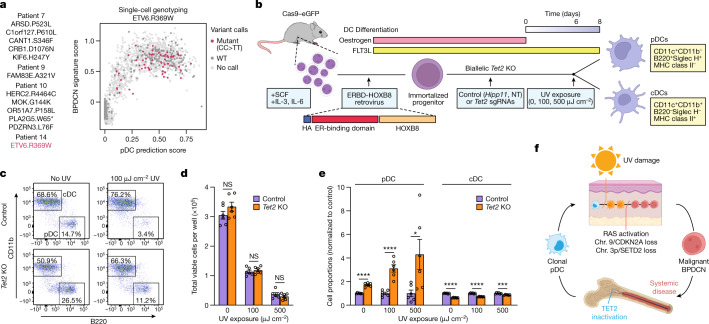
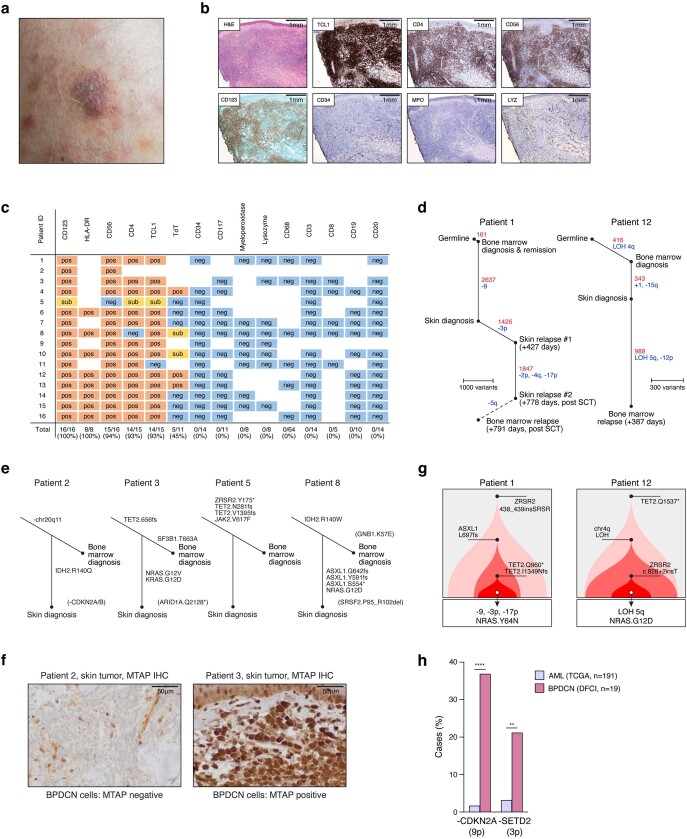
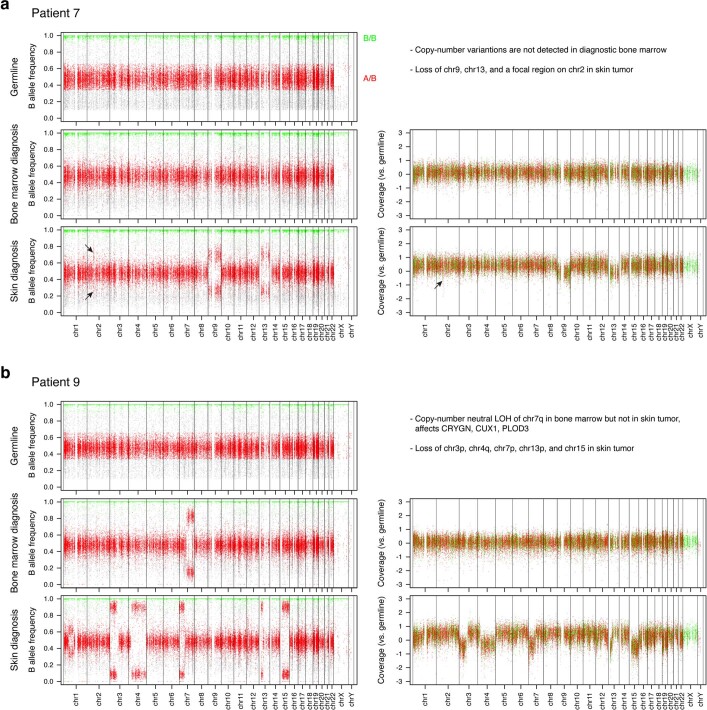
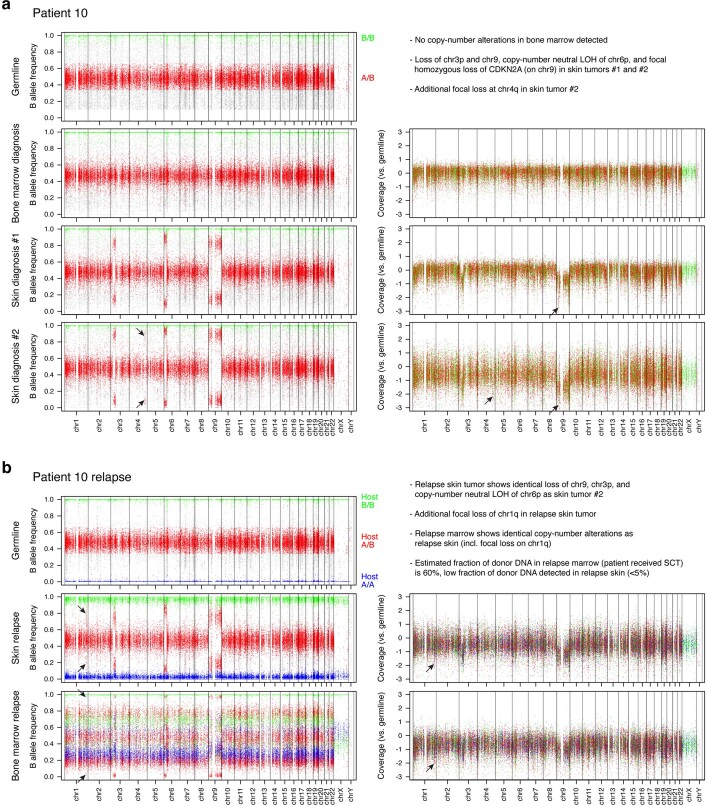
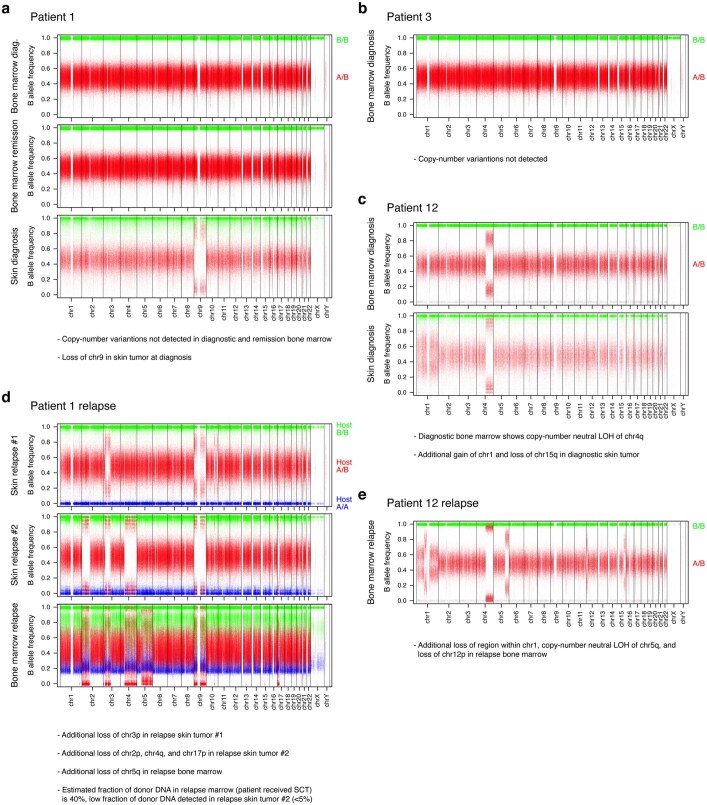
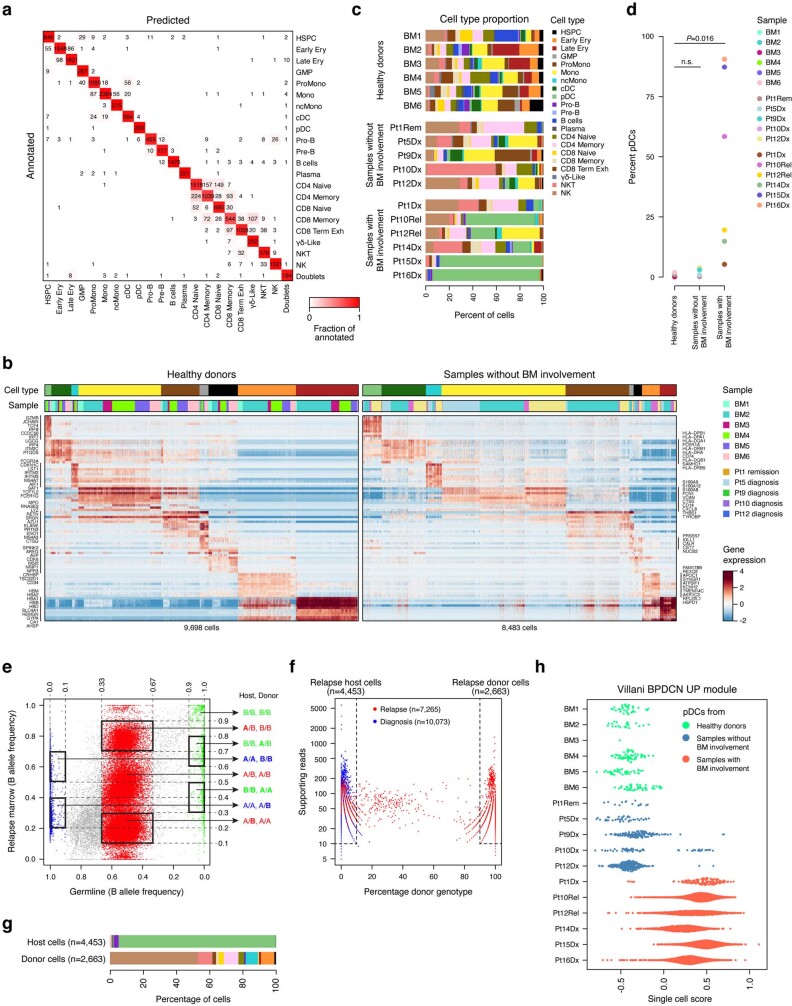
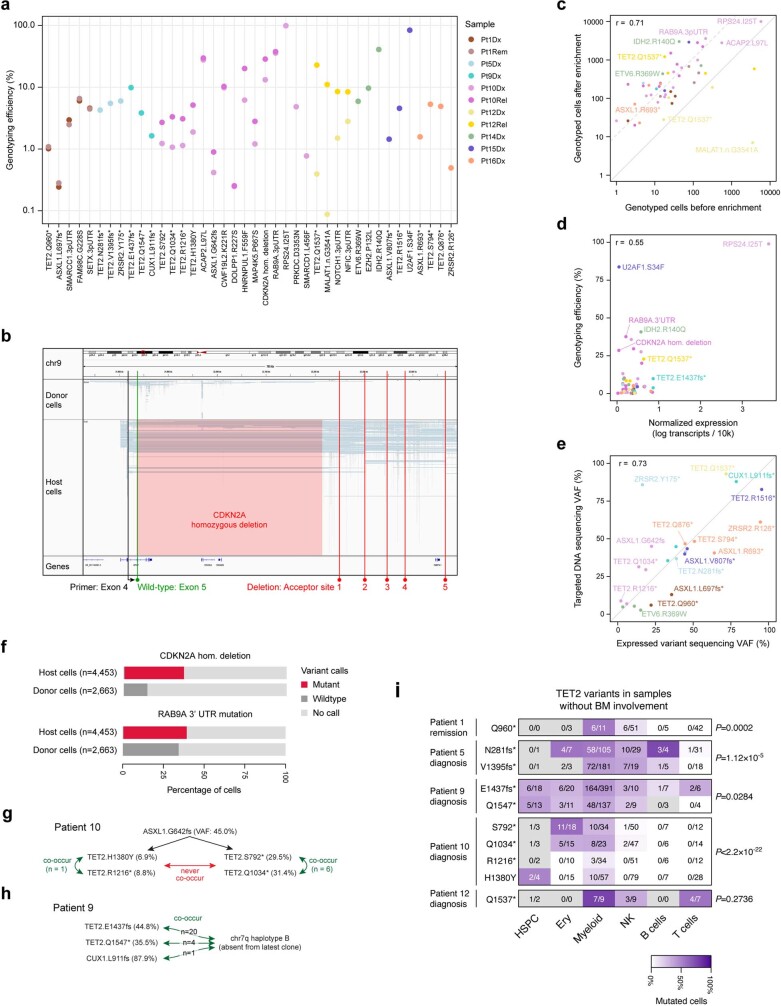
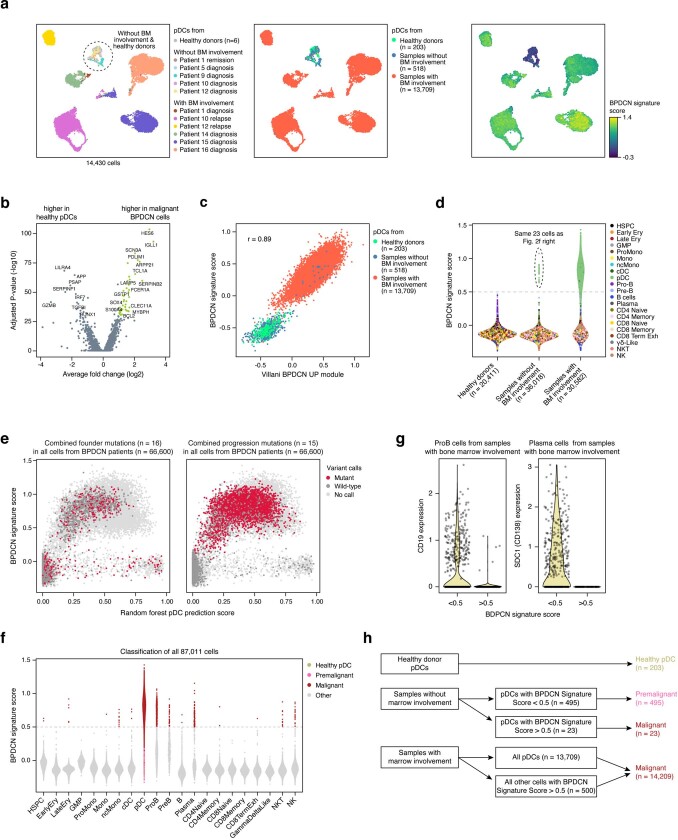
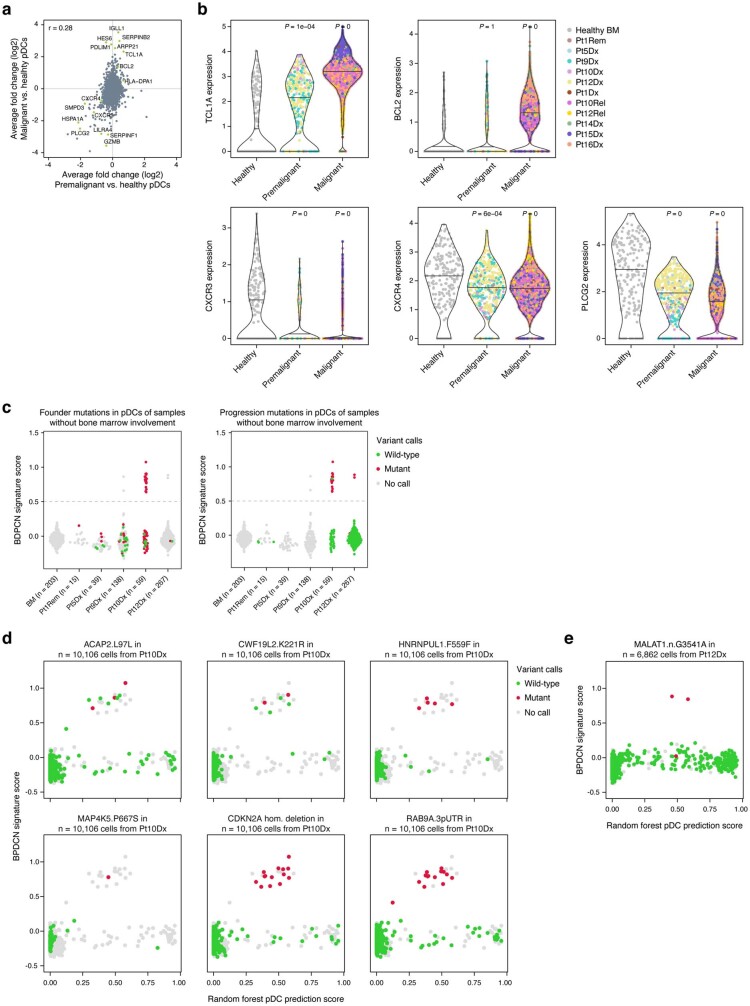
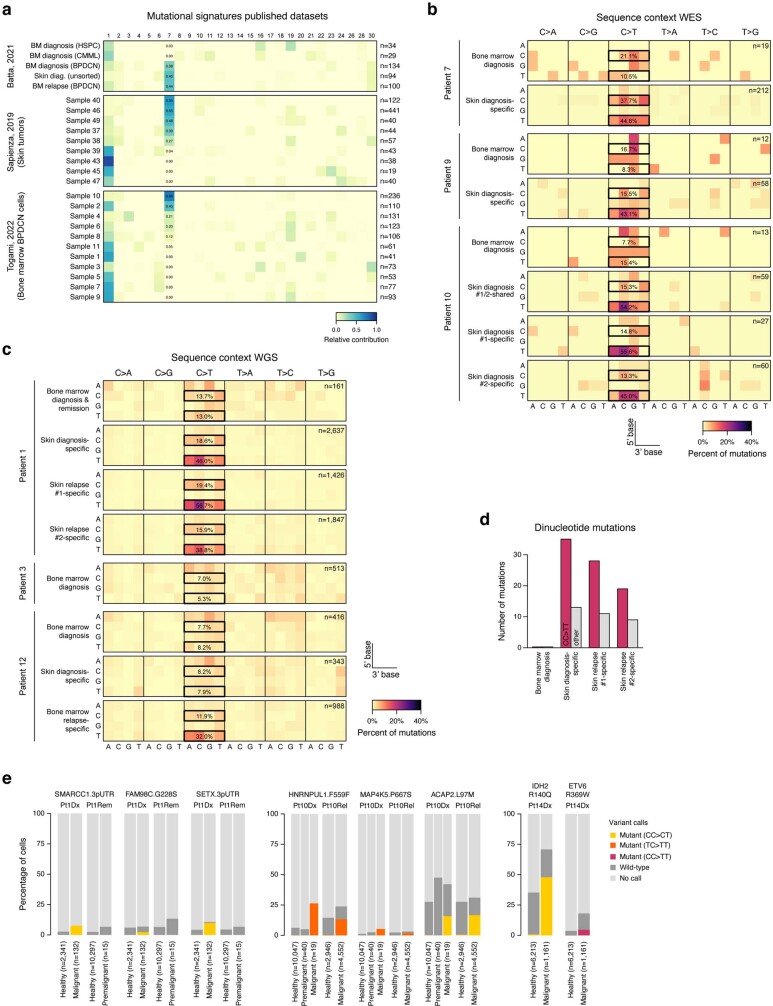
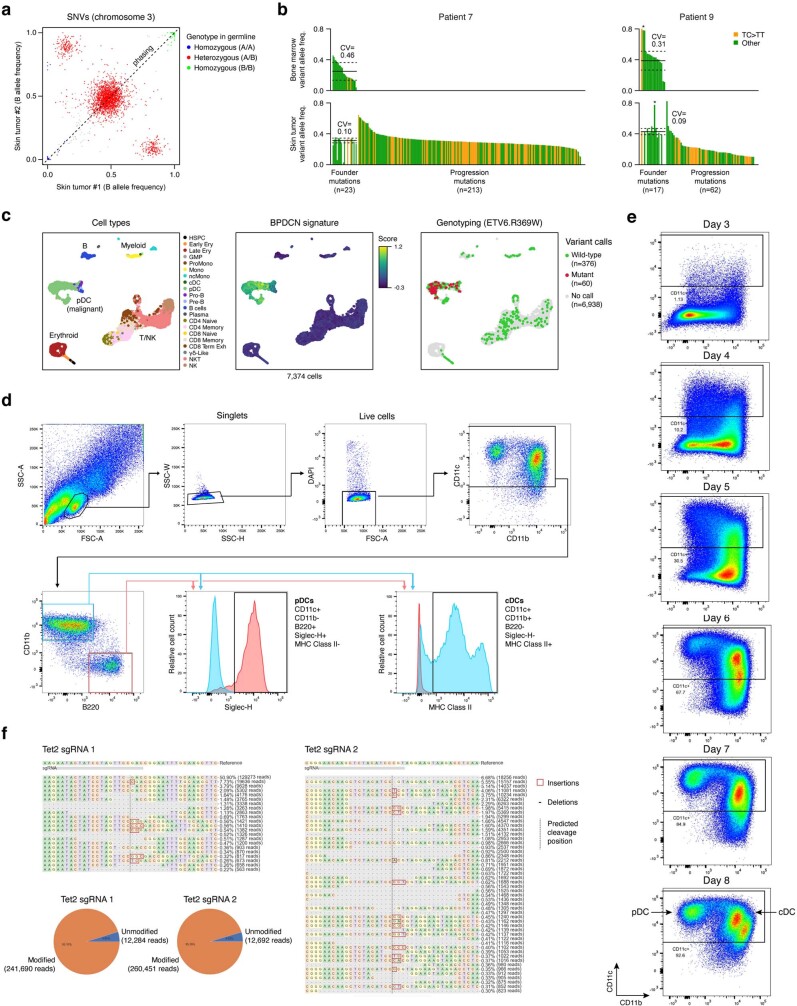
Tumours most often arise from progression of precursor clones within a single anatomical niche. In the bone marrow, clonal progenitors can undergo malignant transformation to acute leukaemia, or differentiate into immune cells that contribute to disease pathology in peripheral tissues1-4. Outside the marrow, these clones are potentially exposed to a variety of tissue-specific mutational processes, although the consequences of this are unclear. Here we investigate the development of blastic plasmacytoid dendritic cell neoplasm (BPDCN)-an unusual form of acute leukaemia that often presents with malignant cells isolated to the skin5. Using tumour phylogenomics and single-cell transcriptomics with genotyping, we find that BPDCN arises from clonal (premalignant) haematopoietic precursors in the bone marrow. We observe that BPDCN skin tumours first develop at sun-exposed anatomical sites and are distinguished by clonally expanded mutations induced by ultraviolet (UV) radiation. A reconstruction of tumour phylogenies reveals that UV damage can precede the acquisition of alterations associated with malignant transformation, implicating sun exposure of plasmacytoid dendritic cells or committed precursors during BPDCN pathogenesis. Functionally, we find that loss-of-function mutations in Tet2, the most common premalignant alteration in BPDCN, confer resistance to UV-induced cell death in plasmacytoid, but not conventional, dendritic cells, suggesting a context-dependent tumour-suppressive role for TET2. These findings demonstrate how tissue-specific environmental exposures at distant anatomical sites can shape the evolution of premalignant clones to disseminated cancer.


Conflict of interest statement

B.E.B. discloses financial interests in Fulcrum Therapeutics, Chroma Medicine, HiFiBio, Arsenal Biosciences, Cell Signaling Technologies and Design Pharmaceuticals. A.A.L. received research funding from Abbvie and Stemline therapeutics, and consulting fees from Cimeio Therapeutics, IDRx, Jnana Therapeutics, N-of-One and Qiagen. P.v.G. received consulting fees from ManaT Bio and Immunitas.

Figures

Fig. 1
Fig. 1. Phylogenomics of BPDCN across tissues.
a, Skin tumour (top) from a representative patient with BPDCN showing infiltration by malignant cells (haematoxylin and eosin (H&E), left) expressing the pDC marker TCL1 (immunohistochemistry, right). Marrow can show normal haematopoiesis (middle) or involvement by malignant cells (bottom). Scale bars, 200 μm (top), 100 μm (middle right and bottom right), 50 μm (middle left and bottom left). b, Mutated genes identified by targeted sequencing of marrow samples from 16 patients with BPDCN, including nine without marrow involvement (top; limit of detection, 5%) and seven with involvement (bottom; the orange bars indicate tumour cellularity). Gene labels are ordered from left to right from low to high VAF (x axis). The parentheses indicate multiple mutations in one gene. Recurrent gene mutations (≥3 patients) are indicated in colour. The asterisks indicate genes on chromosome (Chr.) X. c, Tumour phylogenies for patients 7, 9 and 10. Single-nucleotide variants (SNVs) (red), insertions/deletions (green) and copy-number alterations (blue, minus symbol represents chromosome or arm losses) are indicated (Methods). The dashed line indicates a post-transplant sample for which new alterations could not be detected owing to donor SNVs. SCT, stem cell transplant. d, Inferred clonal architecture in marrow samples for patients in c. Subclones directly related to BPDCN skin tumours are indicated by arrows, and are further annotated with skin-specific progression mutations. e, The frequency of mutations first detected in marrow (founder mutations, top) or skin tumours (progression mutations, bottom) for patients in c and Extended Data Fig. 1d,e. n values indicate the number of gene mutations across the five patients. f, The frequency of mutations in founder and progression genes in BPDCN, CMML and AML. Statistical significance was determined using two-sided Fisher’s exact tests. DFCI, Dana-Farber Cancer Institute; MDA, MD Anderson Cancer Center; TCGA, The Cancer Genome Atlas. *P < 0.05, **P < 0.01, ****P < 0.0001; NS, not significant. The diagram in a was created using BioRender. Source Data
Fig. 2
Fig. 2. Single-cell profiling resolves premalignant pDCs and BPDCN.
a, Uniform manifold approximation and projection (UMAP) representation of the scRNA-seq analysis of marrow (n = 20,411 cells) from six healthy donors. Clusters show expected cell types, including progenitor, myeloid, erythroid and lymphocyte-lineage cells and pDCs (box). HSPC, hematopoietic stem and progenitor cell; ery, erythroid; GMP, granulocyte macrophage progenitor; ProMono, promonocyte; Mono, monocyte; ncMono, non-classical monocyte; cDC, conventional dendritic cell; pDC, plasmacytoid dendritic cell; Pro-B, pro-B cell; Pre-B, pre-B cell; CD8 term exh, CD8 terminally exhausted; NKT, natural killer T cell; NK, natural killer cell. b, UMAP representation of the density of cells from marrow samples of patients with BPDCN (n = 11) projected by transcriptional similarity to the cell types defined in a and coloured by two-dimensional kernel density estimation. The samples include those without known involvement by BPDCN cells (top; n = 5 patients, n = 36,018 cells) and those with involvement (bottom; n = 6 patients, n = 30,582 cells). BM, bone marrow. c, The XV-seq procedure. Mutations identified by DNA sequencing were selected for enrichment on the basis of their detection in matched scRNA-seq data. d, UMAP representation of the XV-seq results for enrichment of 16 founder mutations from 5 patients with BPDCN without known marrow involvement. Cells are projected onto the clusters defined in a and coloured according to whether mutant (red; n = 1,204 cells) or wild-type (grey; n = 10,245 cells) transcripts were detected. Cells without mutant or wild-type calls are not shown. e, The expression of BPDCN signature genes (rows; n = 45) in cells classified as pDCs from six healthy donors (left; n = 203 cells) and six marrow samples from patients with BPDCN involvement (right, n = 14,209) (top). Malignant cells are downsampled to 30 cells per sample with genotyping information. The annotation bars (top) indicate the sample identifiers and BPDCN signature scores. Bottom, founder and progression mutations detected by XV-seq. f, Expression of BPDCN signature genes (top) and XV-seq mutations (bottom) in cells classified as pDCs from patients without known marrow involvement, as in e. Premalignant pDCs (left; n = 91 cells with genotyping information) show low signature scores and founder mutations exclusively. Occult BPDCN cells (right; n = 23) show high signature scores and a mix of founder and progression mutations. Pt, patient; Dx, diagnosis; Rem, remission; Rel, relapse; WT, wild-type. The diagram in c was created using BioRender.
Fig. 3
Fig. 3. UV damage localizes malignant progression of BPDCN to the skin.
a, Two models of clonal progression to malignancy in BPDCN. In model 1 (top), clonal precursors (blue) transform to malignant cells (red) in the bone marrow, and then spread to the skin. In model 2 (bottom), clonal precursors from the marrow (blue) seed the skin, transform to malignant cells (red) and then spread in a retrograde manner back to bone marrow. b, Mutational signature analysis of uninvolved patient marrows (top), BPDCN skin tumours at diagnosis (middle) and relapse samples (bottom; all skin tumours except for patient 12 (Pt12), which is marrow). Blue heat indicates the relative contribution of each signature. The total SNVs per sample is indicated on the right. n values marked by asterisks indicate samples profiled by WGS; all others represent WES. c, UV-associated TC>TT and CC>CT mutations in samples from patient 1, separated according to their presence on the template (transcribed, indicated in grey) or non-template (non-transcribed, indicated in colour) strands of annotated genes. d, Single cells (n = 66,600) from all marrow samples, showing the random-forest pDC prediction score (x axis) and the BPDCN signature score (y axis). The colours indicate cells with UV-associated progression mutations (TC>TT, orange; CC>CT, yellow) detected by XV-seq. e, The anatomical distribution of BPDCN skin tumours at the time of diagnosis (left) and disease progression (middle). Skin lesions in patients with AML at diagnosis (right). Grey shading indicates areas of chronic or intermittent UV exposure. Representative clinical photos are shown. The diagram in a was created using BioRender.
Fig. 4
Fig. 4. UV damage begins before malignant transformation.
a, Subway plot showing clonal dynamics, clinical features and the disease course of patient 10. Samples profiled by WES (n = 5) are indicated by black dots and connected according to phylogenomic relationships. The line width indicates the total number of detected mutations in each sample, and the colour indicates the percentage of UV-associated TC>TT mutations from green (0%) to orange (50%). The plots at the bottom show the bone marrow blast count (left y axis, black lines) from pathology assessment, and donor chimerism (right y axis, grey line) after allogeneic stem-cell transplant. b, VAFs (y axis) of somatic mutations (x axis) detected in uninvolved bone marrow (top) and two BPDCN skin tumours from distinct anatomical sites (middle and bottom) in patient 10 at diagnosis, as in a. Mutations are grouped according to the sample in which they were first detected (left, bone marrow; middle left, shared skin 1 and 2; middle right, unique to skin 1; right, unique to skin 2). UV-associated TC>TT mutations are indicated in orange, and other mutations are indicated in green. The hashes indicate mutations of which VAFs are affected by copy-number alterations or location on chromosome X. c, Normalized read coverage on chromosome 9 for the two BPDCN skin tumours presented in a and b. Separate homozygous deletions affecting the CDKN2A tumour suppressor gene are indicated, with vertical bars showing the read coverage in the deleted (red bars) and non-deleted (blue bars) regions. d, Phased B allele frequencies (y axis) of heterozygous SNVs on chromosome 3 for the two BPDCN skin tumours presented in ac. The vertical bars indicate the allele frequencies in a region containing the SETD2 tumour suppressor gene. Blue bars, A allele lost; red bars, B allele lost.
Fig. 5
Fig. 5. Tet2 loss protects pDCs from UV-induced cell death.
a, All detected UV-specific (CC > TT) gene mutations, including ETV6.R369W (red) in patient 14 (left). Right, XV-seq analysis of the bone marrow from patient 14 (n = 7,374 cells) showing the random-forest pDC prediction (x axis) and BPDCN signature (y axis) scores. The colours indicate cells with ETV6.R369W mutant calls (red), wild-type transcripts only (dark grey) and no variant calls (light grey). b, Ex vivo differentiation of dendritic cells from mouse bone marrow. Transduction of oestrogen-responsive HOXB8 generates progenitors capable of stable propagation and gene editing in vitro. Oestrogen withdrawal triggers differentiation over 6–8 days into pDCs and cDCs. UV exposure was performed on day 6, and cells were further differentiated until day 8. ER, estrogen receptor. c, Representative flow cytometry analysis of cDC (CD11b+B220) and pDC (CD11bB220+) populations in the control, Tet2-knockout and UV-exposed conditions. Gating was performed on viable CD11c+ cells, as in Extended Data Fig. 10d. d, Viable cells (y axis) in control and Tet2-knockout cells on day 8 after UV exposure on day 6. e, The proportion of viable cells (y axis) classified as pDCs or cDCs in control (purple) or Tet2-knockout (orange) conditions at the indicated UV doses. Data are normalized to the 0 UV condition. f, Proposed model for BPDCN development in UV-associated cases. Clonal (premalignant) pDCs/pDC-like precursors arise in the marrow and seed the skin. These cells are then exposed to UV, undergo clonal selection and acquire additional mutations during malignant transformation. Malignant cells then spread systemically, including through retrograde dissemination back to the bone marrow. For d and e, data are mean ± s.e.m., and include two control and two Tet2 gRNAs performed in triplicate, representative of two independent experiments. Statistical analysis in d and e was performed using two-sided Student’s t-tests; ***P < 0.001. The diagrams in b and f were created using BioRender. Source Data
Extended Data Fig. 1
Extended Data Fig. 1. Clinical evaluation of bone marrow involvement in BPDCN.
a, Clinical photo of a representative BPDCN skin lesion at initial diagnosis showing a violaceous nodule that occurred on a background of diffuse pink, brown and violaceous papules, plaques, and tumours. b, Low-power histologic images of a representative BPDCN skin tumour showing extensive dermal infiltration by malignant BPDCN cells with characteristic immunophenotype, including positivity for TCL1, CD4, CD56, and CD123, and negativity for CD34, myeloperoxidase (MPO), and lysozyme (LYZ). These features distinguish BPDCN in the skin from histologic mimics, including acute myeloid leukaemia with monocytic differentiation and chronic myelomonocytic leukaemia. c, Immunophenotypic features of the sixteen BPDCN cases included in the cohort, as determined by immunohistochemistry and/or flow cytometry performed during initial pathology evaluation. This shows the presence of BPDCN markers (TCL1, CD4, CD56, CD123) and the absence of myeloid, T, or B-cell lineage markers that define other forms of acute leukaemia. d, Tumour phylogenies and sample-specific alterations for Patients 1 and 12 as determined by whole-genome sequencing. Somatic SNVs (red) and copy-number alterations (blue) were defined at the latest relapse time point, and then assessed in prior skin tumour and bone marrow diagnosis samples. e, Tumour phylogenies and sample-specific alterations for Patients 2, 3, 5, and 8 as determined by targeted sequencing (RHP and Oncopanel, see Methods). Mutations that are not covered in both the RHP (bone marrow samples) and Oncopanel (skin samples) assays are indicated in parentheses. f, Immunohistochemistry for MTAP protein (brown) as a marker of chr 9p21.3 loss in BPDCN skin tumours. MTAP is lost in skin tumour cells from patient 2, which contain a focal deletion on chr9p21.3, and retained in skin tumour cells from patient 3, which do not have chr9p21.3 loss. g, Inferred clonal architecture in diagnostic marrows for Patients 1 and 12 in (d). Premalignant subclones related to BPCN skin tumours are indicated with arrows, and further annotated with skin-specific progression mutations. h, Frequency of copy-loss in CDKN2A/chr9p and SETD2/chr3p in BPDCN and AML. Statistical significance by two-sided Fisher’s exact test. TCGA, The Cancer Genome Atlas. DFCI, Dana-Farber Cancer Institute. ** P < 0.01, **** P < 0.0001. Related to Fig. 1.
Extended Data Fig. 2
Extended Data Fig. 2. Copy-number alteration analysis of Patient 7 and 9 whole-exome sequencing data.
a, Genome plots show B (minor) allele frequencies (left) and read coverage (right) for single-nucleotide variants (SNVs) detected in the Patient 7 germline sample using whole-exome sequencing. Heterozygous SNVs (A/B) are indicated in red, homozygous SNVs (B/B) are indicated in green. The same SNVs are shown for the bone marrow and skin tumour samples, indicating copy-number alterations specific to the skin tumour. A focal loss detected on chr2q is indicated by arrows. b, Genome plots show similar analysis for germline, bone marrow, and skin tumour samples of Patient 9. A sub-clonal copy-number neutral loss of heterozygosity (LOH) on chr7q was detected in the uninvolved bone marrow sample, which was not detected in the skin tumour. Related to Fig. 1.
Extended Data Fig. 3
Extended Data Fig. 3. Copy-number alteration analysis of Patient 10 whole-exome sequencing data.
a, Genome plots show B (minor) allele frequencies (left) and read coverage (right) for single-nucleotide variants (SNVs) detected in the Patient 10 germline sample using whole-exome sequencing. Heterozygous SNVs (A/B) are indicated in red, homozygous SNVs (B/B) are indicated in green. The same SNVs are shown for bone marrow and skin tumour sample #1 and #2, indicating copy-number alterations specific to the skin tumours. A homozygous deletion of the CDKN2A gene locus is indicated by arrows. An additional focal loss on chr4q in skin tumour #2 is also indicated. b, Genome plots show SNVs detected in the relapse skin tumour and bone marrow samples of Patient 10 collected after receiving an allogeneic stem cell transplant. SNVs homozygous in the host germline sample are indicated in blue (A/A) and green (B/B). Heterozygous SNVs are indicated in red (A/B). A low level of donor DNA is detected in the relapse skin tumour sample (<5%). The estimated percentage of donor DNA is 60% in the relapse bone marrow sample. Copy-number alterations specific to the skin tumours (i.e. loss of chr9, chr3p, and copy-number neutral LOH of chr6p) are detected in both relapse samples. The only additional alteration is a focal loss on chr1q. Related to Fig. 1.
Extended Data Fig. 4
Extended Data Fig. 4. Copy-number alteration analysis of Patient 1, 3, and 12 whole-genome sequencing data.
a, Genome plots show B (minor) allele frequencies for all single-nucleotide variants (SNVs) detected in the Patient 1 germline sample using whole-genome sequencing. SNVs are shown for bone marrow samples at diagnosis and remission, and a skin tumour sample. SNVs that are heterozygous (A/B) in the germline sample are indicated in red, homozygous SNVs (B/B) are indicated in green. Loss of chr9 specific to the skin tumour sample is indicated. b, Genome plot shows similar analysis for a bone marrow sample of Patient 3, not harbouring any copy-number alterations. c, Genome plots show similar analysis for a bone marrow and skin tumour sample of Patient 12. Copy-number neutral loss of heterozygosity (LOH) on chr4q was detected in both samples. Additional loss of chr15q and gain of chr1 was detected in the skin tumour sample. d, Genome plots show single-nucleotide variants (SNVs) detected in the relapse bone marrow sample of Patient 1 collected after receiving an allogeneic stem cell transplant. SNVs are shown for skin relapse sample #1 and #2, as well as a bone marrow relapse. Samples were collected at consecutive time points. SNVs homozygous in the host germline sample are indicated in blue (A/A) and green (B/B), heterozygous SNVs are indicated in red (A/B). In addition to the loss of chr9 in the skin sample at diagnosis, additional copy-number alterations are detected in each sample: Loss of chr3p is first detected in skin relapse #1, loss of chr2p, chr4q, and chr17p are first detected in skin relapse #2, and loss of chr5q is first detected in the bone marrow relapse. Donor DNA is detected in both skin sample #2 and bone marrow relapse sample. Estimated fraction of donor DNA is <5% and 40%, respectively. e, Genome plot shows similar analysis for a bone marrow relapse sample of Patient 12, who did not receive an allogeneic stem-cell transplant. Additional alterations in chr1, chr5q, and chr12p are indicated. Related to Fig. 1.
Extended Data Fig. 5
Extended Data Fig. 5. Single-cell transcriptome analysis of healthy donor and BPDCN patient bone marrow samples.
a, Heatmap depicts five-fold cross validation of the random forest classifier comprising 22 classes corresponding to the cell types identified in healthy bone marrow samples (including inferred cell doublets). The healthy donor cells were split such that 80% were used as a reference to predict the classification of the remaining 20%. This process was repeated five times. Cells that fall on the diagonal are classified according to their annotation. Cells that do not fall on the diagonal are mis-classified as a different cell type. b, Heatmaps show expression of known marker genes (rows) in cells (columns) of the myeloid and erythroid differentiation trajectories in bone marrow samples from healthy donors (left) and from BPDCN patients without known bone marrow involvement (right). Top annotation bars show cell types (colour legend provided in panel c) and sample identity. c, Barplot shows the proportion of cell types within each of the 17 analysed single-cell samples. Healthy donor cells were annotated by clustering and assessment of marker gene expression. Patient cells were annotated using the random forest classifier, using healthy donors as a reference. The high proportion of T cells in Patient 10 was consistent with flow cytometry. d, Dot plot shows percent of cells classified as pDCs in each healthy donor and patient sample. High percentage of pDCs in samples with known marrow involvement reflects malignant BPDCN cells. Data is shown for all samples that were analysed by scRNA-seq (n = 6 healthy donors, n = 5 samples without known marrow involvement, and n = 6 samples with marrow involvement). Statistical significance between sample groups is indicated (two-sided Student’s t-test). e, Scatterplot shows B (minor) allele frequencies of Patient 10 SNVs in relapse bone marrow sample (post allogeneic stem cell transplant, y-axis) and germline sample (x-axis). SNVs homozygous in the host germline sample are indicated in blue (A/A) and green (B/B), heterozygous SNVs are indicated in red (A/B). This analysis allows for the identification of alleles that are specific for host and donor cells (indicated in bold). Thresholds that were used for subsetting these SNVs are indicated. f, Scatterplot shows quantification of host- and donor-specific alleles in the scRNA-seq data of Patient 10 relapse bone marrow samples (red). The fraction of SNVs specific to the donor genome is indicated on the x-axis. Genotypes could be assigned for the majority of cells (98.0%), with 62.6% of those annotated as host-derived, and 37.4% annotated as donor-derived. Cells from the diagnostic bone marrow sample (blue), for which no cells were annotated as donor-derived, are shown as comparison. g, Barplot shows the proportion of cell types within Patient 10 relapse cells genotyped as host- and donor-derived. Most host cells classify as pDCs, likely reflecting malignant BPDCN cells. h, Violin plot shows scores of a published BPDCN gene signature for pDCs from each of the 17 analysed single-cell samples. Related to Fig. 2.
Extended Data Fig. 6
Extended Data Fig. 6. Single-cell genotyping of bone marrow samples.
a, Scatterplot shows overview of the genotyping efficiency of all 40 mutations targeted by XV-seq across 11 samples. Some mutations were analysed in multiple samples collected from the same patient. b, Genome plot shows combined 10x scRNA-seq reads for Patient 10 relapse bone marrow donor cells and host cells over the CDKN2A gene locus on chromosome 9. The focal homozygous deletion observed in (malignant) host cells results in atypical splicing of the upstream MTAP gene to five different acceptor sites downstream of CDKN2A. This enabled the generation of a genotyping primer specific to exon 4 of MTAP that can be used to detect the CDKN2A deletion in single cells. c, Scatterplot compares the number of genotyped cells detected in raw scRNA-seq data (x-axis) with the number of genotyped cells detected by XV-seq (y-axis, r = 0.71). Median enrichment across targets is 11.1-fold (indicated by dashed line). These data demonstrate XV-seq target enrichment and the utility of selecting suitable mutations based on raw scRNA-seq data. d, Scatterplot shows the genotyping efficiency of XV-seq targets (y-axis) compared to the normalized expression level of the transcript (x-axis, r = 0.55). e, Scatterplot shows agreement between VAFs from bulk targeted sequencing using the Rapid Haem Panel (y-axis) and single-cell genotyping using XV-seq (x-axis, r = 0.73). For the latter, the VAF was calculated as the number of mutated transcripts / number of total transcripts captured. f, Barplot shows the percentage of cells from the Patient 10 relapse sample (post stem cell transplant) for which genotype information was obtained (Extended Data Fig. 5e–g). RAB9A is located on chromosome X (male patient) and CDKN2A is located on chromosome 9 of which one copy is lost in addition to the focal deletion of the locus (Extended Data Fig. 3a). The exclusive detection of wild-type and mutated transcripts in the expected cell populations supports accuracy of cell type annotation, host/donor classification, and XV-seq mutation detection. g, Illustration of supporting evidence for subclonal structure obtained from single-cell XV-seq of the Patient 10 uninvolved bone marrow. TET2 mutations S792* and Q1034* co-occur in the same cell (major subclone). Similarly, TET2 mutations H1216* and H1380Y also co-occur in the same cell (minor subclone). Mutations specific to the two subclones were not detected in the same cell. The sample is karyotypically normal, further supporting the existence of two subclones, as truncating mutations in TET2 are unlikely to affect the same allele. VAFs from targeted sequencing are indicated between parentheses. h, Illustration of supporting evidence for subclonal structure obtained from single-cell XV-seq of the Patient 9 uninvolved bone marrow. This sample is characterized by a sub-clonal loss of heterozygosity (LOH) on chr7q. Detection of the lost haplotype in n=25 single cells indicates that mutations in TET2 and CUX1 occurred before the LOH of chr7q. VAFs from targeted sequencing are indicated between parentheses. The high VAF of the mutation in CUX1 is explained by its location on chr7q. i, Heatmaps show proportion of TET2-mutated cells in each major hematopoietic cluster. Ten patient-specific TET2 mutations were assessed in five marrow samples. P-values indicate mutant-cell enrichment in HSPC/Erythroid/Myeloid vs. B/T/NK cells by Pearson’s Chi-square test with Yates’ correction. Related to Fig. 2.
Extended Data Fig. 7
Extended Data Fig. 7. Single cell-derived BPDCN signature enables malignant cell classification.
a, UMAPs show all cells classified as pDCs across the entire scRNA-seq dataset (n = 14,430 cells), coloured according to patient/sample (left), samples with and without known BPDCN involvement (middle), and BPDCN signature score (right). b, Volcano plot shows differentially expressed between healthy pDCs and malignant BPDCN cells. We used 45 genes with log2 fold change > 1 and adjusted P-value < 1E-30 (green symbols), including BCL2 and TCL1A, to calculate the BPDCN signature score in downstream analyses. All 45 genes are provided in Supplementary Table 3c. P-values were calculated using a two-sided Wilcoxon Rank Sum test and adjusted using Bonferroni correction as implemented in the Seurat function FindMarkers. c, Scatterplot shows signature scores in all cells that were classified as pDC (n = 14,430). We calculated scores using a previously published BPDCN module (x-axis) and using the 45 signature genes we defined in panel a (y-axis). d, Sinaplot shows BPDCN signature scores in all single cells (n = 87,011) that we profiled in this study, split by donor type. The colour indicates cell type classification by the RandomForest algorithm. e, Scatterplots show single cells from all patient samples (n = 66,600) according to their random forest pDC prediction score (x-axis) and BPDCN signature score (y-axis). Red dots indicate detection of mutant transcripts (n = 16 founder mutations, left; n = 15 progression mutations, right), grey dots indicate detection of wild-type transcripts. f, Sinaplot shows BPDCN signature scores in all single cells (n = 87,011), split by cell type and coloured by final classification. g, Violin plots show expression of canonical marker genes in cells that were originally classified as proB cells and plasma cells. Cells with a BPDCN signature score exceeding 0.5 were reclassified as malignant cells. The absence of CD19 in reclassified proB cells and the absence of CD138 in reclassified plasma cells supports our reclassification. h, Flow chart illustrates classification of healthy pDCs, premalignant pDCs, and malignant BPDCN cells for single cells across the dataset. Related to Fig. 2.
Extended Data Fig. 8
Extended Data Fig. 8. Gene expression and mutation analysis outlines BPDCN disease progression.
a, Scatterplot shows gene expression fold changes between premalignant vs. healthy pDCs (x-axis) and malignant BPDCN cells vs. healthy pDCs (y-axis). The changes are positively correlated (r = 0.28) and more pronounced for the malignant BPDCN cell comparison. b, Violin/sina plots show expression of selected genes that are differentially expressed between healthy pDCs (n = 203), premalignant pDCs (n = 495), and malignant BPDCN cells (n = 14,232). Cells are grouped according to cell annotations defined in Extended Data Fig. 7f. Adjusted P-values indicate a comparison to healthy pDCs and were calculated using a two-sided Wilcoxon Rank Sum test and adjusted using Bonferroni correction as implemented in the Seurat function FindAllMarkers. c, Sina plots show the BPDCN signature score in all cells classified as pDC in bone marrow samples from healthy donors and patients without involvement. Red dots indicate cells with detection of mutant transcripts, green dots indicate cells with detection of wild-type transcripts (n = 16 founder mutations, left; n = 13 progression mutations, right). Progression mutations were nearly exclusively captured in cells with a BPDCN signature score exceeding 0.5, consistent with the malignant identity of these cells (P = 1.1E-84 by Pearson’s Chi-square test with Yates’ correction). d, Scatterplots show single cells from the Patient 10 diagnostic sample (n = 10,106) according to their random forest pDC prediction score (x-axis) and BPDCN signature score (y-axis). Red dots indicate detection of mutant transcripts, green dots indicate detection of wild-type transcripts for six indicated genes. Integrated analysis of gene expression and mutations concertedly identified rare circulating malignant BPDCN cells (n = 19, 0.19%). e, Scatterplot shows single cells from the Patient 12 diagnostic sample (n = 6,862) according to their random forest pDC prediction score (x-axis) and BPDCN signature score (y-axis). Red dots indicate detection of mutant transcripts, green dots indicate detection of wild-type transcripts for MALAT1. The detection of mutated transcripts in two cells with a high BPDCN signature score supports their malignant identity. Related to Fig. 2.
Extended Data Fig. 9
Extended Data Fig. 9. Mutational signature analysis of BPDCN patient samples.
a, Heatmaps show mutational signature analysis of BPDCN patient samples analysed by whole-exome sequencing from three published datasets,,. Blue heat indicates the predicted relative contribution of the mutational signature. Relative contribution of signature 7 (UV damage signature) is indicated. Samples from Batta et al. were generated from indicated bone marrow populations at diagnosis (n = 3) and relapse (n = 1), and a skin tumour sample, all from the same patient. The UV damage signature is detected in all samples containing malignant cells (relative contribution ≥0.38). Samples from Sapienza et al. were generated from skin tumours of nine patients. The UV damage signature is detected in five samples (≥0.27). Samples from Togami et al. were generated from sorted malignant cells of bone marrows from 11 patients. The UV damage signature is detected in four samples (≥0.20). b, Heatmaps show sequence context of somatic SNVs detected in samples analysed by whole-exome sequencing. Mutations are only shown in the sample in which they were first detected, and not in subsequent samples. Column headers indicate the base substitution. X- and y-axis labels indicate the bases upstream and downstream of the mutated base, respectively. Red heat indicates the relative contribution of mutations within the given nucleotide context. UV-associated CC > CT and TC > TT mutations are indicated by bold horizontal boxes and their total percentages. c, Heatmaps show sequence context of somatic SNVs detected in samples analysed by whole-genome sequencing. Annotations are similar to panel b. d, Barplot shows the number of dinucleotide mutations detected in samples from Patient 1, grouped by UV-specific CC > TT and all other dinucleotide mutations. Mutations are only shown in the sample in which they were first detected. e, Barplots indicate the percentage of cells for which wild-type or mutant transcript were detected using XV-seq. Selected UV-associated (CC > CT and TC > TT) as well as UV-specific (CC > TT, ETV6) progression mutations are shown. Cells are grouped according to cell annotations defined in Extended Data Fig. 7f. Notably, in the diagnostic sample of Patient 10 (without known marrow involvement), UV-associated mutations are specifically detected in rare malignant cells (n = 19), consistent with our model of retrograde dissemination. Related to Fig. 3.
Extended Data Fig. 10
Extended Data Fig. 10. Order of acquisition of UV damage and functional evaluation in the HOXB8 model of pDC differentiation.
a, Scatterplot shows B (minor) allele frequencies of SNVs located on chromosome 3 in skin tumour #1 and #2 from Patient 10. SNVs are coloured according to their genotype in the matching germline sample. Loss of a region on chr3p (Extended Data Fig. 3a) affects different alleles, indicating separate events and convergent evolution in both skin tumours samples. Heterozygous SNVs were phased along the diagonal (shown in Fig. 4d). b, Barplots show VAFs for founder and progression mutations detected in bone marrow samples (top) and matched skin tumour samples (bottom) from Patients 7 ans 9. UV-associated TC > TT mutations are indicated in orange, other mutations in green. Average VAF (solid line) and coefficient of variation (CV, standard deviation divided by mean, dotted lines) of founder mutations are indicated. Asterisks indicate mutations that are affected by copy-number alterations (Patient 9) or are likely contaminants from blood (Patient 7) and are not included in this calculation. c, UMAPs of scRNA-seq performed on bone marrow cells (n=7,374 cells) from Patient 14. Cell type clusters (left), BPDCN signature scores (middle), and single cell genotyping results for the UV-specific (CC>TT) ETV6.R369W mutation (right) are shown. d, Flow cytometry gating strategy for the identification of pDCs (CD11c+/CD11b-/B220+) and cDCs (CD11c+/CD11b+/B220-) from representative HOXB8 cultures. e, Time course showing the dynamics of representative pDC and cDC differentiation from day 3 to day 8 following oestrogen withdrawal in the HOXB8 system. pDC and cDC populations become distinguishable on days 6-8. f, Amplicon sequencing showing successful CRISPR/Cas9 editing of Tet2 in HOXB8 cells using two different gRNAs. Greater than 95% of reads for each guide are edited, including insertions (red boxes) and deletions (dashes) predicted to cause frameshift alterations. The predicted Cas9 cleavage site 3 nucleotides upstream from the NGG PAM site is indicated with a vertical dashed line. Related to Fig. 4.

Comment in

References

    1. Jaiswal S, et al. Age-related clonal hematopoiesis associated with adverse outcomes. N. Engl. J. Med. 2014;371:2488–2498. doi: 10.1056/NEJMoa1408617. - DOI - PMC - PubMed
    1. Genovese G, et al. Clonal hematopoiesis and blood-cancer risk inferred from blood DNA sequence. N. Engl. J. Med. 2014;371:2477–2487. doi: 10.1056/NEJMoa1409405. - DOI - PMC - PubMed
    1. Xie M, et al. Age-related mutations associated with clonal hematopoietic expansion and malignancies. Nat. Med. 2014;20:1472–1478. doi: 10.1038/nm.3733. - DOI - PMC - PubMed
    1. Belizaire, R., Wong, W. J., Robinette, M. L. & Ebert, B. L. Clonal haematopoiesis and dysregulation of the immune system. Nat. Rev. Immunol.10.1038/s41577-023-00843-3 (2023). - PMC - PubMed
    1. Garnache-Ottou F, et al. How should we diagnose and treat blastic plasmacytoid dendritic cell neoplasm patients? Blood Adv. 2019;3:4238–4251. doi: 10.1182/bloodadvances.2019000647. - DOI - PMC - PubMed

Publication types

MeSH terms

Substances