. 2023 Jul;619(7969):357-362.
doi: 10.1038/s41586-023-06160-y. Epub 2023 Jun 7.

Health system-scale language models are all-purpose prediction engines

Affiliations

Health system-scale language models are all-purpose prediction engines

Lavender Yao Jiang et al. Nature. 2023 Jul.

Abstract

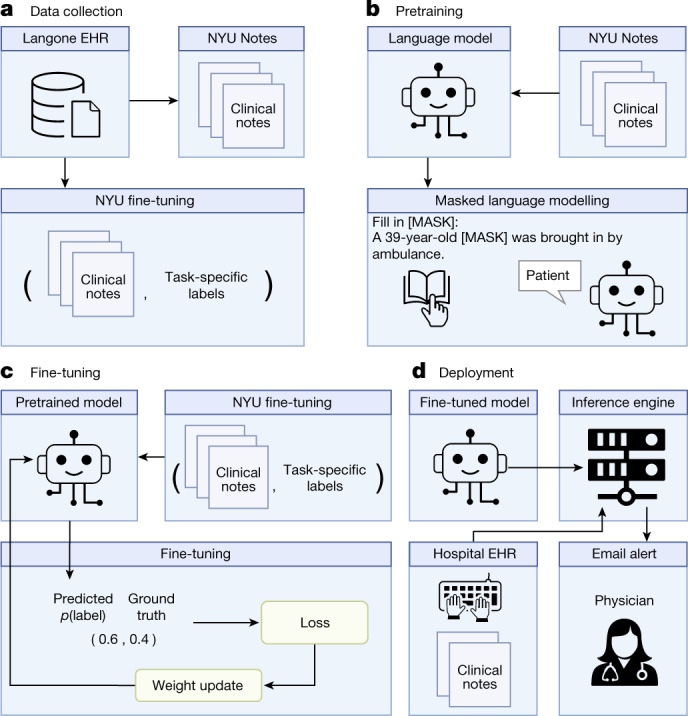
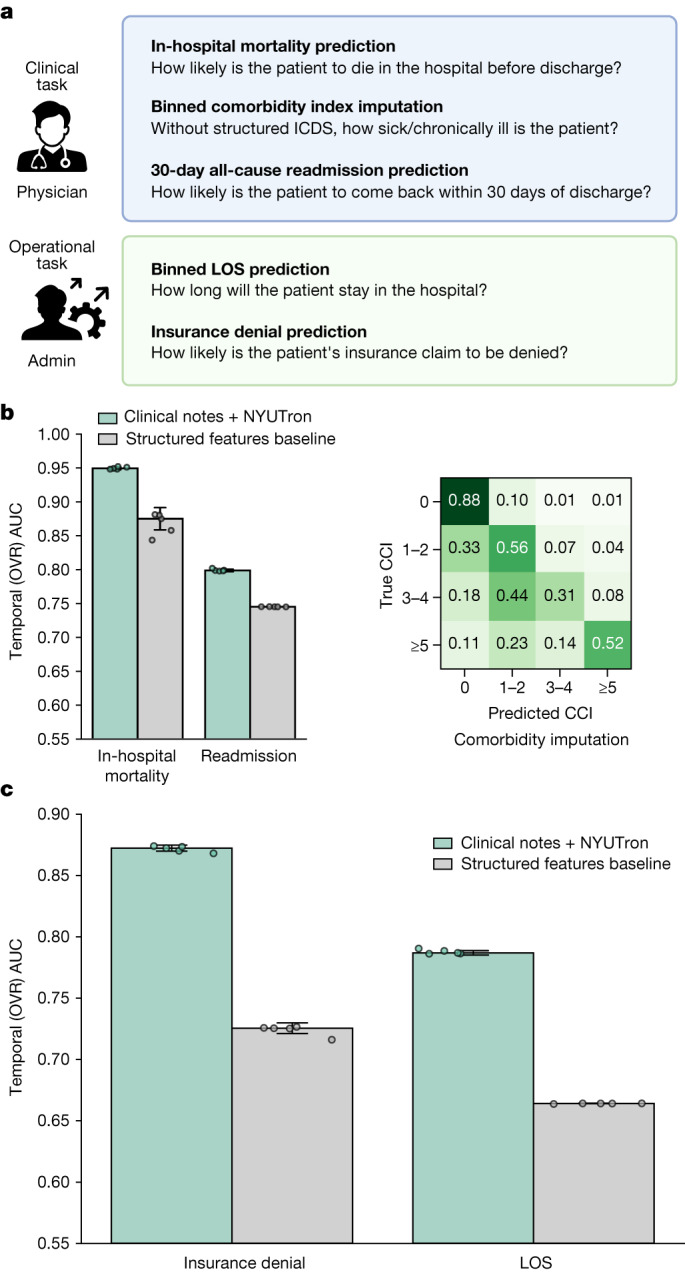
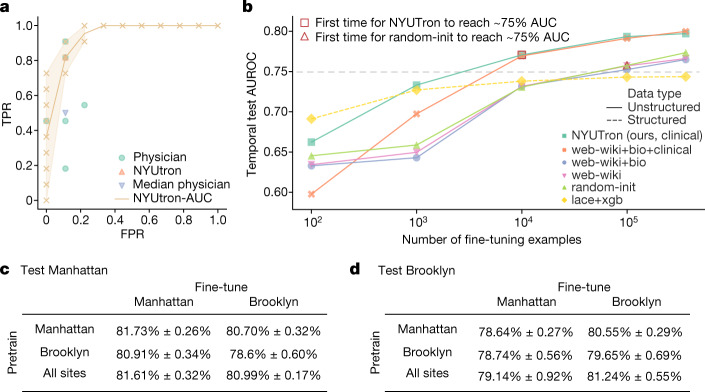
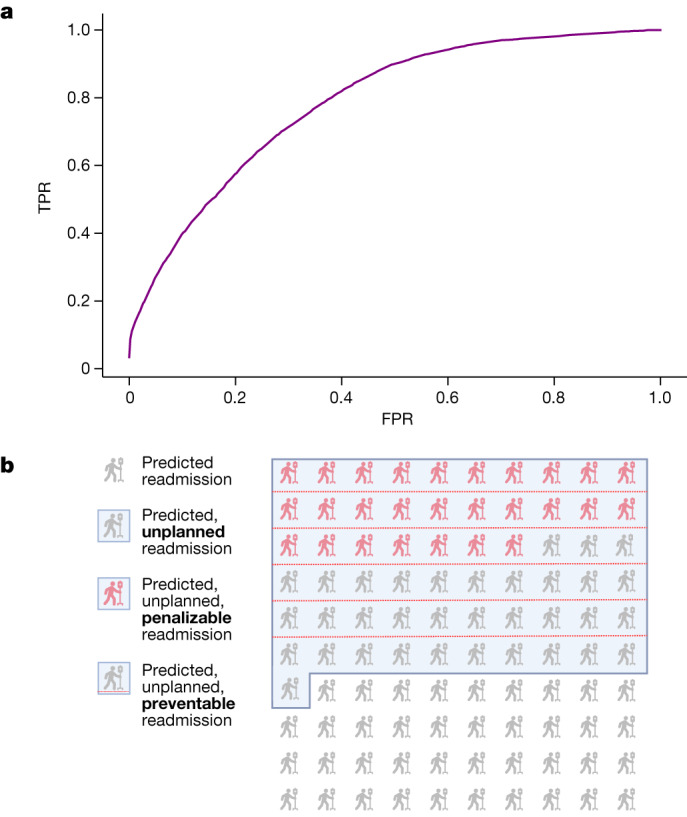
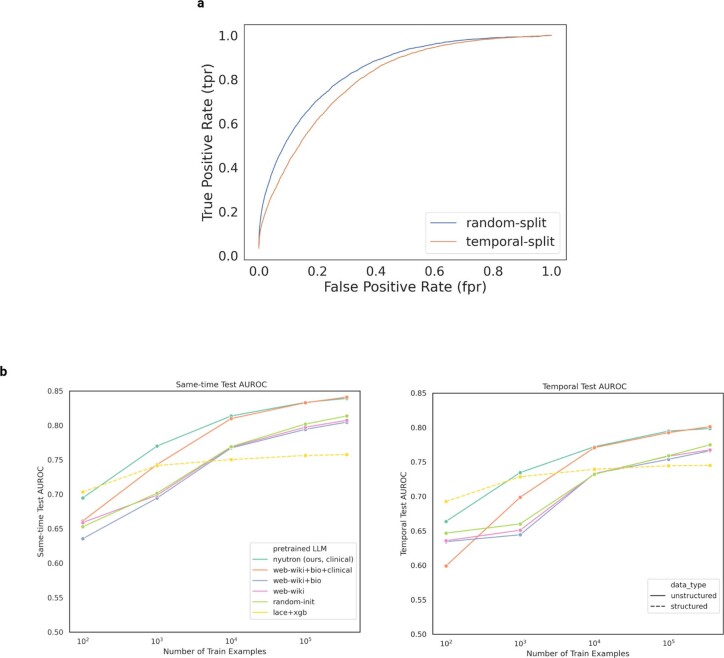
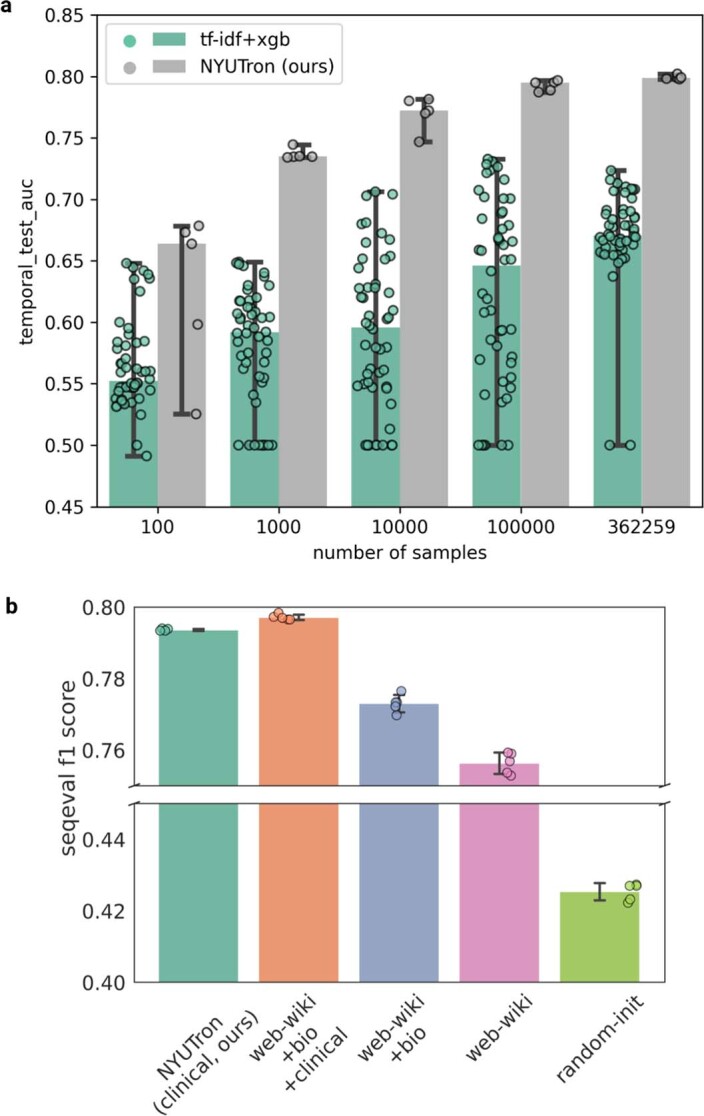
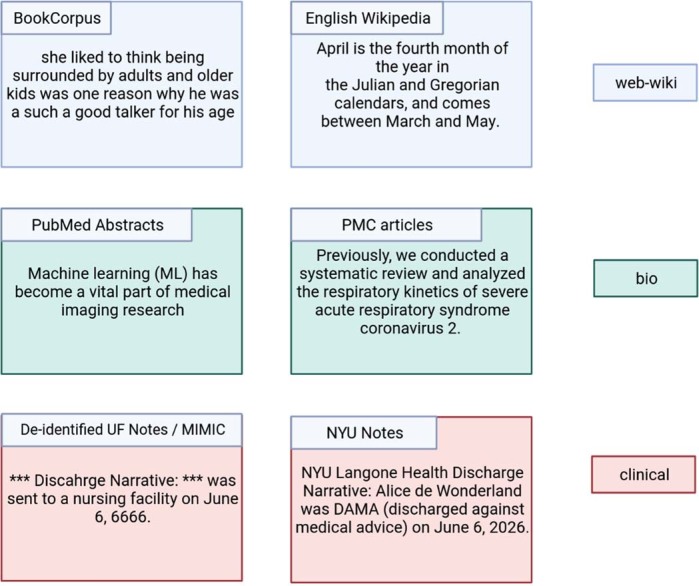
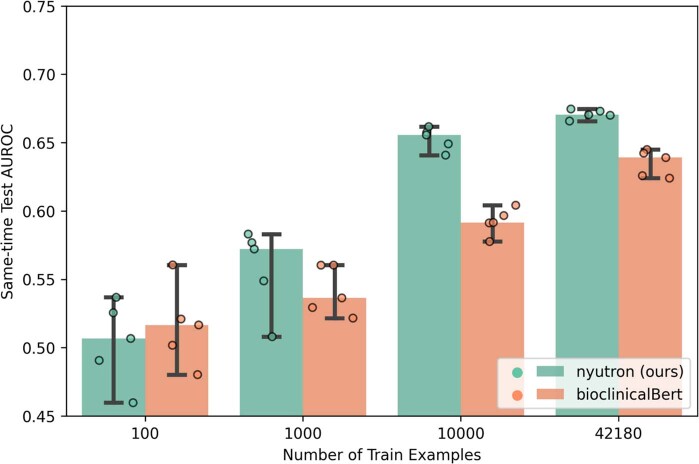
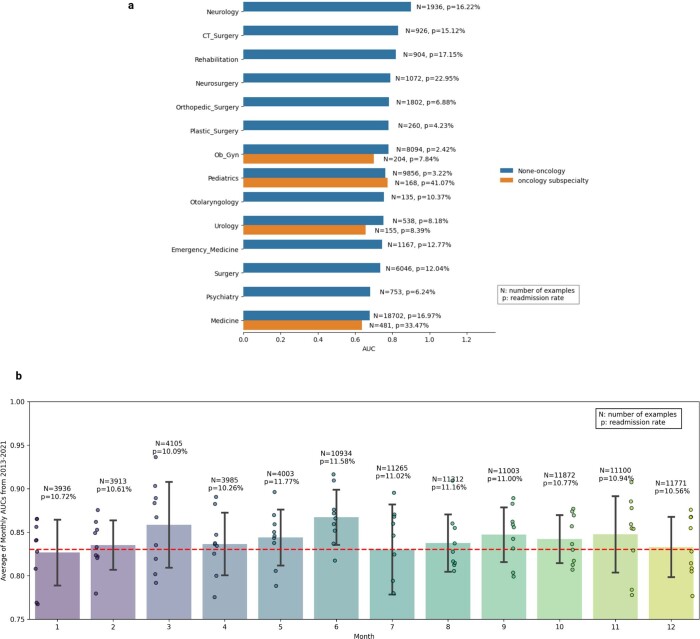
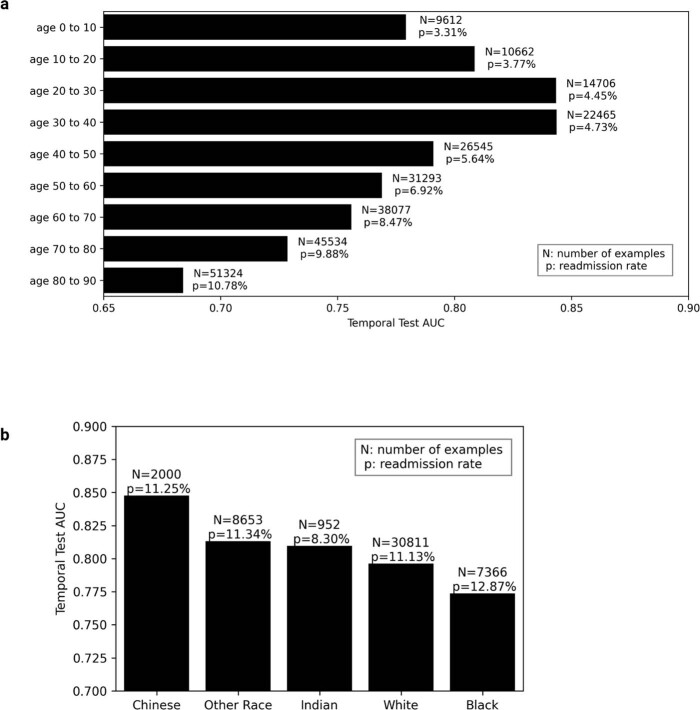
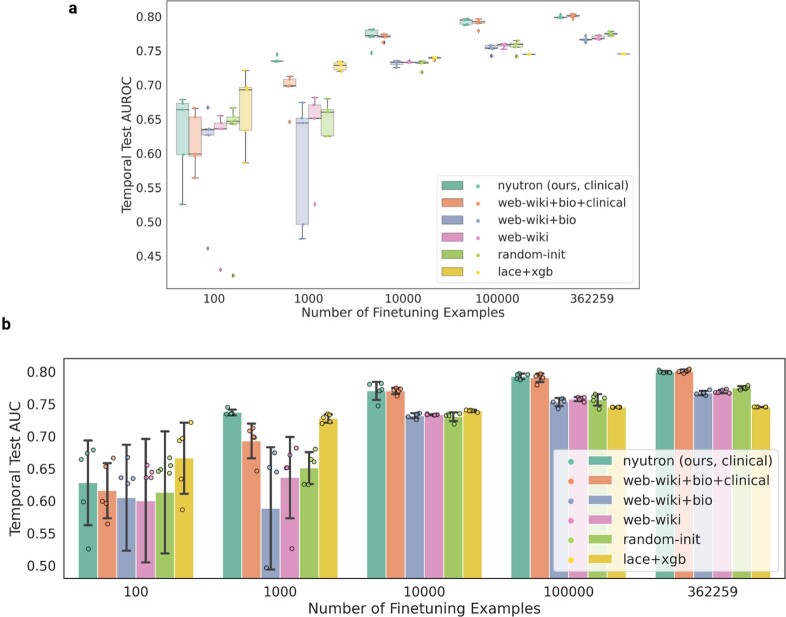
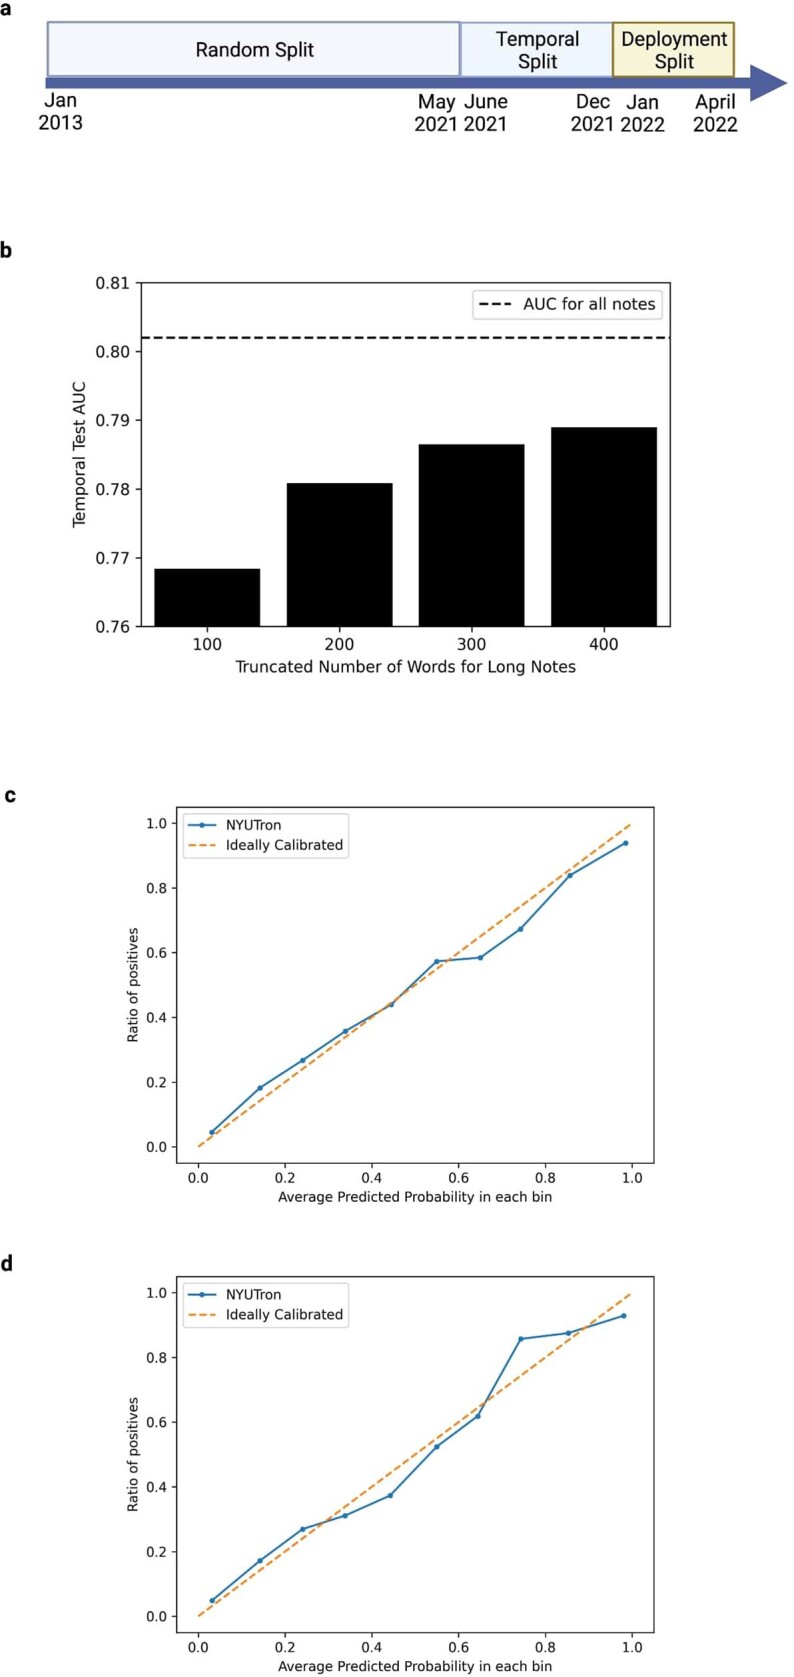
Physicians make critical time-constrained decisions every day. Clinical predictive models can help physicians and administrators make decisions by forecasting clinical and operational events. Existing structured data-based clinical predictive models have limited use in everyday practice owing to complexity in data processing, as well as model development and deployment1-3. Here we show that unstructured clinical notes from the electronic health record can enable the training of clinical language models, which can be used as all-purpose clinical predictive engines with low-resistance development and deployment. Our approach leverages recent advances in natural language processing4,5 to train a large language model for medical language (NYUTron) and subsequently fine-tune it across a wide range of clinical and operational predictive tasks. We evaluated our approach within our health system for five such tasks: 30-day all-cause readmission prediction, in-hospital mortality prediction, comorbidity index prediction, length of stay prediction, and insurance denial prediction. We show that NYUTron has an area under the curve (AUC) of 78.7-94.9%, with an improvement of 5.36-14.7% in the AUC compared with traditional models. We additionally demonstrate the benefits of pretraining with clinical text, the potential for increasing generalizability to different sites through fine-tuning and the full deployment of our system in a prospective, single-arm trial. These results show the potential for using clinical language models in medicine to read alongside physicians and provide guidance at the point of care.


Conflict of interest statement

E.K.O. reports consulting with Sofinnova and Google, income from Merck & Co. and Mirati Therapeutics, and equity in Artisight. N.P.N., M.F. and A.B.C. are employed by NVIDIA. D.K. reports consulting with Elekta. K.C. is employed by Prescient Design, a Genentech accelerator, a subsidiary of Roche. There are no other potential conflicts of interest. The work presented herein was performed exclusively within the NYU Langone Health System.

Figures

Fig. 1
Fig. 1. Overview of the language model-based approach for clinical prediction.
a, We queried the NYU Langone EHR for two types of datasets. The pretraining dataset, NYU Notes, contains 10 years of inpatient clinical notes (387,144 patients, 4.1 billion words). There are five fine-tuning datasets. Each contains 1–10 years of inpatient clinical notes (55,791–413,845 patients, 51–87 million words) with task-specific labels (2–4 classes). b, We pretrained a 109 million-parameter BERT-like LLM, termed NYUTron, on the entire EHR using an MLM task to create a pretrained model for medical language contained within the EHR. c, We subsequently fine-tuned the pretrained model on specific tasks (for example, 30-day all-cause readmission prediction) and validated it on held-out retrospective data. d, Lastly, the fine-tuned model was compressed into an accelerated format and loaded into an inference engine, which interfaces with the NYU Langone EHR to read discharge notes when they are signed by treating physicians.
Fig. 2
Fig. 2. Overall temporal test performance across five tasks.
a, The five tasks include three clinical tasks and two operational tasks. b, On readmission prediction, NYUTron had a median AUC of 79.9% ± 0.168% with a 5.36% improvement. On in-hospital mortality prediction, NYUTron had a median AUC of 94.9% ± 0.168% with a 7.43% improvement. On comorbidity index imputation, NYUTron had an OVR median AUC of 89.4% ± 0.275%. A confusion matrix is shown on the right. c, On binned LOS prediction, NYUTron had a median AUC of 78.7% ± 0.179% with a 12.3% improvement from the structured baseline. On insurance denial prediction, NYUTron had a median AUC of 87.2% ± 0.246% with a 14.7% improvement. For b,c, the height of the error bar is the median AUC and the half-width of the error bar is 1 s.d. The grey points are individual data points from n = 5 experiments using distinct random seeds.
Fig. 3
Fig. 3. Retrospective study of NYUTron’s readmission prediction.
a, On 20 cases sampled from a random split, we compared NYUTron’s TPR and FPR with those for six physicians. NYUTron (orange triangles) had a higher TPR and the same FPR when compared with the median physician performance (green circles). The error band for AUC ranges from the minimum to maximum, and the orange crosses indicate TPR and FPR using all possible thresholds. We chose NYUTron’s threshold on the basis of validation data. b, Comparison of the temporal test AUCs of different pretrained LLMs with an increasing number of fine-tuning examples. For simplicity, we omit the variance and only plot the median performance of five trials. Differences in median performance with 100 and 1,000 examples are less notable because AUCs with sparse fine-tuning examples have high variance (at 100 examples, we had 4.26% to 9.56% variance; at 1,000 examples, we had 0.44% to 9.46% variance). AUC variance decreases with more fine-tuning examples. The horizontal dashed line at 0.75 corresponds to the threshold for performance. See alternative presentations in Extended Data Fig. 7. c,d, Temporal test performance of NYUTron using pretraining, fine-tuning and test data from different sites. For both the Manhattan and Brooklyn tests, the column corresponding to local fine-tuning shows better performance than that with external fine-tuning. Each entry in c,d is presented as the mean ± 1 s.d. for n = 5 experiments using distinct random seeds.
Fig. 4
Fig. 4. Prospective study of NYUTron’s predictive performance.
a, NYUTron had an AUC of 78.70% in a prospective, single-arm, non-interventional trial with recall of 82.3% and precision of 20.6%. b, A panel of six physicians reviewed NYUTron’s results for potential clinical impact. Of 100 readmissions that were successfully identified by NYUTron, 61% were unplanned readmissions, 50% would have resulted in a penalty under CMS guidelines and 27% were preventable at the time of discharge according to the consensus opinion of the multi-specialty panel of physicians who reviewed cases from the prospective trial. See Supplementary Information section 2.1 for a discussion of the readmission label and the practical significance of the observed performance.
Extended Data Fig. 1
Extended Data Fig. 1. Difference between random test and temporal test.
a, AUC curve for the random test shows better performance than the temporal test. The random-test AUC is 84.13%, compared to the temporal-test AUC of 80.2%. The difference highlights the importance of creating a test set to reflect the problem setup. In the case of readmission prediction, the deployment set always comes from the future of the training set. Thus we use the temporal test AUC for model selection. b, Comparison of random-test AUC and temporal-test AUC as the number of training examples increases shows that temporal-testing is important to estimate deployment performance. Here we show that sampling a temporally split out dataset seems “harder” than a randomly sampled test dataset because all tested LLMs and lace+xgb perform worse on the temporal test (notes from the future) than the random test (notes from the same time as the training data). The colored lines on the left (random test AUCs) are generally higher than the colored lines on the right (temporal test AUCs). We conclude that this is an important distinction that temporally sampled held-out test sets give a more realistic estimate of model performance. Interestingly, the language models seem to be more sensitive to this phenomenon than the lace+xgb model.
Extended Data Fig. 2
Extended Data Fig. 2. Benchmarking NYUTron against a traditional NLP model and other language models on a different clinical prediction task (clinical concept extraction).
We observe a similar trend as readmission prediction: (a) shows that NYUTron has better performance than tf-idf under different data availability settings and (b) shows that clinically pretrained language models have better performance than non-clinically pretrained language models. This corroborates our findings that health-system scale language models are general purpose clinical prediction engines and that a domain match between pretraining and finetuning corpus contributes to task performance. a, Comparison of temporal test AUCs between NYUTron and a traditional NLP model (tf-idf+xgb). NYUTron has a higher median AUC than tf-idf+xgb for all tested number of finetuning examples. The black vertical line indicates standard deviation over 5 trials of different random seeds (0, 13, 24, 36, 42). b, Comparison of LLMs’ finetuning performances on the NER task. On the i2b2-2012 clinical concept extraction task, the LLMs that are pretrained with clinical corpora (NYUTron, web-wiki+bio+clinical) have a higher average f1 score than LLMs that are not pretrained with clinical corpora (web-wiki+bio, web-wiki, random-init). Specifically, NYUTron and web-wiki+bio+clinical perform better than the randomly initialized model (36.64% higher median seqeval f1 score) and non-clinically pretrained models (2.01%–3.48% higher median seqeval f1 score). Note that the height of each bar is the average f1 score and the half length of each black vertical line indicates the standard deviation over 5 trials of different random seeds (0, 13, 24, 36, 42).
Extended Data Fig. 3
Extended Data Fig. 3. Examples of pretraining corpora.
We include here some examples from the utilized pretraining corpora to help contextualize our work. Examples from three types of pretrain corpus: (1) web-wiki (online books from bookcorpus and encyclopedia articles from English Wikipedia), (2) bio (abstracts of academic papers from Pubmed Abstracts and full articles from Pubmed Central), and (3) clinical (NYU Notes, NYU Readmission from Langone EHR and clinical notes from University of Florida Health).
Extended Data Fig. 4
Extended Data Fig. 4. Comparison of NYUTron’s and BioClinicalBERT’s performance on MIMIC-III Readmission.
To test how much finetuning NYUTron needs to generalize to another health system, we finetune NYUTron and BioClinicalBERT (which has the same number of parameters and architecture as NYUTron, but pretrained on MIMIC notes, bookcorpus, pubmed and wikipedia articles) using different subsamples of MIMIC-III readmission dataset. The dataset contains 52,726 de-identified ICU discharge notes from Boston Beth Israel Hospital with 8:1:1 train-val-test split. At 100 samples, the AUC is similar. At 1000 samples, NYUTron has a 3.58% higher median AUC than BioClinicalBERT (57.22% v.s. 53.64%). At 10,000 samples, NYUTron has a 6.42% higher median AUC than BioClinicalBERT (65.56% v.s. 59.14%). Using the full dataset (42,180 samples), NYUTron has a 3.8% higher median AUC than BioClinicalBERT (67.04% v.s. 63.24%). Given that NYUTron was pretrained on identified all-department notes from NYU Langone and finetuned on de-identified ICU-specific notes from Beth-Israel, this result shows that NYUTron is able to generalize to a very different health environment through local finetuning. The height of the bar indicates the median performance of 5 experiments using distinct random seeds (0, 13, 24, 36, 42) and the error bar indicates the min-max range.
Extended Data Fig. 5
Extended Data Fig. 5. Bias analysis stratifying NYUTron’s performance by clinical departments and months.
a, A stratified analysis of NYUTron’s temporal test performance by clinical department and oncological subspecialty. NYUTron performs best in the Neurology Department (AUC 90.12%), and performs worst in the Internal Medicine Department (AUC 67.95% for non-oncology specialty and AUC 63.77% for oncology specialty), with a difference of about 20% AUC. This significant variance across clinical departments suggests that a more fine-grained analysis may lead to performance benefits. We annotate the number of examples (N) and the readmission rate (p) for each department. b, NYUTron’s performance displays minor fluctuations over months. We plot the average monthly test AUC of NYUTron from January 2013 to December 2021 to look for underlying monthly trends or cycles and to test the hypothesis that performance would be worst in July when new physicians start their training with a different writing style than physicians already in practice (dashed red line indicating the monthly AUC of July). The height of the bar indicates average monthly performance across the 9 years and the vertical bar indicates the standard deviation. We annotate the number of examples (N) and the readmission rate (p) for each month. We note that July has the second lowest monthly AUC and the highest variance. We speculate (and need more years of data to verify) that clinical notes written by new physicians are associated with the temporal shift across the months and the drop in performance in July. Average AUCs from the quarters January to March, April to June, and July to September are increasing, which may coincide with residents’ rotation schedule across different clinical departments. We leave further investigation of this cyclical performance to future work.
Extended Data Fig. 6
Extended Data Fig. 6. Bias analysis stratifying NYUTron’s performance by age groups and major racial groups.
As part of an analysis of model performance by two possible sources of bias, age and race, we perform stratified analyses of NYUTron’s performance. We annotate the number of examples (N) and the readmission rate (p) for each evaluation. a, We stratify the temporal test based on nine bins of ages (0 to 90 years with bins of 10 year intervals). NYUTron performs best for patients who are 10 to 40 years old, and has declining performance by decile over the age of 40 years with the worst performance in the 80–90 years of age group. We observe that this isn’t an effect of sample size, the single largest sample is age 80–90, but likely reflects complexity and comorbidity burdens being disproportionately higher with advanced age. b, To test for potential dependencies and bias by race, we first identify the five most frequent races in the dataset (White, Other Race, Black, Chinese, Indian), then stratify the evaluation results by race. NYUTron performs best on Chinese patients and worst on Black patients with a mild variation in AUC across both groups.
Extended Data Fig. 7
Extended Data Fig. 7. Detailed statistics of the comparison between language models and lace+xgb.
a, A box plot with individual data points. For each model, 5 experiments were run using random seeds 0, 13, 24, 36, 42. The centerline of the box plot indicates the median. The upper line of the box indicates the first quantile. The lower line of the plot indicates the last quantile. The whisker extends to 1.5 times the interquartile length and the diamonds indicate outliers. b, A bar plot that shows the mean and standard deviation. The height of the bar indicates the mean across 5 experiments and the length of the black vertical line indicates the standard deviation.
Extended Data Fig. 8
Extended Data Fig. 8. Additional information about readmission prediction.
a, Visualization of readmission data split timelines. We visualize the random split, temporal split, and deployment split on a timeline to indicate this decision for model evaluation. The random split starts from January 2013 and ends in May 2021 (inclusive), which is further split into a 80% train set, 10% validation set and a 10% test set. The temporal split (temporal test) starts from June 2021 and ends in December 2021, a time period from which no training samples were sampled from. The deployment data is necessarily sampled from the future as it is accrued prospectively as part of our single arm, non-interventional clinical trial. b, NYUTron’s performance increases with more complete input notes. To attempt to estimate performance as a function of sequence length we sampled a subset of “long notes” from the temporal test set. Each note in this subset has no less than 400 words, or approximately 512 tokens. We truncated these long notes to 100, 200, 300 and 400 words while keeping their readmission labels fixed in order to demonstrate the incremental gain in performance as we capture proportionally more information from each of these “long notes”. The dashed line is the AUC of all notes. This figure shows that processing more words from the possible input leads to a better evaluation performance and confirms that there is a clear potential for improving performance by increasing maximum sequence length. c,d NYUTron’s calibration curve for temporal test (c, number of evaluation examples is N = 53,916) and prospective deployment (d, number of evaluation examples is N = 29,286). As a reference, the orange line is the calibration curve of an ideally calibrated classifier. The blue line is NYUTron’s calibration curve. Currently we do not perform any additional calibration and choose the decision threshold based on the precision and recall on the temporal validation set. The predicted probability is normalized by the largest predicted probability. Overall the model is well calibrated to the 30-day readmission task.

References

    1. Roberts M, et al. Common pitfalls and recommendations for using machine learning to detect and prognosticate for COVID-19 using chest radiographs and CT scans. Nat. Mach. Intel. 2021;3:199–217. doi: 10.1038/s42256-021-00307-0. - DOI
    1. Kelly CJ, Karthikesalingam A, Suleyman M, Corrado G, King D. Key challenges for delivering clinical impact with artificial intelligence. BMC Med. 2019;17:195. doi: 10.1186/s12916-019-1426-2. - DOI - PMC - PubMed
    1. Gaube S, et al. Do as AI say: susceptibility in deployment of clinical decision-aids. NPJ Digit. Med. 2021;4:31. doi: 10.1038/s41746-021-00385-9. - DOI - PMC - PubMed
    1. Devlin, J., Chang, M.-W., Lee, K. & Toutanova, K. BERT: pre-training of deep bidirectional transformers for language understanding. in Proc. 2019 NAACL: Human Language Technologies (eds Burstein, J., Doran, C. & Solorio, T.) 4171–4186 (Association for Computational Linguistics, 2019).
    1. Brown, T. B. et al. Language models are few-shot learners. in Proc. NeurIPS (eds Wallach, H. et al.) 1877–1901 (Neural Information Processing Systems, 2020).

Publication types