. 2023 Jun;618(7967):1085-1093.
doi: 10.1038/s41586-023-06169-3. Epub 2023 Jun 7.

Class B1 GPCR activation by an intracellular agonist

Affiliations

Class B1 GPCR activation by an intracellular agonist

Kazuhiro Kobayashi et al. Nature. 2023 Jun.

Abstract

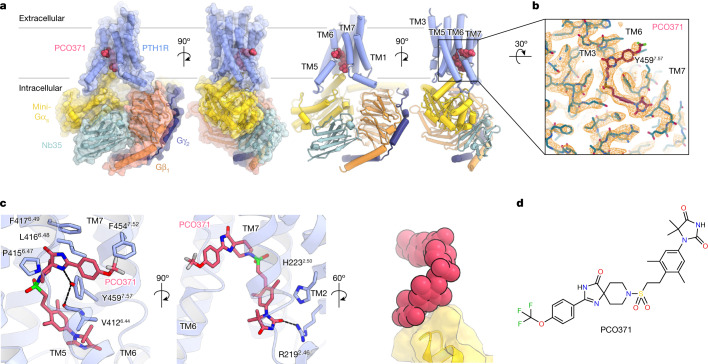
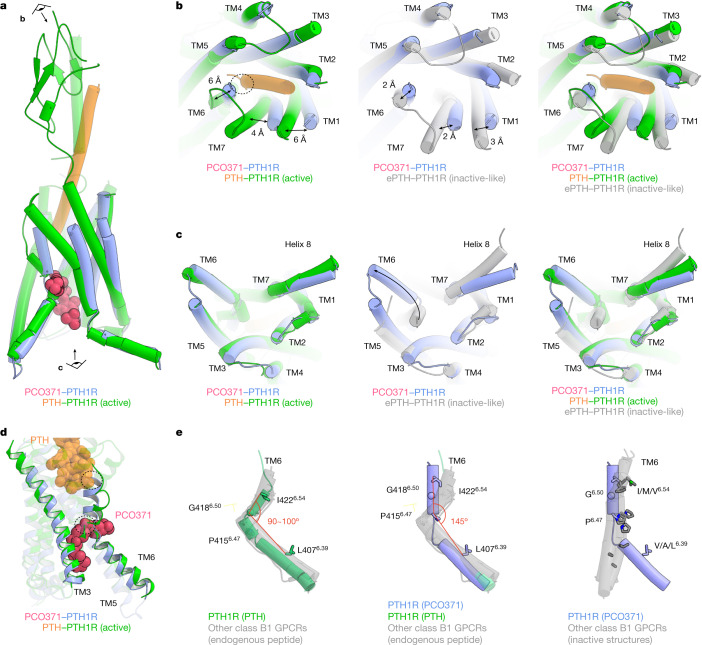
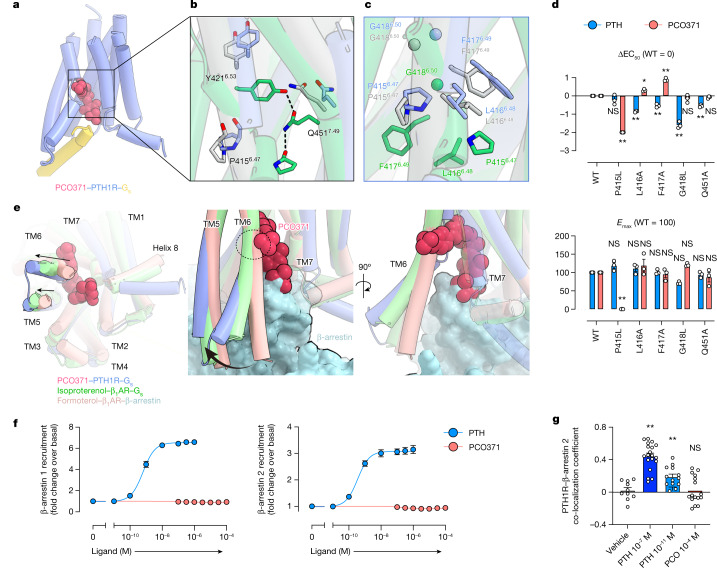
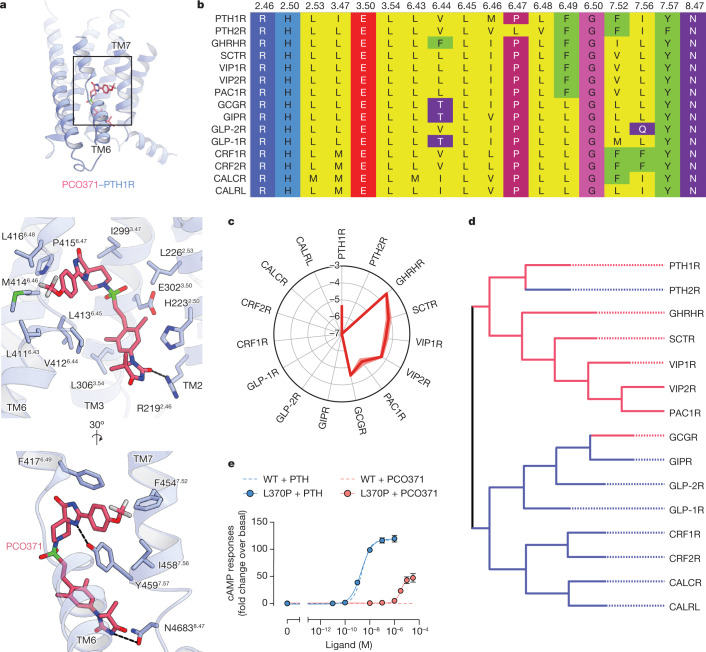
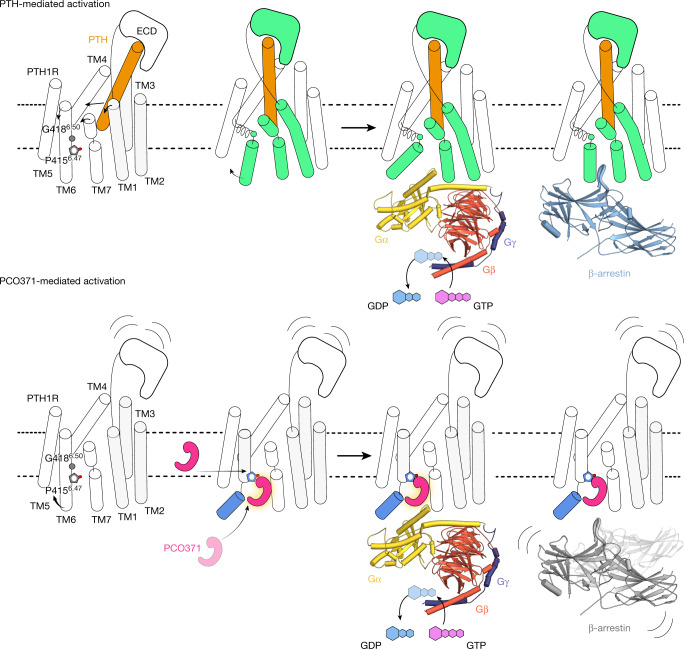
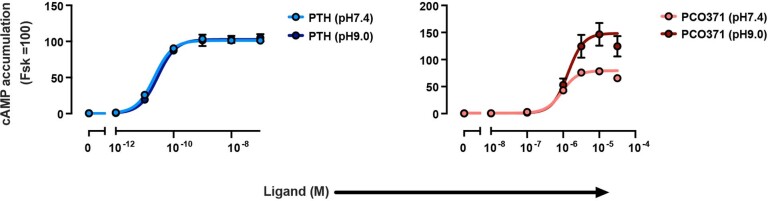
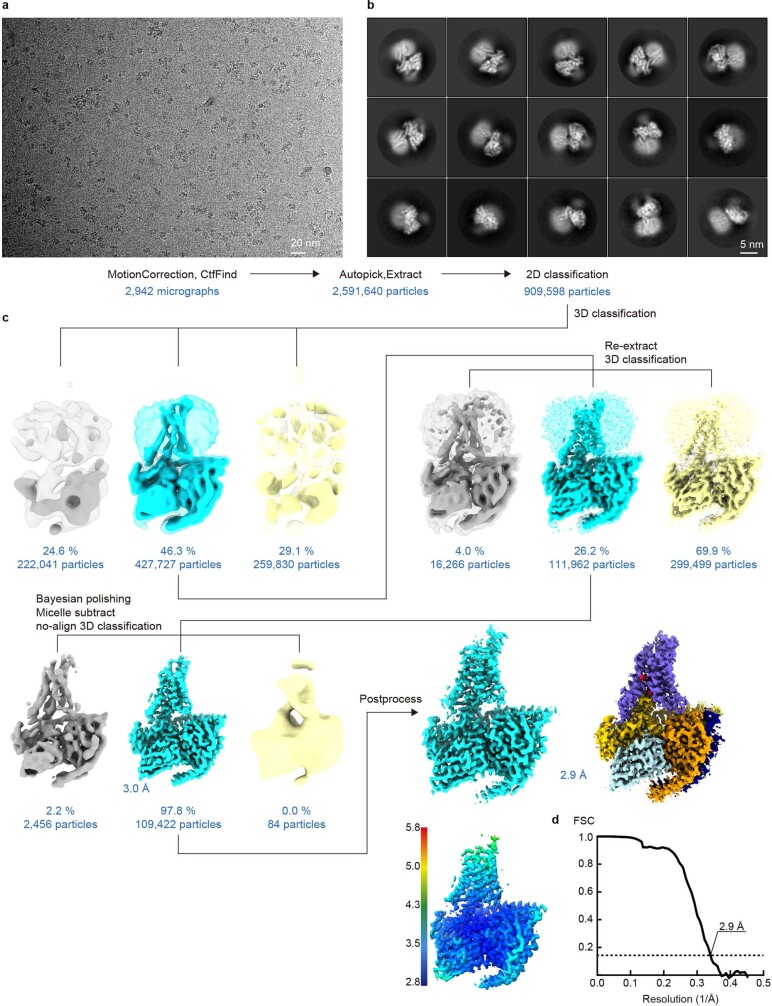
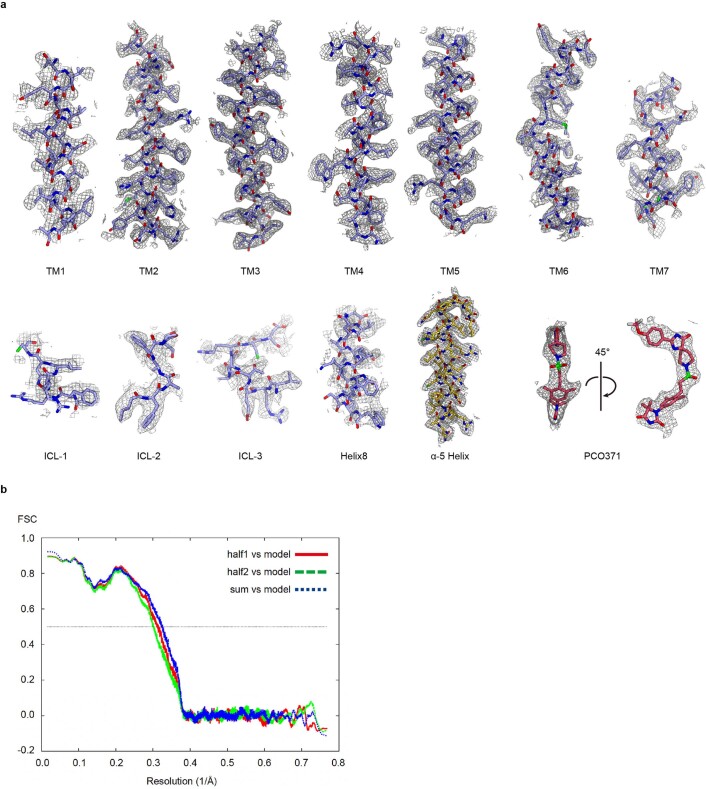
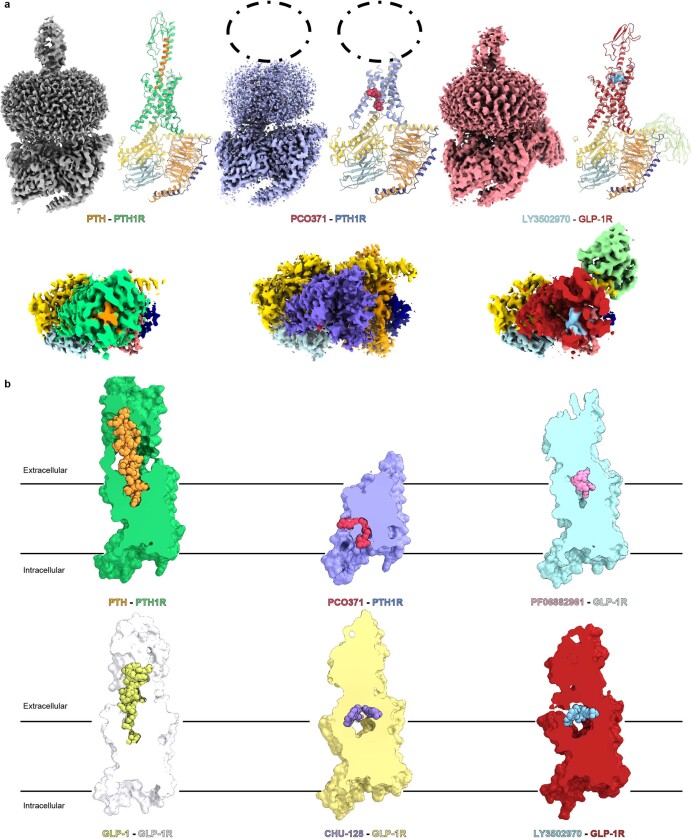
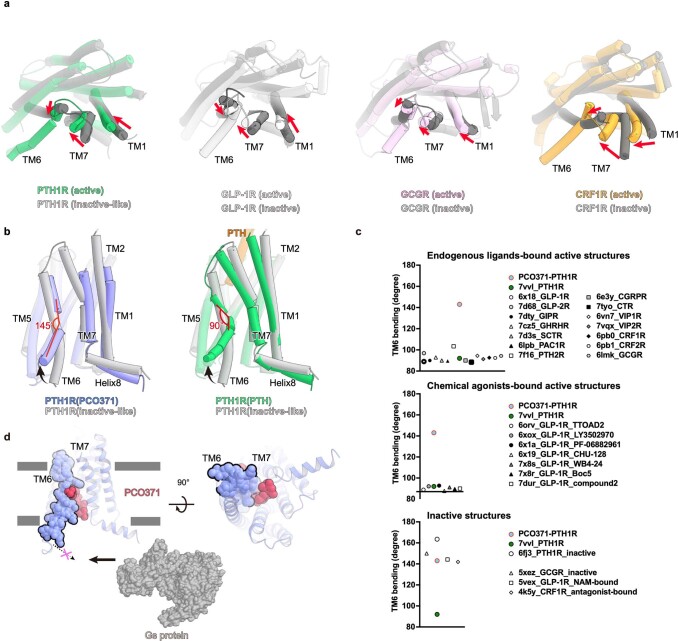
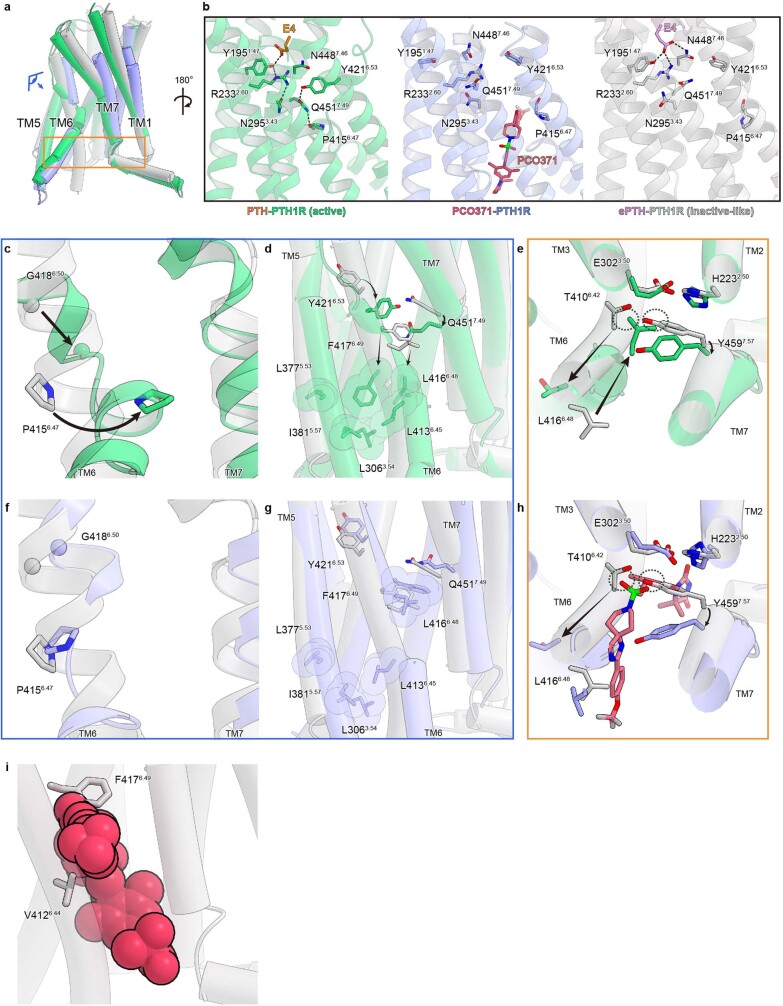
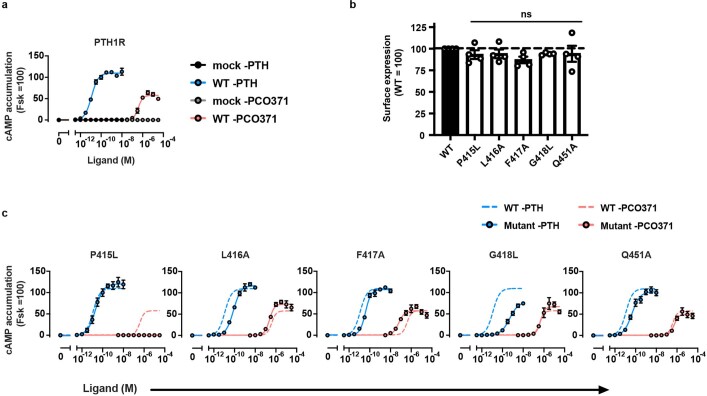
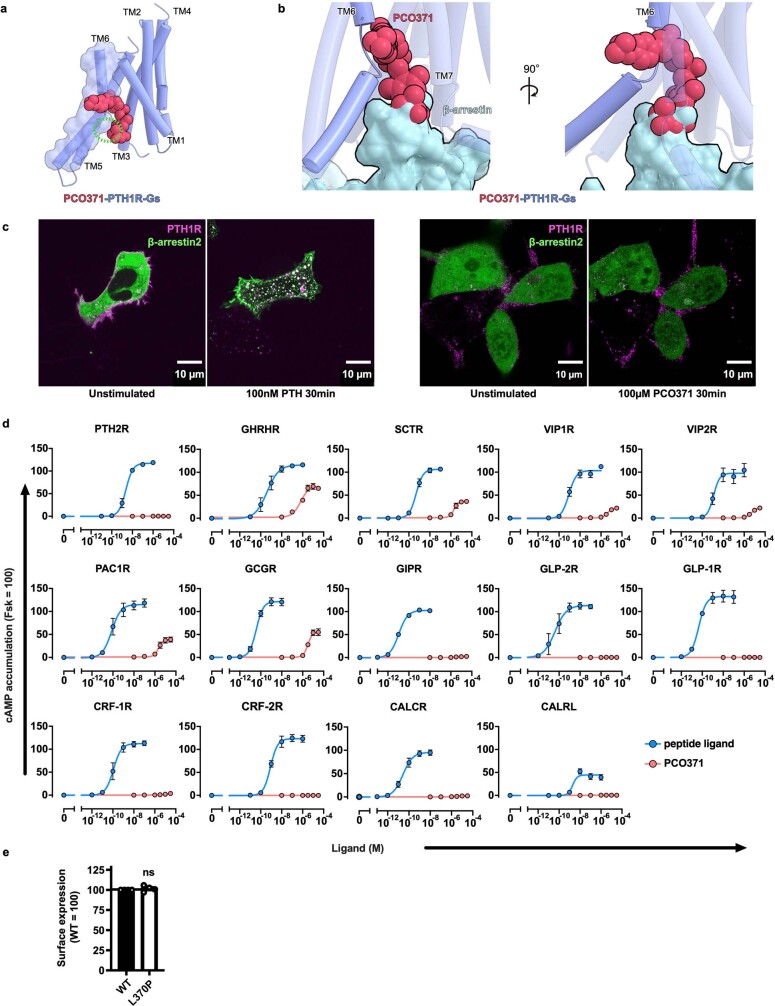
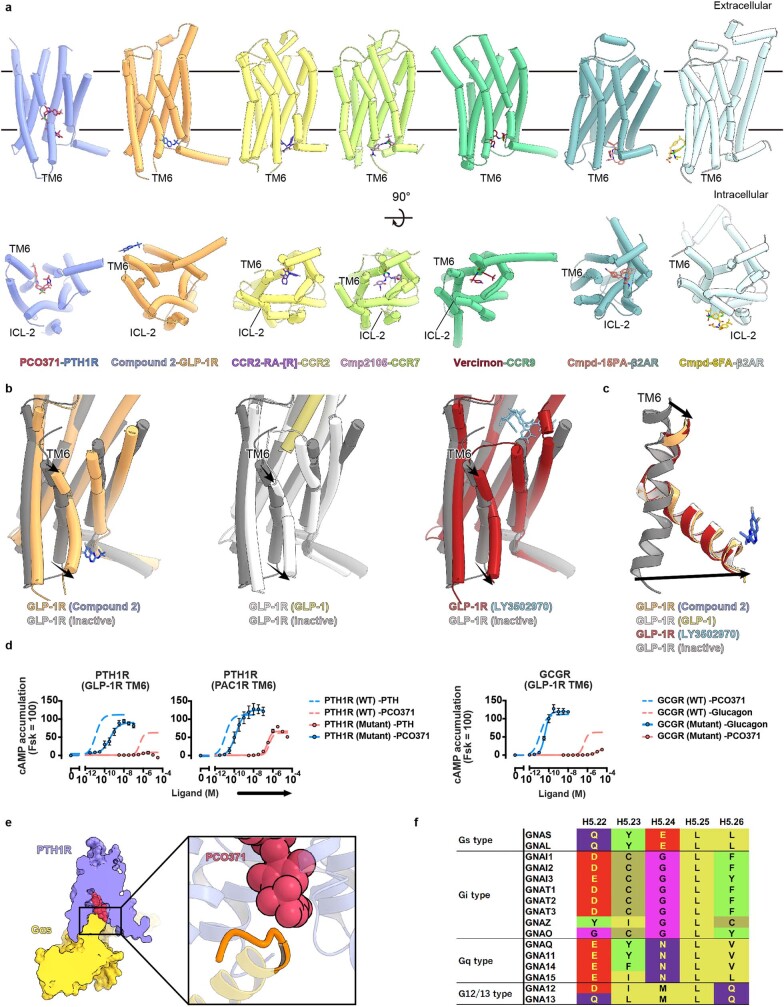
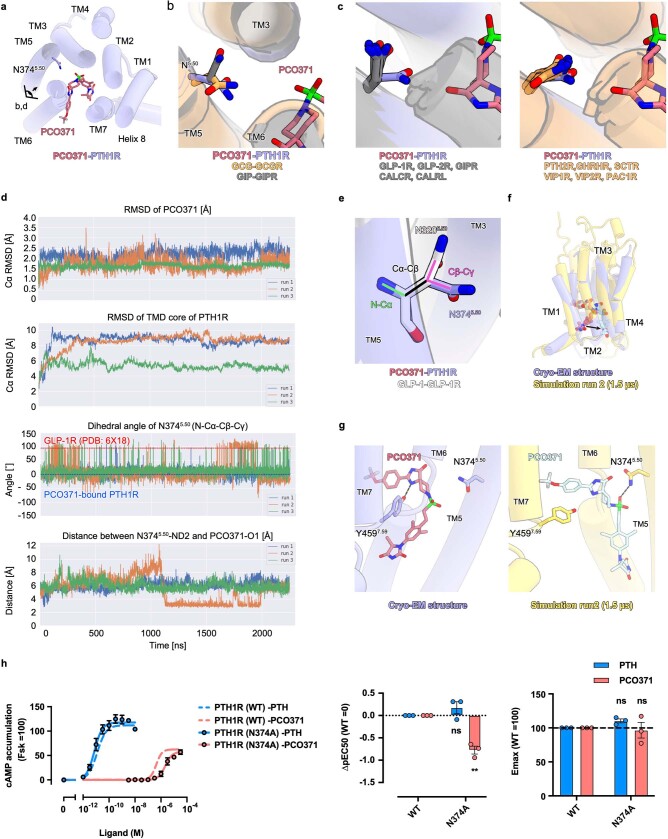
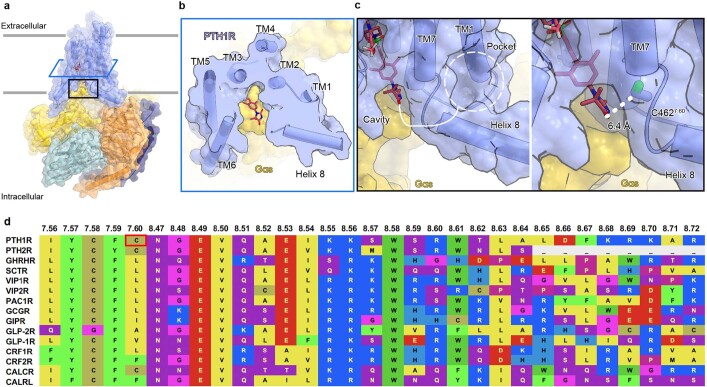
G protein-coupled receptors (GPCRs) generally accommodate specific ligands in the orthosteric-binding pockets. Ligand binding triggers a receptor allosteric conformational change that leads to the activation of intracellular transducers, G proteins and β-arrestins. Because these signals often induce adverse effects, the selective activation mechanism for each transducer must be elucidated. Thus, many orthosteric-biased agonists have been developed, and intracellular-biased agonists have recently attracted broad interest. These agonists bind within the receptor intracellular cavity and preferentially tune the specific signalling pathway over other signalling pathways, without allosteric rearrangement of the receptor from the extracellular side1-3. However, only antagonist-bound structures are currently available1,4-6, and there is no evidence to support that biased agonist binding occurs within the intracellular cavity. This limits the comprehension of intracellular-biased agonism and potential drug development. Here we report the cryogenic electron microscopy structure of a complex of Gs and the human parathyroid hormone type 1 receptor (PTH1R) bound to a PTH1R agonist, PCO371. PCO371 binds within an intracellular pocket of PTH1R and directly interacts with Gs. The PCO371-binding mode rearranges the intracellular region towards the active conformation without extracellularly induced allosteric signal propagation. PCO371 stabilizes the significantly outward-bent conformation of transmembrane helix 6, which facilitates binding to G proteins rather than β-arrestins. Furthermore, PCO371 binds within the highly conserved intracellular pocket, activating 7 out of the 15 class B1 GPCRs. Our study identifies a new and conserved intracellular agonist-binding pocket and provides evidence of a biased signalling mechanism that targets the receptor-transducer interface.


Conflict of interest statement

O.N. is a co-founder and an external director of Curreio Inc. H.N., H.M. and M.S. are employees of Chugai Pharmaceutical. All other authors declare no competing interests.

Figures

Fig. 1
Fig. 1. Overall structure of PCO371–PTH1R–Gs.
a, Orthogonal views of the PCO371–PTH1R–Gs complex, constructed from the cryo-EM potential map and coloured according to the subunit. Violet, PCO371-bound PTH1R; magenta, PCO371; yellow, mini-Gαs Ras-like domain; tomato, Gβ1; navy, Gγ2; powder blue, Nb35. b, Density map and constructed model of PCO371 near the PCO371-binding pocket. c, Close-up view of the PCO371-binding site. Numerical superscripts indicate relative positions in the receptor according to the Wootten class B1 GPCR numbering of the receptor TMD region. The map is shown in the 2.085 e A–3 counter level. d, Chemical structure of PCO371. PCO371 is composed of four chemical groups (shown from left to right): trifluoromethoxyphenyl, spiro-imidazolone, dimethylphenyl and DMH.
Fig. 2
Fig. 2. Comparison of the PCO371-bound PTH1R structure with PTH-bound active PTH1R and ePTH-bound inactive-like PTH1R structures.
a, Superimposition of PCO371–PTH1R–Gs and PTH–PTH1R–Gs (class 2, a representative active form) complexes, aligned on TM2–TM5. The eye and arrow symbols indicate angles of view in b and c. b,c, Extracellular (b) and intracellular (c) views of the superimposed TMDs of PCO371-bound active PTH1R, PTH-bound active PTH1R and ePTH-bound inactive PTH1R. b, Two-way arrows indicate distances of Cα atoms of Thr1921.44 (TM1), Ile4226.54 (TM6) and Met4457.43 (TM7) residues between the structures of PCO371-bound PTH1R and PTH-bound active PTH1R, or between the structures of PCO371-bound and ePTH-bound inactive-like PTH1R. c, The one-way arrow indicates the typical outwards movement of TM6 in PCO371-bound PTH1R and PTH-bound PTH1R. d, Allosteric competitive binding mechanism of PCO371 and PTH. PTH and PCO371 clash at the dashed circles with the other ligand-bound conformation. e, Superimposed structures of PTH-bound PTH1R, PCO371-bound PTH1R, inactive or inactive-like class B1 GPCRs (PTH1R, GCGR, GLP-1R and CRF1R), and all other structures of endogenous agonist-bound class B1 GPCR (PTH2R, SCTR, GHRHR, PAC1R, VIP1R, VIP2R, GCGR, GIPR, GLP-1R, GLP-2R, CALCR, CALRL, CRF1R and CRF2R). The angle is shown among the Cα atoms of Ile/Met/Val6.54, Gly6.50, and Val/Ala/Leu6.39 residues in TM6. Note that the angle of PCO371-bound PTH1R is calculated among Leu6.39, Pro6.47 and Ile6.54 owing to the kink at Pro6.47.
Fig. 3
Fig. 3. Distinct activation mechanism of PTH1R induced by PCO371 and PTH.
a, TMD region of PCO371-bound PTH1R. b,c, Magnified view of the PYQ active motif and PxxG active switch. d, GloSensor cAMP responses in wild-type (WT) PTH1R and the PYQ motif or the PxxG switch mutants following PTH or PCO371 stimulation. The negative logarithmic half-maximal effective concentration (pEC50) and the maximum response (Emax) values were calculated from the concentration–response curves (Extended Data Fig. 7a,c). *P < 0.05 and **P < 0.01, calculated using two-way analysis of variance (ANOVA) followed by Dunnett’s test for multiple comparison analysis (with reference to the WT). NS, not significantly different between the groups. e, Superimposition of PCO371–PTH1R–Gs, isoproterenol–β1 adrenaline receptor (β1AR)–Gs and formoterol–β1AR–β-arrestin complexes, aligned on TM2–TM5. Black arrows indicate the hallmark conformational changes of TM5 and TM6 in Gs-bound and β-arrestin-bound structures (left). PCO371 clashes with TM6 in the dashed circle (centre and right). f, Concentration–response curves of β-arrestin 1 and β-arrestin 2 recruitment to PTH1R following stimulation with PTH or PCO371. g, Co-localization of PTH1R–β-arrestin 2 in response to PCO371 and different concentrations of PTH. Quantification of co-localization of PTH1R and β-arrestin 2 after stimulation with vehicle, 100 nM PTH, 10 pM PTH or 100 µM PCO371. The co-localization index for individual cells in each stimulation condition was calculated using Fiji (ImageJ). Symbols and error bars represent the means and s.e.m., respectively, of 10–19 cells. *P < 0.05 and **P< 0.01, calculated using one-way ANOVA followed by Dunnett’s test for multiple comparison analysis with reference to the vehicle stimulation. Data are from three independent experiments (d,f). Source Data
Fig. 4
Fig. 4. PCO371 activates nearly half of class B1 GPCRs.
a, TMD region of PCO371-bound PTH1R (top) and magnified view of the PCO371-binding region (middle and bottom). b, Amino acid sequence alignment of human class B1 GPCRs. Described residues interact with PCO371. c, PCO371-induced GloSensor cAMP responses among class B1 GPCRs. Values in the radar chart indicate the logarithmic values of relative intrinsic activity (∆log RIAPCO-peptide), which is defined as the Emax/EC50 value (RIAPCO) in each receptor normalized by the Emax/EC50 value following stimulation by its endogenous peptide agonists (RIApeptide). Lines and shaded regions represent the means and s.e.m., respectively, of three independent experiments with each performed in duplicate. Note that in eight PCO371-insensitive GPCRs (PTH2R, GIPR, GLP-2R, GLP-1R, CRF1R, CRF2R, CALCR and CALRL), the RIAPCO values could not be calculated. Therefore the ∆log RIAPCO-peptide values are denoted as less than −7. d, Phylogenetic tree of class B1 GPCRs. PCO371-sensitive and PCO371-insensitive receptors are indicated with red and blue lines, respectively. PCO371 activates members of the PTH1R clade, except PTH2R and GCGR. e, Concentration–response curves of GloSensor cAMP responses of WT and L3706.47P mutant (L370P) PTH2R following stimulation with PTH or PCO371. Symbols and error bars represent the means and s.e.m., respectively, of three independent experiments performed in duplicate.
Fig. 5
Fig. 5. Proposed mechanisms of PCO371-induced activation and signalling compared with known mechanisms of PTH-induced activation and signalling.
The distinct activation and functional selectivity mechanism of PTH1R. Top, PTH induces the rearrangement of the extracellular portions of TM1, TM6 and TM7, which causes the outwards movement of the intracellular portion of TM6 and the formation of a kink at Gly4186.50. PTH-bound PTH1R can adopt preferential conformations for G proteins and β-arrestins, respectively. Bottom, PCO371 directly moves the intracellular portion of TM6 outwards and causes the formation of a moderate kink in TM6 at Pro4156.47 without requiring extracellular rearrangement. PCO371-bound PTH1R solely adopts the preferential conformation for G proteins by stabilizing the outwards conformation of the intracellular portion of TM6. ECD, extracellular domain.
Extended Data Fig. 1
Extended Data Fig. 1. PCO371 and PTH-induced PTH1R activation under two different conditions.
pH sensitivity of the GloSensor cAMP responses of PTH1R upon stimulation with PTH and PCO371. Note that we adjusted the assay buffer (See also Methods) to the indicated pH. Symbols and error bars represent mean and SEM, respectively, of three independent experiments with each performed in duplicate.
Extended Data Fig. 2
Extended Data Fig. 2. Cryo-EM data processing of the PCO371–PTH1R–Gs complex.
(a) Representative micrograph from 6,333 images of PCO371–PTH1R–Gs data set, showing the distribution of PCO371–PTH1R–Gs particles. (b) Representative two-dimensional class averages, indicating secondary structure features. The diameter of the circular windows is 18 nm. (c) Data processing workflow for the PCO371–PTH1R–Gs complex after 3D classification. (d) Gold-standard Fourier shell correlation (FSC) curves, indicating overall global resolution at 2.9 Å.
Extended Data Fig. 3
Extended Data Fig. 3. Model of PCO371–PTH1R–Gs in the cryo-EM density map.
(a) Cryo-EM density maps and models for PTH1R and PCO371. (b) Cross-validation of each refined model using two half maps. Overfitting of refined models was tested with a previously described cross-validation method.
Extended Data Fig. 4
Extended Data Fig. 4. Comparison of the PCO371–PTH1R–Gs structure with the endogenous and chemical agonists-bound PTH1R and GLP-1R structures.
(a) Comparison of the PCO371–PTH1R–Gs complex with endogenous peptide-bound and orthosteric chemical agonist-bound class B1 GPCR complexes. Because there is no structure of orthosteric chemical agonist-bound PTH1R structure, we used LY3502970 (a proprietary GLP-1 receptor agonist)–GLP-1R–Gs to represent the structures of orthosteric chemical agonist-bound class B1 GPCRs. Orthogonal views and models show PTH–PTH1R–Gs (PDB: 7VVL), PCO371–PTH1R–Gs (8GW8), and LY3502970–GLP-1R–Gs (PDB: 6XOX). Green, PTH-bound PTH1R; orange, PTH; yellow, mini-Gs Ras-like domain; tomato, Gβ1; navy, Gγ2; powder blue, Nb35; violet, PCO371-bound PTH1R; crimson, LY3502970-bound GLP-1R; sky blue, LY3502970. Gray, PTH–PTH1R–Gs; violet, PCO371–PTH1R–Gs; red, LY3502970–GLP-1R–Gs. The PCO371-bound PTH1R map shows no obvious ligand-like density in the orthosteric pocket, in contrast to the PTH-bound PTH1R and LY3502970-bound GLP-1R maps. (b) Cut-through views of endogenous peptide-bound PTH1R and GLP-1R structures and chemical agonist-bound GLP-1R structures. Green, PTH-bound PTH1R; orange, PTH; white, GLP-1R; yellow-green, GLP-1; violet, PCO371-bound PTH1R; crimson, PCO371; yellow, CHU-128-bound GLP-1R; blue-violet, CHU-128; purple, danuglipron (PF-06882961)-bound GLP-1R; khaki, PF-06882961; red, LY3502970-bound GLP-1R; sky blue, LY3502970. Only PCO371 binds within the intracellular cavity, whereas other agonists bind in various ways to the orthosteric pocket.
Extended Data Fig. 5
Extended Data Fig. 5. Comparison of the PCO371-bound PTH1R conformation with other class B1 GPCR structures.
(a) Four active class B1 GPCRs (green, PTH1R; white, GLP-1R; pink, glucagon receptor [GCGR]; purple, corticotropin releasing factor receptor 1 [CRF1R]) are superimposed onto inactive or inactive-like structures. (b) PTH-bound PTH1R and PCO371-bound PTH1R are superimposed onto the ePTH-bound inactive-like PTH1R structure (green, PTH-bound PTH1R; orange, PTH; violet, PCO371-bound PTH1R; magenta, PCO371; gray, ePTH-bound PTH1R). PCO371-bound PTH1R exhibited the moderate kink in TM6 (approximately 145°), whereas PTH-bound PTH1R exhibited the typical sharp kink in TM6 (approximately 90°). (c) TM6 angle consisting of the three Cα atoms of the I/M/V6.39, G6.50, and A/V/L6.54 residues. (d) PCO371 directly stabilizes the intracellular half of TM6 in the outward conformation, which increases the volume in the inner cavity and activates the Gs protein.
Extended Data Fig. 6
Extended Data Fig. 6. Comparison of the PxxG switch and the HETY inactive motif between PCO371-bound and PTH-bound PTH1R.
(a) TMD region of the PCO371-bound PTH1R. The eye and square indicate views in (c–h). (b) Central polar networks of bound PTH-bound active PTH1R (left, violet), PCO371- PTH1R (center, green), and ePTH-bound inactive PTH1R (right, gray). (c–h) Superimposed structures of PTH-bound PTH1R (green), PCO371-PTH1R (violet), and ePTH-bound PTH1R (gray) are shown parallel to the membrane. Magnified views of the PYQ active motif and the PxxG active switch (c–d and f–g). Magnified views of the HETY inactive motif (e and h). (i) Superimposed structures of PCO371 (crimson) and ePTH-bound PTH1R.
Extended Data Fig. 7
Extended Data Fig. 7. GloSensor cAMP responses and surface expression of wild-type and mutant PTH1R.
Related to Fig. 3d. (a–c) PTH1R-induced Gs activation measured by the GloSensor cAMP accumulation assay and cell surface expression of WT and mutant PTH1R assessed by the flow cytometry analysis. (a) Concentration-response curves of the GloSensor cAMP response in WT PTH1R- or mock-transfected cells upon PTH or PCO371 stimulation. Symbols and error bars represent mean and SEM, respectively, of three independent experiments with each performed in duplicate. (b) Cell surface expression. Symbols and error bars represent mean and SEM, respectively, and dots show individual data of four independent experiments, with each performed in duplicate. Statistical analysis was performed by one-way ANOVA followed by Dunnett’s test for multiple comparison analysis (with reference to the WT). ns, not significantly different between the groups. (c) Concentration-response curves of GloSensor cAMP response of WT (dashed lines) and the mutant (solid lines) PTH1R upon PTH (blue) or PCO371 (red) stimulation. Symbols and error bars represent mean and SEM, respectively, of three independent experiments with each performed in duplicate.
Extended Data Fig. 8
Extended Data Fig. 8. PCO371-induced activation of class B1 GPCRs.
(a) The TMD structures of PCO371-bound PTH1R (violet) and PCO371 (crimson) are shown parallel to the membrane. (b) Superimposed structures of PCO371–PTH1R–Gs and formoterol–β1AR–β-arrestin complexes, aligned on TMs 2-5. PCO371 facilitates the outward conformation of the intracellular portion of TM6 and clashes with β-arrestin. (c) Representative images of the cellular localization of Alexa-647-labeled PTH1R (magenta) and mVenus-fused β-arrestin 2 (green), related to Fig. 3g. These images obtained from 10-19 images of these experiments. (d) Concentration-response curves of the GloSensor cAMP response of 15 class B1 GPCRs upon endogenous peptide agonist (blue) or PCO371 (red) stimulation. The following endogenous peptide agonists were used for each GPCR; PTH (1–34), PTH2R: Growth hormone-releasing hormone, GHRHR; Secretin, SCTR; Pituitary Adenylate Cyclase Activating Polypeptide (PACAP, 1–27), VIP1R and VIP2R; PACAP (1–38), PAC1R; Glucagon, GCGR; Gastric Inhibitory Polypeptide, GIPR; Glucagon-like Peptide 2, GLP-2R; Glucagon-like Peptide 1, GLP-1R; Corticotropin Releasing Factor, CRF1R and CRF2R; Calcitonin, CALCR; Calcitonin Gene Related Peptide, CALRL. All peptides are human-derived sequence. Symbols and error bars represent mean and SEM, respectively, of three independent experiments with each performed in duplicate. (e) Cell surface expression of WT and mutant PTH2R assessed by the flow cytometry analysis. Symbols and error bars represent mean and SEM, respectively, and dots show individual data of four independent experiments, with each performed in duplicate. Statistical analysis was performed by two-tailed t-test. ns, not significantly different between the groups.
Extended Data Fig. 9
Extended Data Fig. 9. Structural comparison of PCO371-bound PTH1R and the other intracellular ligands-bound GPCR structures.
(a) TMD structures of PCO371-bound PTH1R and six intracellular ligand-bound GPCRs are shown parallel to the membrane or from the intracellular side. Violet, PCO371-bound PTH1R; magenta, PCO371; orange, compound 2-bound GLP-1R; blue, compound 2, yellow, C-C motif chemokine receptor (CCR2)-RA-[R]-bound CCR2; violet, CCR2-RA-[R]; yellow-green, cmpd2105-bound CCR7; plum, cmpd2105; green, vercirnon-bound CCR6; brown, vercirnon; powder blue, cmpd-15PA-bound β2AR; coral, cmpd-15PA; light cyan, cmpd-6FA-bound β2AR; gold, cmpd-6FA. (b, c) Superimposed structures of compound2-bound GLP-1R, GLP-1-bound GLP-1R, LY3502970-bound GLP-1R, and inactive GLP-1R. White, GLP-1-bound GLP-1R; khaki, GLP-1; red, LY3502970 -bound GLP-1R; sky blue, LY3502970; gray, inactive GLP-1R. Compound2 binds with the intracellular portion of TM6, and compound2-bound GLP-1R exhibits the identical active conformation of TM6. (d) GloSensor cAMP responses in wild-type (WT) PTH1R and the TM6-replaced mutants upon endogenous agonists (PTH or glucagon) or PCO371 stimulation. Symbols and error bars represent mean and SEM, respectively, of three independent experiments with each performed in duplicate. (e) Cut-through view of PCO371–PTH1R–Gs and magnified view of the PCO371-G-protein interface. The PCO371-interacting Gαs region is colored orange. (f) Sequence alignment of the C-terminal hook of Gα proteins.
Extended Data Fig. 10
Extended Data Fig. 10. MD simulation from the PCO371-bound PTH1R.
(a) A cross-section view of the PCO371-bound PTH1R. (b) A magnified view of the superimposed structure of PCO371-bound PTH1R (purple), GCG-bound GCGR (orange), and GIP-bound GIPR (gray). (c) Structural comparison of N5.50 of PCO371-insensitive receptors and PCO371-sensitive receptors, related to Fig. 4d. Violet, PCO371-bound PTH1R; gray, PCO371-insensitive receptors; orange, PCO371-sensitive receptors. (d) Trajectory analysis of three independent simulations with PCO371-bound PTH1R. The top two panels show that PCO371-bound PTH1R maintains an active conformation, resembling our cryo-EM structure. The panel second from the bottom shows the dihedral angle of N3745.50. The angles of PCO371-bound PTH1R (blue) and GLP-1R (red) are shown as dash lines. The bottom panel shows the distance between N3745.50-ND2 and PCO371-O1, representing stably PCO371 interaction with N3745.50 in an intermediate state. (e) Distinct conformation of N3745.50 between PCO371-bound PTH1R and GLP-1-bound active GLP-1R (PDB ID: 6X18). The dihedral angle is calculated with the N–Cα and Cβ–Cγ angles of N5.50. (f) Superimposition of our cryo-EM structure (violet) and a representative snapshot of 1.5 µs MD simulation in run 2 of PCO371-bound PTH1R (yellow). In the simulation, the receptor adopted an intermediate structure, and PCO371 moved toward TM5. (g) Comparison of our cryo-EM structure (violet) and an intermediate structure (yellow) observed in the simulation. PCO371 does not interact with N3745.50 in our cryo-EM structure, while it creates a stable interaction with N3745.50 in the simulation. (h) cAMP accumulation of WT and N3745.50A mutant with PTH and PCO371. The N3745.50A mutant selectively reduced PCO371 response. Symbols and error bars represent mean and SEM, respectively, and dots show individual data of three independent experiments, with each performed in duplicate. * and ** represent P < 0.05 and 0.01, respectively, with two-way ANOVA followed by Dunnett’s test for multiple comparison analysis. ns, not significantly different between the groups.
Extended Data Fig. 11
Extended Data Fig. 11. Proposed strategy for a G-protein subtype specific or bitopic agonist.
(a) TMD structures of PCO371–PTH1R–Gs are shown parallel to the membrane. (b, c) Cross-section and magnified views of the TMD. The white dashed circle shows an intracellular ligand binding pocket comprising TM1, TM7, and Helix8 (left panel). The white dashed line shows the distance between Cβ of Cys7.60 and O6 of PCO371. (d) Sequence alignment of the C-terminal region after TM7. The red box shows C4627.60 of PTH1R.

References

    1. Oswald C, et al. Intracellular allosteric antagonism of the CCR9 receptor. Nature. 2016;540:462–465. doi: 10.1038/nature20606. - DOI - PubMed
    1. Ortiz Zacarías NV, Lenselink EB, IJzerman AP, Handel TM, Heitman LH. Intracellular receptor modulation: novel approach to target GPCRs. Trends Pharmacol. Sci. 2018;39:547–559. doi: 10.1016/j.tips.2018.03.002. - DOI - PMC - PubMed
    1. Staus DP, et al. Regulation of β2-adrenergic receptor function by conformationally selective single-domain intrabodies. Mol. Pharmacol. 2014;85:472–481. doi: 10.1124/mol.113.089516. - DOI - PMC - PubMed
    1. Liu X, et al. Mechanism of intracellular allosteric β2 AR antagonist revealed by X-ray crystal structure. Nature. 2017;548:480–484. doi: 10.1038/nature23652. - DOI - PMC - PubMed
    1. Jaeger K, et al. Structural basis for allosteric ligand recognition in the human CC chemokine receptor 7. Cell. 2019;178:1222–1230.e10. doi: 10.1016/j.cell.2019.07.028. - DOI - PMC - PubMed

Publication types

MeSH terms

LinkOut - more resources