

Comment
doi: 10.1038/s41586-023-06066-9.
Epub 2023 Jun 7.
Ptbp1 deletion does not induce astrocyte-to-neuron conversion
Affiliations
- PMID: 37286658
- PMCID: PMC12327411
- DOI: 10.1038/s41586-023-06066-9
Item in Clipboard
Comment
Ptbp1 deletion does not induce astrocyte-to-neuron conversion
Nature.
2023 Jun.
No abstract available
Conflict of interest statement
Figures

a, Schematic of the experimental timeline for 6-OHDA-induced lesion of dopaminergic neurons, followed by tamoxifen-induced specific deletion of Ptbp1 and lineage tracing of astrocytes. b, Unilateral loss of Th-positive cells in the striatum and midbrain following 6-OHDA lesion. c, Representative immunostaining images of TH and GFP in the striatum and substantia nigra in an intact and lesioned area following 6-OHDA-induced lesion across genotypes. No TH/GFP-double-positive cells were observed in any of the brain regions across genotypes. Note that TH immunostaining signals are only present in non-cell bodies in the striatum (n > = 3 mice/genotype). Scale bars = 50 μm.

a, Low magnification images of GFP mRNA and DAPI in Ptbp1 KO brain sections (n > = 3 mice/genotype). b, Low magnification images of Otx2 mRNA and DAPI in Ptbp1 KO brain section. c,d, High magnification images of GFP and Otx2 mRNA across genotypes. Scale bars = 50 μm.

Violin plots showing expression of neurogenic and cluster-enriched genes in all collected cells in the cortex (a), striatum (b) and substantia nigra (c) across genotypes. Note that Neurog2 and Neurod1 were not detected in the striatum and substantia nigra scRNA-Seq dataset. The drawings of coronal sections were created using BioRender (https://www.biorender.com/ ).

a, Schematic of the generation of specific deletion of Ptbp1 and lineage tracing of astrocytes, and the experimental timelines. Ptbp1 Ctrl, control (wild-type Ptbp1 expression); Ptbp1 HET, heterozygous Ptbp1 expression; Ptbp1 KO, homozygous Ptbp1 knockout. b, Quantification of the percentage of PTBP1+GFP+ double-positive cells showing a highly efficient Ptbp1 deletion in all three brain regions (cortex, striatum and substantia nigra). Data points represent the number of mice; n ≥ 3 mice per genotype. Data are mean ± s.e.m. Statistical analysis was performed using t-tests; *P < 0.05. c, Representative PTBP1 and GFP immunostaining images of the cortex at 8 weeks after intraperitoneal injection of 4-OHT (n ≥ 3 mice per genotype). The yellow arrows indicate PTBP1+GFP+ double-positive cells. The white arrowheads indicate PTBP1−GFP+ cells. d–f, Representative immunostaining images of HuC/D;NeuN and GFP in the cortex (d), striatum (e) and substantia nigra (f) at 8 weeks after intraperitoneal injection of 4-OHT (n ≥ 3 mice per genotype). No HuC/D;NeuN+GFP+ double-positive cells were observed in any of the three brain regions across all three genotypes. g, Representative immunostaining images of TH and GFP in the substantia nigra at 8 weeks after intraperitoneal injection of 4-OHT. No TH+GFP+ double-positive cells were observed in the substantia nigra in all three genotypes. n ≥ 3 mice per genotype. Scale bars, 50 μm. The schematic in a and the drawings of coronal sections in d–g were created using BioRender (https://www.biorender.com/ ).
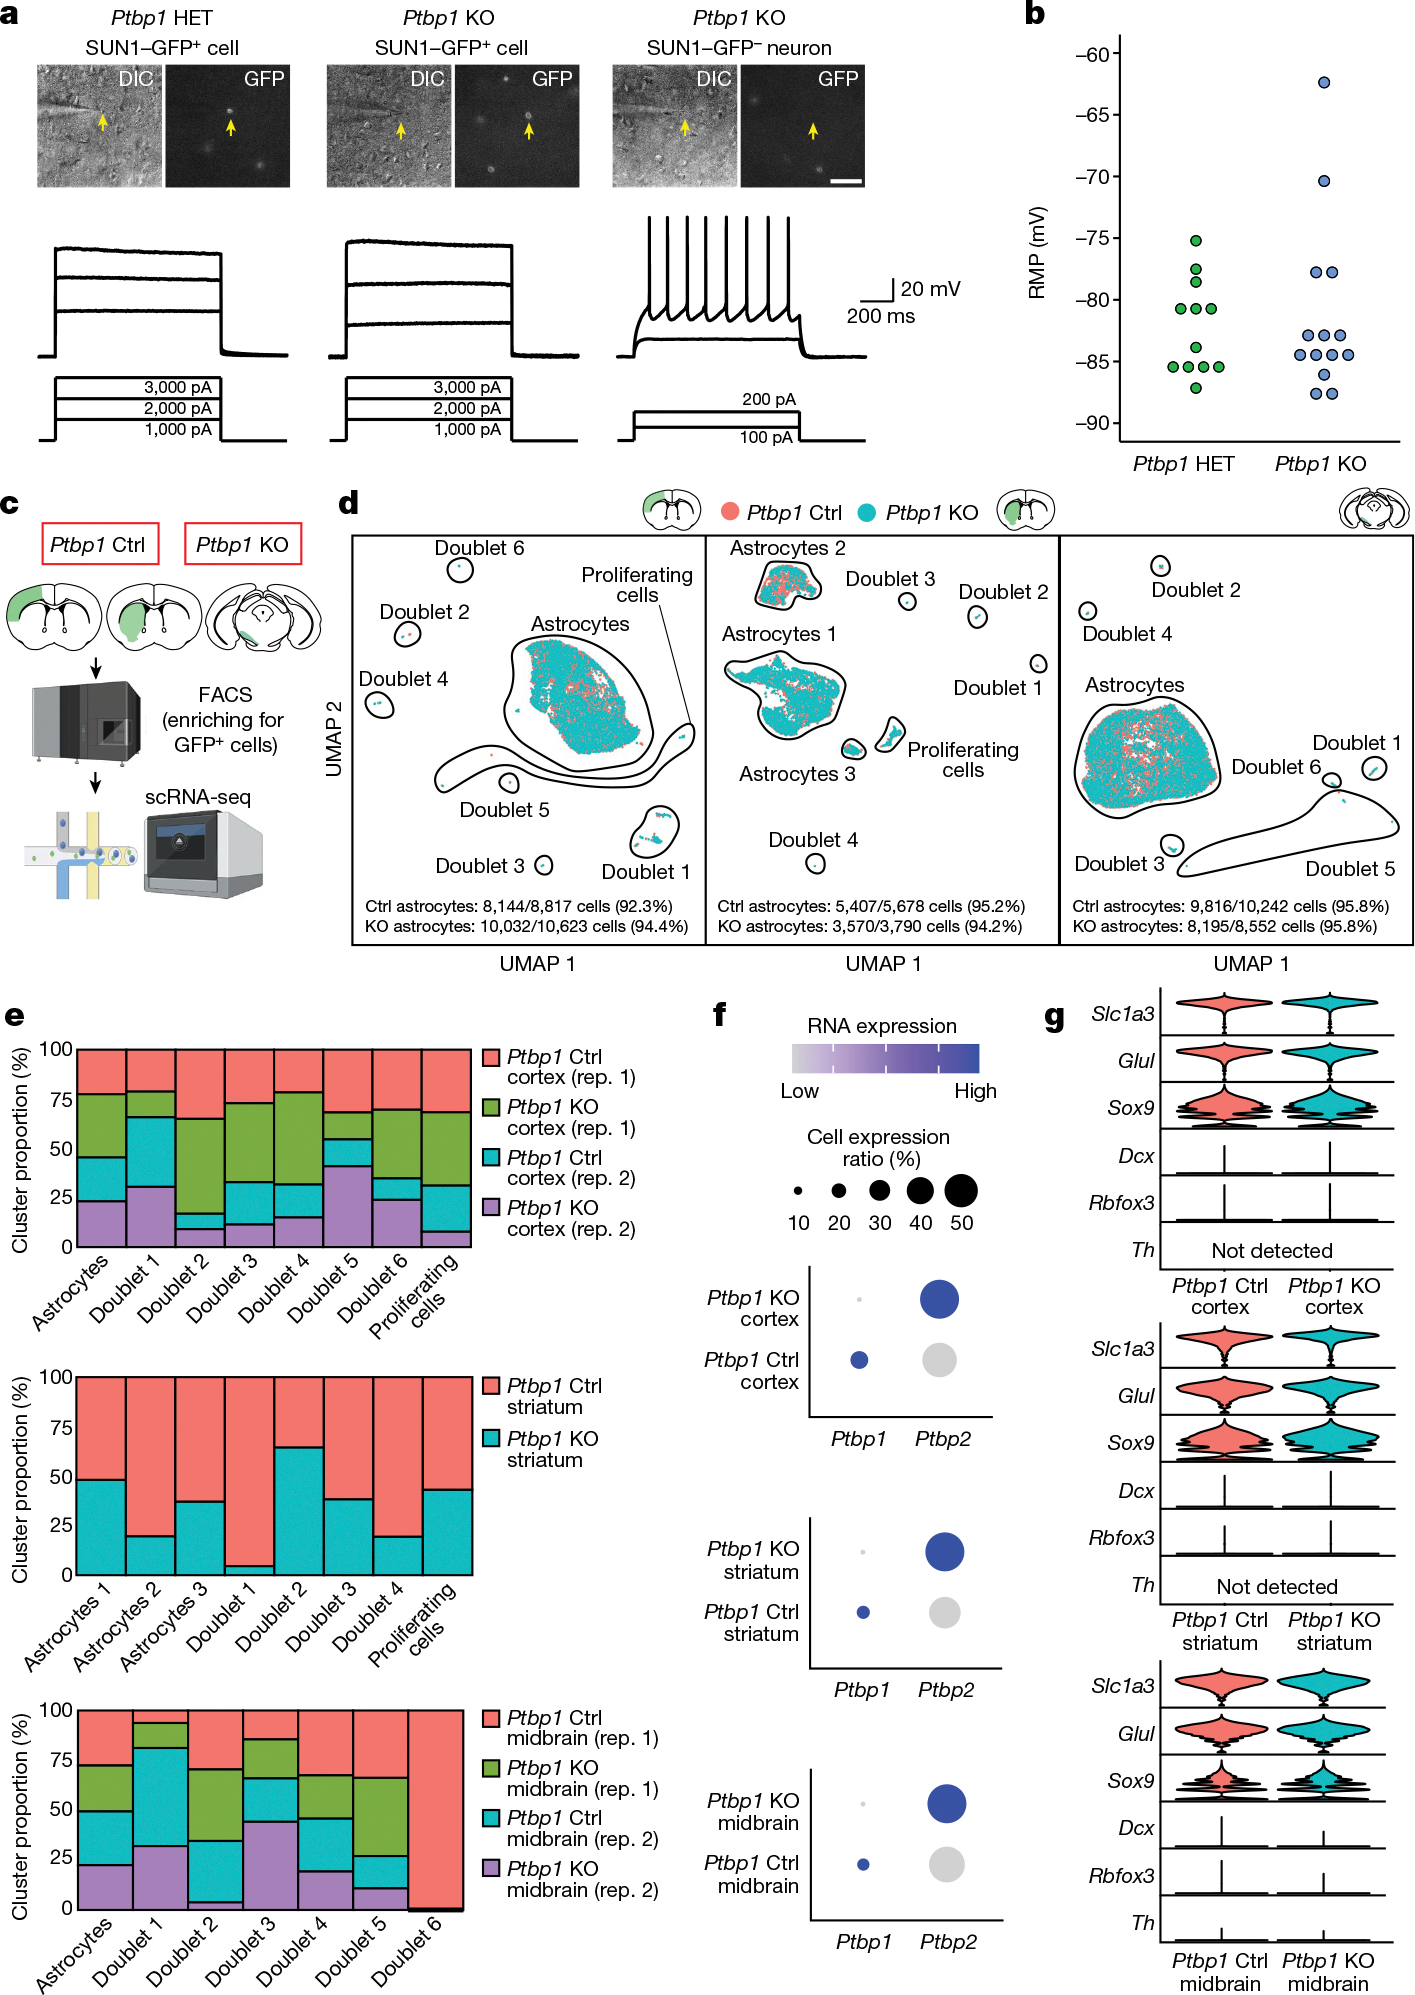
a, Representative cell images and voltage traces to the depolarizing current steps of a GFP+ cell from Ptbp1-heterozygous (left) and Ptbp1-homozygous (middle) mice and a GFP− neuron from a Ptbp1-homozygous mouse (right). The yellow arrows indicate the location of the recorded cells in differential interference contrast (DIC) and fluorescence images. Scale bar, 40 μm. b, A summary graph for resting membrane potential (RMP) recordings of the GFP+ cells. n = 12 cells from 3 mice (Ptbp1 HET); n = 14 cells from 3 mice (Ptbp1 KO). c, Schematic of the scRNA-seq analysis of GFP+ cells from Aldh1l1creERT2;Sun1-GFPloxP/loxP;Ptbp1+/+ (Ptbp1 Ctrl) and Aldh1l1creERT2; Sun1-GFPloxP/loxP;Ptbp1loxP/loxP (Ptbp1 KO) mice isolated by FACS from the brain. d, Uniform manifold approximation and projection (UMAP) plot showing astrocytes and a small fraction of doublet cells collected during FACS in the cortex (left), striatum (middle) and substantia nigra (right) of all of the genotypes. Note that there are no distinct astrocyte clusters present in only the Ptbp1-KO samples. e, The distribution of scRNA-seq clusters across genotypes and brain regions. f, Dot plots showing a decrease in Ptbp1 and an increase in Ptbp2 mRNA expression in astrocytes across genotypes and brain regions. g, Expression of astrocyte-enriched genes (Slc1a3, Glul and Sox9) and neuronal genes (Dcx, Rbfox3 and Th) in all collected cells in d across genotypes. Midbrain, substantia nigra in the midbrain. The schematic in c and the drawings of coronal sections in c and d were created using BioRender (https://www.biorender.com/ ).
Comment in
-
Reply to: Ptbp1 deletion does not induce astrocyte-to-neuron conversion.Nature. 2023 Jun;618(7964):E8-E13. doi: 10.1038/s41586-023-06067-8. Nature. 2023. PMID: 37286647 No abstract available.
Comment on
-
Reversing a model of Parkinson's disease with in situ converted nigral neurons.Nature. 2020 Jun;582(7813):550-556. doi: 10.1038/s41586-020-2388-4. Epub 2020 Jun 24. Nature. 2020. PMID: 32581380 Free PMC article.
References
-
- Su M et al. Expression specificity of GFAP transgenes. Neurochem. Res. 29, 2075–2093 (2004). - PubMed
Publication types
MeSH terms
Grants and funding
LinkOut - more resources
Full Text Sources
Medical
