. 2023 Oct;33(10):762-774.
doi: 10.1038/s41422-023-00830-2. Epub 2023 Jun 8.

Structural insights into dimerization and activation of the mGlu2-mGlu3 and mGlu2-mGlu4 heterodimers

Affiliations

Structural insights into dimerization and activation of the mGlu2-mGlu3 and mGlu2-mGlu4 heterodimers

Xinwei Wang et al. Cell Res. 2023 Oct.

Abstract

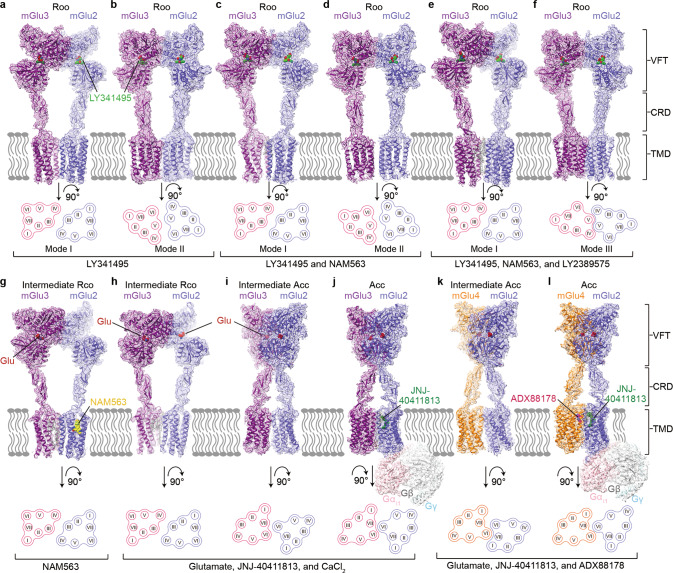
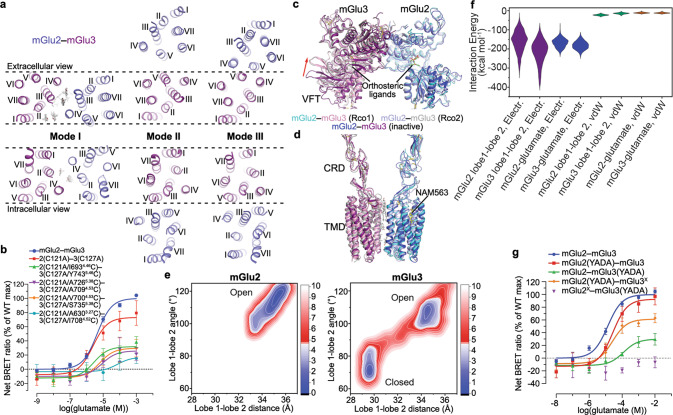
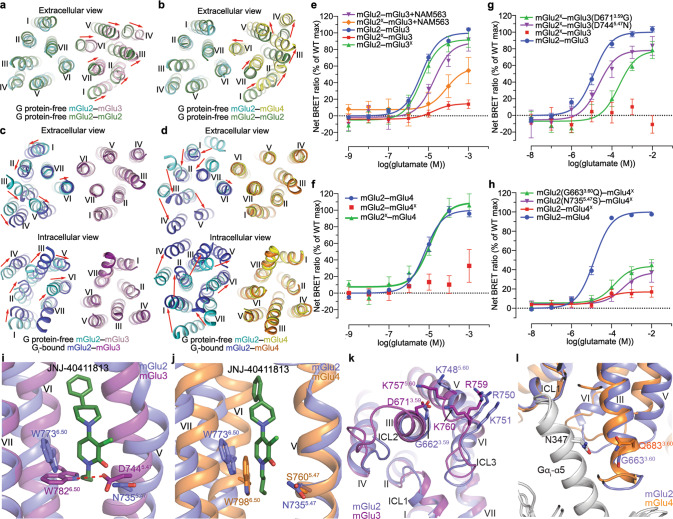
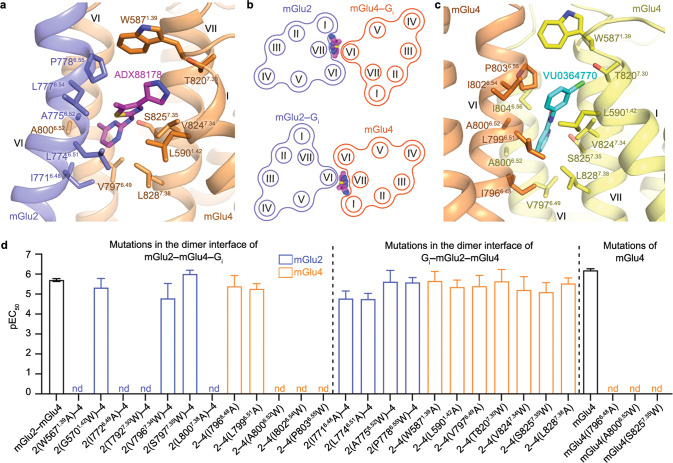
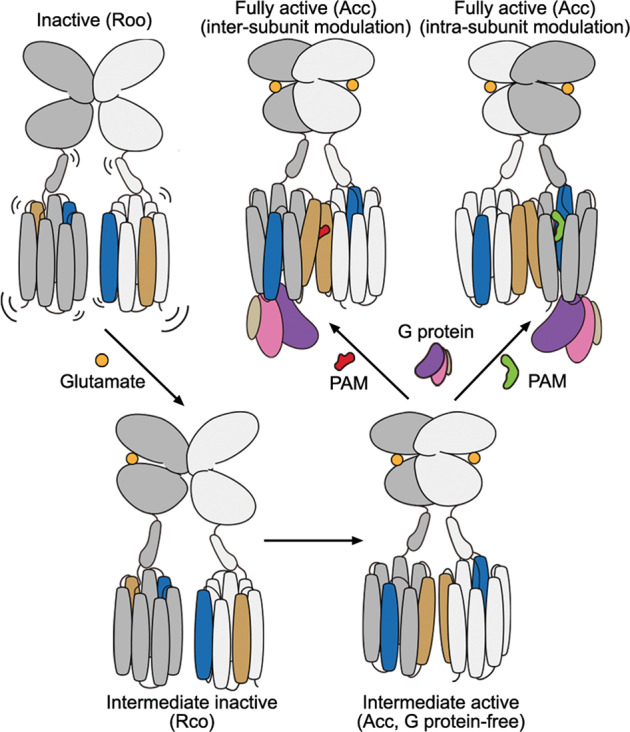
Heterodimerization of the metabotropic glutamate receptors (mGlus) has shown importance in the functional modulation of the receptors and offers potential drug targets for treating central nervous system diseases. However, due to a lack of molecular details of the mGlu heterodimers, understanding of the mechanisms underlying mGlu heterodimerization and activation is limited. Here we report twelve cryo-electron microscopy (cryo-EM) structures of the mGlu2-mGlu3 and mGlu2-mGlu4 heterodimers in different conformational states, including inactive, intermediate inactive, intermediate active and fully active conformations. These structures provide a full picture of conformational rearrangement of mGlu2-mGlu3 upon activation. The Venus flytrap domains undergo a sequential conformational change, while the transmembrane domains exhibit a substantial rearrangement from an inactive, symmetric dimer with diverse dimerization patterns to an active, asymmetric dimer in a conserved dimerization mode. Combined with functional data, these structures reveal that stability of the inactive conformations of the subunits and the subunit-G protein interaction pattern are determinants of asymmetric signal transduction of the heterodimers. Furthermore, a novel binding site for two mGlu4 positive allosteric modulators was observed in the asymmetric dimer interfaces of the mGlu2-mGlu4 heterodimer and mGlu4 homodimer, and may serve as a drug recognition site. These findings greatly extend our knowledge about signal transduction of the mGlus.


Conflict of interest statement

The authors declare no competing interests.

Figures

Fig. 1
Fig. 1. Cryo-EM maps and overall structures of the mGlu2–mGlu3 and mGlu2–mGlu4 heterodimers.
The maps and structures are colored according to chains. The mGlu2, mGlu3, and mGlu4 subunits are colored blue, purple, and orange, respectively. Schematic diagrams showing the extracellular view of the TMDs are shown below. The conformational states are labeled on the top, and the ligands used during protein preparation are listed at the bottom. af The antagonist-bound mGlu2–mGlu3. The antagonist LY341495 is shown as spheres with green carbons. The lipid molecules are shown as gray sticks. a, b The mGlu2–mGlu3 heterodimer in the presence of LY341495 in dimerization modes I (a) and II (b). c, d The mGlu2–mGlu3 heterodimer in the presence of LY341495 and NAM563 in dimerization modes I (c) and II (d). e, f The mGlu2–mGlu3 heterodimer in the presence of LY341495, NAM563, and LY2389575 in dimerization modes I (e) and III (f). gl The agonist-bound mGlu2–mGlu3 and mGlu2–mGlu4. The agonist glutamate (Glu) is shown as spheres with red carbons. g The mGlu2–mGlu3 heterodimer in the presence of NAM563 in the intermediate Rco state. h, i The mGlu2–mGlu3 heterodimer in the presence of glutamate, JNJ-40411813, and CaCl2 in the intermediate Rco (h) and intermediate Acc (i) states. j The Gi1-bound mGlu2–mGlu3 heterodimer. JNJ-40411813 is shown as spheres with dark green carbons. k The G protein-free mGlu2–mGlu4 heterodimer in the presence of glutamate, JNJ-40411813, and ADX88178. l The Gi1-bound mGlu2–mGlu4 heterodimer. ADX88178 is shown as spheres with magenta carbons.
Fig. 2
Fig. 2. Inactive dimerization modes and Rco conformations of mGlu2–mGlu3.
a Comparison of the dimerization modes in the inactive mGlu2–mGlu3. The TMDs of the inactive mGlu2–mGlu3 in dimerization modes I, II, and III are shown in both extracellular (top) and intracellular (bottom) views. The mGlu2 and mGlu3 subunits are colored blue and purple, respectively. The lipids in dimerization mode I are shown as gray sticks. The dashed lines indicate that the mGlu3 subunits in the structures are in the same orientation. b, g Glutamate-induced Gi activation of the wild type and mutants of mGlu2–mGlu3 measured by the BRET assay. The BRET data are means ± SEM from at least three independent experiments performed in duplicate. Supplementary information, Table S2 provides detailed independent experiment numbers (n), statistical evaluation, and protein expression levels. c, d Comparison between the Rco conformations and the inactive conformation in dimerization mode I. The Rco structures of mGlu2–mGlu3 in the presence of NAM563 (Rco1) or glutamate, JNJ-40411813, and CaCl2 (Rco2) and the inactive structure of mGlu2–mGlu3 in the presence of LY341495, NAM563, and LY2389575 in dimerization mode I are shown at the VFTs (c) and the CRDs and TMDs (d). The red arrow in c indicates the open-to-closed conformational change of the mGlu3 VFT in the Rco structures relative to the inactive structure. The ligands bound in these structures are shown as sticks. e 2D free energy landscapes (FELs) spanned by the distance between the centroids of the two lobes and the lobe 1–lobe 2 subdomain angle of mGlu2 and mGlu3. The contours in the 2D subspace are spaced at intervals of 1.0 kcal/mol. f The ranges of various interaction energies in the open state, including the electrostatic interaction energies between the lobe 1 and lobe 2 subdomains of mGlu2 and mGlu3 (purple), and between the glutamate molecule and mGlu2 or mGlu3 (blue), as well as the vdW energies between the lobe 1 and lobe 2 subdomains of mGlu2 and mGlu3 (green), and between the glutamate molecule and mGlu2 or mGlu3 (brown), respectively.
Fig. 3
Fig. 3. Asymmetric dimerization and activation of mGlu2–mGlu3 and mGlu2–mGlu4.
a, b Comparison of the TMDs in the G protein-free, agonist-bound structures of the heterodimers and mGlu2 homodimer (PDB ID: 7EPB). mGlu2–mGlu3 and mGlu2 (a); mGlu2–mGlu4 and mGlu2 (b). The structures are aligned at the mGlu2 subunit of the heterodimer, and shown in an extracellular view. The red arrows indicate the movement of each helix in the mGlu3 subunit (a) or mGlu4 subunit (b) of the heterodimer relative to its counterpart in the homodimer structure. c, d Comparison of the TMDs in the G protein-free and -bound structures of the heterodimers. mGlu2–mGlu3 (c); mGlu2–mGlu4 (d). The structures are aligned at the G protein-free subunits, and shown in both extracellular and intracellular views. The red arrows indicate the movement of each helix in the Gi-bound mGlu2 subunit relative to its counterpart in the G protein-free structure. eh Glutamate-induced Gi activation of the heterodimers measured by the BRET assay. mGlu2–mGlu3 and mutants (e, g); mGlu2–mGlu4 and mutants (f, h). The superscript ‘X’ indicates that the G protein coupling of the subunit was blocked by introducing a mutation in ICL3 (mGlu2, F756S; mGlu3, F765S; mGlu4, F781S). The BRET data are means ± SEM from at least four independent experiments performed in duplicate. Supplementary information, Table S2 provides detailed independent experiment numbers (n), statistical evaluation, and protein expression levels. i, j Comparison of the conformations of the residue W6.50 in the two subunits in the Gi-bound heterodimer structures. mGlu2–mGlu3 (i); mGlu2–mGlu4 (j). The residues at positions 5.47 and 6.50 in both subunits are shown as sticks. The PAM JNJ-40411813 bound to the mGlu2 subunit, which stabilizes the active conformation of the residue W7736.50, is shown as green sticks. The hydrogen bond between the residues D7445.47 and W7826.50 in the mGlu3 subunit is indicated by a red dashed line (i). k Comparison of the interactions between the residue 3.59 and the basic residues in helix V and ICL3 of mGlu2 and mGlu3. Due to lack of densities for the residue D6713.59 in the mGlu2–mGlu3 structures and previously determined mGlu3 homodimer structures, we generated a model of the mGlu3 TMD by SWISS-MODEL server using the mGlu2 TMD structure in the Gi1–mGlu2–mGlu3 complex as a template. The mGlu3 TMD model and mGlu2 TMD structure (PDB ID: 7EPE) are shown in cartoon representation. l Comparison of the interaction between the mGlu residue 3.60 and the Gαi residue N347 in mGlu2 and mGlu4. The Gi-bound subunits and Gαi subunits in the Gi-bound structures of mGlu2 and mGlu4 homodimers are shown in cartoon representation.
Fig. 4
Fig. 4. PAM binding modes.
a Binding mode of ADX88178 in the mGlu2–mGlu4 heterodimer. The Gi-bound structure of mGlu2–mGlu4 is shown in cartoon representation, with mGlu2 and mGlu4 colored blue and orange, respectively. The PAM ADX88178 is shown as magenta sticks. The residues in the two subunits that interact with ADX88178 are shown as sticks. b Schematic diagrams showing that ADX88178 can bind to the dimer interface in mGlu2–mGlu4 when either of the subunits couples to the G protein. Top, mGlu2–mGlu4–Gi; bottom, Gi–mGlu2–mGlu4. c Binding mode of VU0364770 in the mGlu4 homodimer. The mGlu4–Gi3 structure is shown in cartoon representation, with the G protein-bound subunit and the G protein-free subunit colored orange and yellow, respectively. The PAM VU0364770 is shown as cyan sticks. d ADX88178-induced Gi activation of mGlu2–mGlu4 heterodimer and mGlu4 homodimer. Bars represent calculated PAM potency (pEC50), and are colored according to locations of the mutations. See Supplementary information, Table S2 for values of Emax. The mGlu2–mGlu4 mutations are divided into two groups, one including the mutations in the potential dimer interface of the mGlu2–mGlu4–Gi complex and the other including the mutations in the dimer interface of the Gi–mGlu2–mGlu4 complex. Data are means ± SEM from at least three independent experiments performed in duplicate. Supplementary information, Table S2 provides detailed independent experiment numbers (n), statistical evaluation, and protein expression levels.
Fig. 5
Fig. 5. Schematic diagrams summarizing the conformational changes of the mGlu heterodimers during activation.
Helices IV and VI in the TMDs are highlighted by colors of blue and brown, respectively. The PAMs that modulate the heterodimer activity in inter- and intra-subunit manners are colored red and green, respectively.

Comment in

References

    1. Niswender CM, Conn PJ. Metabotropic glutamate receptors: physiology, pharmacology, and disease. Annu. Rev. Pharmacol. Toxicol. 2010;50:295–322. doi: 10.1146/annurev.pharmtox.011008.145533. - DOI - PMC - PubMed
    1. McCullock TW, Kammermeier PJ. The evidence for and consequences of metabotropic glutamate receptor heterodimerization. Neuropharmacology. 2021;199:108801. doi: 10.1016/j.neuropharm.2021.108801. - DOI - PubMed
    1. Meng J, et al. Nanobody-based sensors reveal a high proportion of mGlu heterodimers in the brain. Nat. Chem. Biol. 2022;18:894–903. doi: 10.1038/s41589-022-01050-2. - DOI - PubMed
    1. Doumazane E, et al. A new approach to analyze cell surface protein complexes reveals specific heterodimeric metabotropic glutamate receptors. FASEB J. 2011;25:66–77. doi: 10.1096/fj.10-163147. - DOI - PubMed
    1. Yin S, et al. Selective actions of novel allosteric modulators reveal functional heteromers of metabotropic glutamate receptors in the CNS. J. Neurosci. 2014;34:79–94. doi: 10.1523/JNEUROSCI.1129-13.2014. - DOI - PMC - PubMed

Publication types

LinkOut - more resources