. 2023 Jul;37(7):444-457.
doi: 10.1177/15459683231177605. Epub 2023 Jun 7.

Cognitive Impairments After Stroke Do Not Attenuate Explicit Visuomotor Adaptation in Reaching and Savings With the Unaffected Arm

Affiliations

Cognitive Impairments After Stroke Do Not Attenuate Explicit Visuomotor Adaptation in Reaching and Savings With the Unaffected Arm

Reut Binyamin-Netser et al. Neurorehabil Neural Repair. 2023 Jul.

Abstract

Background: Accumulating evidence suggests that motor performance is affected by the cognitive control abilities of the subject. Performance in motor tasks in populations with cognitive deficits such as older adults and subjects with stroke is therefore expected to deteriorate. The goal of this study is to investigate the relationship between cognitive impairments and motor control and learning impairments in a visuomotor adaptation task in subjects with stroke.

Methods: Twenty-seven post-stroke, 31 age matched controls, and 30 young control subjects completed a sensorimotor adaptation task composed of 2 adaptation blocks separated by a washout block. Explicit learning was assessed by cueing subjects to suppress their strategy. Cognitive assessment was conducted using the Montreal Cognitive Assessment (MoCA) and a verbal learning test. Subjects with stroke performed the task with their unaffected arm.

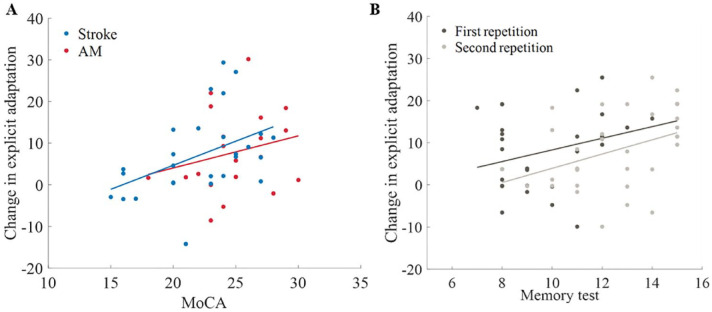
Results: Despite the cognitive deterioration, the adaptation and savings of the stroke group and age matched controls were comparable. Adaptation and savings were smaller with respect to the young subjects. Savings was associated with a significant improvement in the explicit component across blocks. Finally, the explicit enhancement between blocks was significantly correlated with the MoCA scores in the stroke group and with the results of the verbal learning test in the young controls.

Conclusion: The lack of stroke-induced attenuation on adaptation, despite a correlation between cognitive abilities and explicit learning in adaptation, suggests that subjects with stroke have enough cognitive resources to support sensorimotor adaptation. The availability of cognitive resources for motor learning following brain damage could be utilized in the rehabilitation process.

Keywords: adaptation; aging; memory; motor learning; retention; stroke.


Conflict of interest statement

The author(s) declared no potential conflicts of interest with respect to the research, authorship, and/or publication of this article.

Figures

Figure 1.
Figure 1.
(A) Task’s description. Top—The position of the targets. Nine targets were used in the baseline and washout blocks (small circles). Two targets were used during the adaptation blocks (filled black circles). Bottom—description of trials. In baseline, washout and in the cued trials, the hand and cursor (small darker blue dot) direction were aligned. In the cued+ trials the direction of the cursor (pink triangle) was clockwise rotated by 40° with respect to hand direction (black angle line). Directional error angle was calculated by the angle between lines connecting the center of the screen with the target (big light blue circle) and with the point where the cursor crossed the radius of the target. (B) Overall experimental design and the mean hand direction as a function of trial number. The colored lines represent the mean hand direction during the adaptation and readaptation blocks across groups—stroke (blue), AM controls (red), and young controls (gray). The solid line represents the mean hand direction in the cued+ trials of all the subjects. The shade represents confidence interval of 95%. Asterisks represent the location of the cued trials and the mean hand direction in the cued trials of all the 3 groups. The black line indicates the perturbation angle. (C) The mean directional error angle of the first 6 trials (cued+) in the adaptation and readaptation blocks in the 3 groups—stroke (blue), AM controls (red), and young (gray). Gray lines represent individual subjects. (D) Savings in the 3 groups. Stroke (blue), AM controls (red), and young controls controls (gray). Horizonal lines represent averages. Individual subjects are represented by dots.
Figure 2.
Figure 2.
Explicit learning. (A) Explicit learning (calculated by subtracting hand angle direction in the cued trials from the cued+ trials that appeared before them, see Figure 1B for the location of the cued trials) along the adaptation block and readaptation block in all of the groups (stroke (blue), AM controls (red), and young controls (gray)). The solid line represents the mean hand angle of the explicit components of all the subjects. The shade represents confidence interval of 95%. (B) Change in explicit adaptation (readaptation block–adaptation block) across groups. Horizontal lines represent means. Dots represent individual subjects: stroke (blue), AM controls (red), and young controls (gray). (C) Correlation between explicit learning and savings across all groups. Dots represent individual subjects: stroke (blue), AM controls (red), and young controls (gray). Trendlines are derived using a regression analysis for visualizing the linear associations between variables.
Figure 3.
Figure 3.
Implicit learning. (A) Implicit learning through time in adaptation block and readaptation block in all of the groups (stroke (blue), AM controls (red), and young controls (gray)). The solid line represents the mean hand angle of the implicit components of all subjects. The shade represents the ± confidence interval of 95%. (B) Change in implicit adaptation (implicit component during adaptation–implicit component during readaptation). Horizonal lines represent averages. Dots represent individual subjects: stroke (blue), AM controls (red), and young controls (gray).
Figure 4.
Figure 4.
Cognitive performance and explicit adaptation. (A) Correlation between explicit enhancement and MoCA final score in the stroke (blue), AM controls (red). Dots represent individual subjects. (B) Correlation between explicit enhancement and the scores from the first repetition (dark gray) and the second repetition (light gray) in the modification of the California verbal learning test II in the young controls group. Dots represent individual subjects. Trendlines in A and B are derived using a regression visualizing the linear associations between variables.

References

    1. Taylor JA, Ivry RB.The role of strategies in motor learning. Ann N Y Acad Sci. 2012;1251:1-12. doi:10.1111/j.1749-6632.2011.06430.x - DOI - PMC - PubMed
    1. Mazzoni P, Krakauer JW.An implicit plan overrides an explicit strategy during visuomotor adaptation. J Neurosci. 2006;26(14):3642-3645. doi:10.1523/JNEUROSCI.5317-05.2006 - DOI - PMC - PubMed
    1. Taylor JA, Krakauer JW, Ivry RB.Explicit and implicit contributions to learning in a sensorimotor adaptation task. J Neurosci. 2014;34(8):3023-3032. doi:10.1523/JNEUROSCI.3619-13.2014 - DOI - PMC - PubMed
    1. Fernandez-Ruiz J, Wong W, Armstrong IT, Flanagan JR.Relation between reaction time and reach errors during visuomotor adaptation. Behav Brain Res. 2011;219(1):8-14. - PubMed
    1. Huberdeau DM, Haith AM, Krakauer JW.Formation of a long-term memory for visuomotor adaptation following only a few trials of practice. J Neurophysiol. 2015;114(2):969-977. doi:10.1152/jn.00369.2015 - DOI - PMC - PubMed