. 2023 May 23:11:1190386.
doi: 10.3389/fcell.2023.1190386. eCollection 2023.

Identifying fibrogenic cells following salivary gland obstructive injury

Affiliations

Identifying fibrogenic cells following salivary gland obstructive injury

Amber L Altrieth et al. Front Cell Dev Biol. .

Abstract

Fibrosis results from excess extracellular matrix accumulation, which alters normal tissue architecture and impedes function. In the salivary gland, fibrosis can be induced by irradiation treatment for cancer therapy, Sjögren's Disease, and other causes; however, it is unclear which stromal cells and signals participate in injury responses and disease progression. As hedgehog signaling has been implicated in fibrosis of the salivary gland and other organs, we examined contributions of the hedgehog effector, Gli1, to fibrotic responses in salivary glands. To experimentally induce a fibrotic response in female murine submandibular salivary glands, we performed ductal ligation surgery. We detected a progressive fibrotic response where both extracellular matrix accumulation and actively remodeled collagen significantly increased at 14 days post-ligation. Macrophages, which participate in extracellular matrix remodeling, and Gli1+ and PDGFRα+ stromal cells, which may deposit extracellular matrix, both increased with injury. Using single-cell RNA-sequencing, Gli1 + cells were not found in discrete clusters at embryonic day 16 but were found in clusters expressing the stromal genes Pdgfra and/or Pdgfrb. In adult mice, Gli1+ cells were similarly heterogeneous but more cells co-expressed PDGFRα and PDGFRβ. Using Gli1-CreERT2; ROSA26tdTomato lineage-tracing mice, we found that Gli1-derived cells expand with ductal ligation injury. Although some of the Gli1 lineage-traced tdTomato+ cells expressed vimentin and PDGFRβ following injury, there was no increase in the classic myofibroblast marker, smooth muscle alpha-actin. Additionally, there was little change in extracellular matrix area, remodeled collagen area, PDGFRα, PDGFRβ, endothelial cells, neurons, or macrophages in Gli1 null salivary glands following injury when compared with controls, suggesting that Gli1 signaling and Gli1+ cells have only a minor contribution to mechanical injury-induced fibrotic changes in the salivary gland. We used scRNA-seq to examine cell populations that expand with ligation and/or showed increased expression of matrisome genes. Some Pdgfra + /Pdgfrb + stromal cell subpopulations expanded in response to ligation, with two stromal cell subpopulations showing increased expression of Col1a1 and a greater diversity of matrisome genes, consistent with these cells being fibrogenic. However, only a few cells in these subpopulations expressed Gli1, consistent with a minor contribution of these cells to extracellular matrix production. Defining the signaling pathways driving fibrotic responses in stromal cell sub-types could reveal future therapeutic targets.

Keywords: Gli1; collagen; extracellular matrix (ECM); fibrosis; platelet derived growth factor receptor (PDGFR); salivary gland.


Conflict of interest statement

The authors declare that the research was conducted in the absence of any commercial or financial relationships that could be construed as a potential conflict of interest.

Figures

FIGURE 1
FIGURE 1
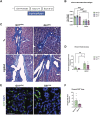
A progressive and dynamic fibrotic stromal response occurs in response to ductal ligation surgery. (A) Schematic of ductal ligation surgery showing clip application on the main ducts of the left submandibular and sublingual glands of a 12-week-old female C57BL/6J mouse. (B) H&E-stained whole gland images of 14-day mock (Mock), 7-Day ligated (7-Day), and 14-Day ligated (14-Day) mice. Scale bar 250 µm. (C) Gland weights normalized to mouse weight in time-point zero (T0), Mock, 7-Day, and 14-Day glands. N = 10, 25, 6, and 34, respectively. (D) Trichrome staining shows deposited ECM in blue with a trend of increasing ECM from 7- to 14-Day ligation. Black arrowheads denote regions of ECM present in both ligated and control conditions adjacent to large ducts and vasculature, while orange arrowheads denote expanded regions of ECM present only in the ligated glands, specifically in interlobular regions. (E) Quantification of percent trichrome area relative to tissue area in T0, Mock, 7-Day, and 14-Day glands. N = 6, 5, 6, 5 respectively. (F) Collagen hybridizing peptide (CHP), in green, labeling actively remodeled collagen, together with immunohistochemistry to detect platelet-derived growth factor receptor alpha (PDGFRα), in red, labeling a subset of the stromal cells, and F4/80, in grey, labeling macrophages with nuclear staining (DAPI) in blue. A subset of actively remodeled collagen is located near PDGFRα+ cells and/or F4/80+ macrophages (orange arrowheads). Quantification of percent stain area normalized to total tissue area for (G) CHP (H) PDGFRα and (I) F4/80 N = 6, 6, 6, 5 respectively. Error bars: S.E.M. One-way ANOVA followed by Tukey’s multiple comparisons test was performed using GraphPad Prism version 9.4.1. *p ≤ 0.05, **p ≤ 0.01, ***p ≤ 0.001, ****p ≤ 0.0001. Scale bars 100 µm.
FIGURE 2
FIGURE 2
Gli1+ cells, which are a subset of PDGFRα+ and PDGFRβ+ cells, reside in the neurovascular region and expand with injury. Violin plots of stromal enriched scRNA-seq data subsetted for stromal cells from an embryonic day 16 (E16) SMG and SLG, highlighting cells expressing transcripts for (A) Gli1 (B) Pdgfra and (C) Pdgfrb. (D) Stacked bar graph depicting percentages of Gli1 + cells that express Gli1 only, Gli1 and Pdgfra, Gli1 and Pdgfrb, or Gli1, Pdgfra, and Pdgfrb from E16 stromal enriched scRNA-seq subsetted for stromal cells. (E) Schematic showing tamoxifen-induction scheme for 11- to 15-week-old adult female Gli1tm3(cre/ERT2)Alj/J; (CAG)ROSA26tdTomato (Gli1; R26tdT) lineage reporter mice harvested 3 weeks post-initial induction or with 14 day ductal ligation surgery performed 1 week after induction. (F) Immunohistochemistry (IHC) to detect Gli1; R26tdT lineage-traced cells (red) with nuclei (DAPI) in blue in control 3 week induced and 14 day ligated mouse SMG. (G) Quantification of percent Gli1; R26tdT+ area normalized to tissue area in control 3 week induced and 14 day ligated mouse SMG. (H) IHC to detect Gli1; R26tdT lineage-traced cells (red) in adult SMG together with PDGFRα (green) with nuclei (DAPI) in blue. Orange arrowheads represent colocalization of Gli1; R26tdT with PDGFRα. Scale bar 25 µm. (I) IHC to detect Gli1; R26tdT lineage-traced cells (red) in adult SMG together with PDGFRβ (grey) with nuclei (DAPI) in blue. Orange arrowheads represent colocalization of Gli1; R26tdT with PDGFRβ. (J) IHC to detect Gli1; R26tdT (red), CD31 (green), and βIII (grey), shows that Gli1; R26tdT-derived cells are enriched in areas near large ducts, large vessels, and nerve bundles in the proximal region of the adult SMG. Scale bar 100 µm. N = 4. Error bars: S.E.M. Statistical tests were performed using GraphPad Prism version 9.4.1. ** p ≤ 0.01.
FIGURE 3
FIGURE 3
Genetic knockout of Gli1 reduces trend in ECM deposition and remodeling. (A) Schematic of the Gli1 gene, showing insertion of the beta-galactosidase gene (β-galactosidase) in exons 2-7 of the gene, resulting in a non-functional protein in Gli1lz/lz mice. (B) Left SMG and SLG weight normalized to mouse weight for control (T0) and 14-day ligated (Ligated) wild-type (Gli1wt/wt), heterozygous (Gli1lz/wt) and homozygous knockout (Gli1lz/lz) mice. N = 10, 9, and 5 for T0 and 7, 7, and 6 for Ligated, respectively. All T0 glands are statistically larger than ligated glands and for simplicity only comparisons from mice of the same genotype are displayed on the graph. Statistical Test: Two-way ANOVA followed by Tukey’s multiple comparisons test ****p ≤ 0.0001. (C) ×10 magnification of Masson’s trichrome-stained T0 and Ligated Gli1wt/wtand Gli1lz/lz mice. Scale bar 100 µm. (D) Quantification of percent trichrome area normalized to total tissue area. Statistical Test: Two-way ANOVA followed by Tukey’s multiple comparisons test *p ≤ 0.05 ** p ≤ 0.01. N = 8 and 4 for T0 and 6 and 5 for Ligated, respectively. (E) Immunohistochemistry on Ligated Gli1wt/wt and Gli1lz/lz knockout mice for collagen hybridizing peptide (CHP) in green with nuclear staining (DAPI) in blue. Scale bar 25 µm. (F) Quantification of percent stain area normalized to total tissue area for CHP. Statistical Test: Unpaired two-tailed t-test was performed. Ligated Gli1wt/wt N = 6 and Gli1lz/lz N = 5. Error bars: S.E.M. Statistical tests were performed using GraphPad Prism version 9.4.1.
FIGURE 4
FIGURE 4
Genetic knockout of Gli1 does not significantly alter stromal cell populations. (A) Immunohistochemistry on 14-day ligated wild-type (Gli1wt/wt) and homozygous knockout (Gli1lz/lz) mice to detect platelet-derived growth factor receptor alpha (PDGFRα) in red and F4/80 in grey or (B) platelet-derived growth factor beta (PDGFRβ) in green or (F) beta-III tubulin (βIII) in grey and platelet endothelial cell adhesion molecule (CD31 or PECAM1) in red with nuclear staining (DAPI) in blue. Scale bar 25 µm. Quantification of percent stain area normalized to total tissue area for (C) PDGFRα (D) F4/80 (E) PDGFRβ (G) βIII and (H) CD31. Statistical Test: Unpaired two-tailed t-test was performed. Gli1wt/wt N = 6 and Gli1lz/lz N = 5. Error bars: S.E.M. Statistical tests were performed using GraphPad Prism version 9.4.1.
FIGURE 5
FIGURE 5
Gli1-linage traced cells show increased colocalization with vimentin and PDGFRβ after ligation injury. Immunohistochemistry (IHC) to detect Gli1; R26tdT-lineage traced cells (red) in SMG together with (A) SMA (green) or (C) vimentin (green) with nuclei (DAPI) in blue in 3-week induced control (Control) or 14-day ligated (Ligated) mice. Quantification of Gli1; R26tdT lineage traced cells with (B) SMA and (D) vimentin. IHC to detect Gli1; R26tdT-lineage traced cells (red) in SMG together with (E) PDGFRα (green) or (G) PDGFRβ (grey) with nuclei (DAPI) in blue in 14-day Ligated mice. Orange arrows represent colocalization between Gli1; R26tdT+ cells and PDGFRα or β. Quantification of Gli1; R26tdT lineage-traced cells with (F) PDGFRα and (H) PDGFRβ, showing a significant increase in colocalization between Gli1; R26tdT and PDGFRβ. N = 4. Scale bars 50 µm. Error bars: S.E.M. Statistical Test: Unpaired two-tailed t-test was performed using GraphPad Prism version 9.4.1. * p ≤ 0.05 and **p ≤ 0.01.
FIGURE 6
FIGURE 6
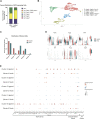
A Pdgfra expressing subset of stromal cells shows enrichment of ECM and ECM-associated genes after ductal ligation injury. (A) Stacked bar graph showing the proportion of Gli1 + cells that express Gli1 only, Gli1, Pdgfra, Pdgfrb, and Adgre1, Gli1, Pdgfra, and Pdgfrb, Gli1 and Pdgfra only, Gli1 and Pdgfrb only, and Gli1 and Adgre1 only in 14-day mock (Mock) and 14-day ligated (Ligated) glands. (B) UMAP from stromal cells subsetted based on expression of the stromal cell identity markers Pdgfra, Pdgfrb, and/or Gli1. (C) Bar graph showing the percent distribution of stromal cells, which was calculated by dividing the number of cells in each cluster by the total number of cells in their sample of origin and multiplying by 100. (D) Violin plots showing expression levels of Pdgfra, Pdgfrb, Col1a1, Gli1, Postn, and Dpp4 in Mock and Ligated glands. (E) Dot plot showing expression levels and percent of cells expressing ECM-associated genes that were differentially expressed in cluster 0 post-ligation.

Update of

References

    1. Ahn S., Joyner A. L. (2004). Dynamic changes in the response of cells to positive hedgehog signaling during mouse limb patterning. Cell. 118, 505–516. 10.1016/j.cell.2004.07.023 - DOI - PubMed
    1. Ajay A. K., Zhao L., Vig S., Fujiwara M., Thakurela S., Jadhav S., et al. (2022). Deletion of STAT3 from Foxd1 cell population protects mice from kidney fibrosis by inhibiting pericytes trans-differentiation and migration. Cell. Rep. 38, 110473. 10.1016/j.celrep.2022.110473 - DOI - PMC - PubMed
    1. Amano O., Mizobe K., Bando Y., Sakiyama K. (2012). Anatomy and histology of rodent and human major salivary glands: -overview of the Japan salivary gland society-sponsored workshop-. ACTA Histochem. Cytochem. 45, 241–250. 10.1267/ahc.12013 - DOI - PMC - PubMed
    1. Bagalad B. S., Mohan Kumar K. P., Puneeth H. K. (2017). Myofibroblasts: Master of disguise. J. Oral Maxillofac. Pathol. 21, 462–463. 10.4103/jomfp.JOMFP_146_15 - DOI - PMC - PubMed
    1. Bai C. B., Auerbach W., Lee J. S., Stephen D., Joyner A. L. (2002). Gli2, but not Gli1, is required for initial Shh signaling and ectopic activation of the Shh pathway. Development 129, 4753–4761. 10.1242/dev.129.20.4753 - DOI - PubMed