. 2023 May 29:10:100491.
doi: 10.1016/j.ejro.2023.100491. eCollection 2023.

Automatic localisation and per-region quantification of traumatic brain injury on head CT using atlas mapping

Affiliations

Automatic localisation and per-region quantification of traumatic brain injury on head CT using atlas mapping

Carolina Piçarra et al. Eur J Radiol Open. .

Abstract

Rationale and objectives: To develop a method for automatic localisation of brain lesions on head CT, suitable for both population-level analysis and lesion management in a clinical setting.

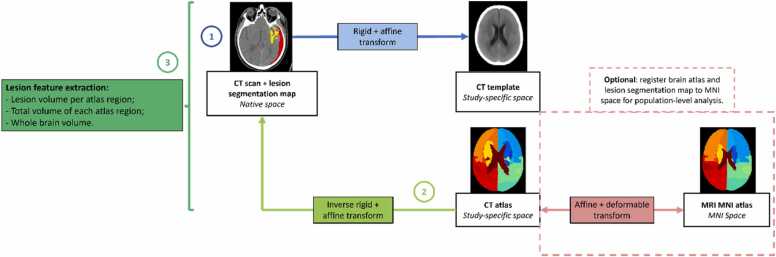
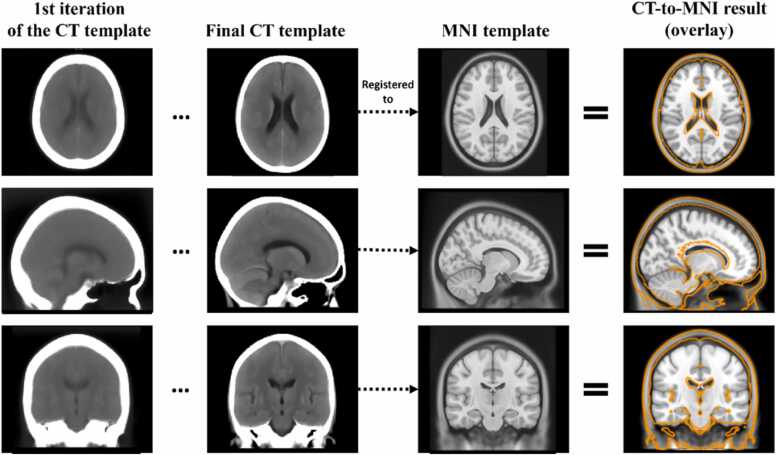
Materials and methods: Lesions were located by mapping a bespoke CT brain atlas to the patient's head CT in which lesions had been previously segmented. The atlas mapping was achieved through robust intensity-based registration enabling the calculation of per-region lesion volumes. Quality control (QC) metrics were derived for automatic detection of failure cases. The CT brain template was built using 182 non-lesioned CT scans and an iterative template construction strategy. Individual brain regions in the CT template were defined via non-linear registration of an existing MRI-based brain atlas.Evaluation was performed on a multi-centre traumatic brain injury dataset (TBI) (n = 839 scans), including visual inspection by a trained expert. Two population-level analyses are presented as proof-of-concept: a spatial assessment of lesion prevalence, and an exploration of the distribution of lesion volume per brain region, stratified by clinical outcome.

Results: 95.7% of the lesion localisation results were rated by a trained expert as suitable for approximate anatomical correspondence between lesions and brain regions, and 72.5% for more quantitatively accurate estimates of regional lesion load. The classification performance of the automatic QC showed an AUC of 0.84 when compared to binarised visual inspection scores. The localisation method has been integrated into the publicly available Brain Lesion Analysis and Segmentation Tool for CT (BLAST-CT).

Conclusion: Automatic lesion localisation with reliable QC metrics is feasible and can be used for patient-level quantitative analysis of TBI, as well as for large-scale population analysis due to its computational efficiency (<2 min/scan on GPU).

Keywords: CT; Image registration; Traumatic brain injury.


Conflict of interest statement

The authors declare the following financial interests/personal relationships which may be considered as potential competing interests: Prof. Ben Glocker reports financial support was provided by European Research Council (ERC) under the European Union’s Horizon 2020 research and innovation program (Grant Agreement No. 757173, Project MIRA). The CENTER-TBI study was supported by the European Union 7th Framework Programme (EC grant 602150). Carolina Piçarra and Stefan Winzeck report financial support provided by UKRI London Medical Imaging & Artificial Intelligence Centre for Value Based Healthcare. Virginia Newcombe reports financial support was provided by Academy of Medical Sciences.

Figures

Fig. 1
Fig. 1
Flowchart of the full lesion localisation method. 1- Every native CT scan is registered to the CT template; 2- The inverse of the transformation calculated in step 1 is used to map the parcellated atlas to native patient space. 3- Relevant volumes are calculated from the overlap between the parcellated brain regions and each lesion segmentation map. Optionally, the brain atlas and the subject’s segmentation map can be registered to MNI space using the reversible non-linear transformation between our CT atlas and the MNI atlas, calculated during the CT template construction. This way the lesion volume values can be calculated from the overlap in a canonical neuroimaging space, which might be more suitable for population-level analysis.
Fig. 2
Fig. 2
Initial and final CT template, i.e. resulting from the 1st and 7th iteration of the template construction process. The final template is then non-linearly registered to the MNI MRI template. The result of this CT-to-MNI registration is shown as the orange contour, overlaid on the MNI template image for verification of anatomical correspondence. This transformation was then used to map the brain regions, originally parcellated in MNI space, to the CT template space.
Fig. 3
Fig. 3
a) Count and percentage of results rated from 1 to 6. 1: Atlas completely misaligned; 2: Brain outline misaligned; 3: Brain outline and most regions aligned but relevant regions misaligned, e.g., ventricles or brainstem; 4: Acceptable alignment of all regions; 5: Good alignment; 6: Perfect alignment. b) Distribution of SM grouped by rating attributed by a trained expert. Each point on the strip plots per rating value represents a scan with a true total lesion volume over (orange) or under (blue) 10 mL; c) Atlas alignment of three examples, rated with 2, 3 and 4. Red arrows indicate the atlas misalignment features characteristic of each rating score.
Fig. 4
Fig. 4
Qualitative atlas mapping results from Dataset 2, with corresponding manual score and SM value. Images in neurological orientation. Lesion map prediction (from BLAST-CT) colour legend: Red - IVH; Purple - IPH; Yellow - Oedema; Light blue – EAH.
Fig. 5
Fig. 5
Per-class prevalence maps. All maps are displayed in neurological orientation. Threshold = 0.1 mL. The prevalence of EAH, IPH and oedema lesions is significantly higher in the anterior half of the brain, while IVH lesions are most prevalent in the ventricles. EAH also presents, as expected, higher prevalence in regions contiguous with the cerebral border.
Fig. 6
Fig. 6
Per-class boxplots of lesion volume localised in the whole brain and each brain region, stratified by outcome. Volumes calculated from reference segmentation maps of Dataset 2 scans, excluding sub-optimal cases.

References

    1. Dewan Michael C., et al. Estimating the global incidence of traumatic brain injury. J. Neurosurg. 2018;130(4):1080–1097. - PubMed
    1. Ferrazzano Peter A., et al. Use of magnetic resonance imaging in severe pediatric traumatic brain injury: assessment of current practice. J. Neurosurg. Pediatr. 2019;23(4):471–479. - PMC - PubMed
    1. Thelin Eric Peter, et al. Evaluation of novel computerized tomography scoring systems in human traumatic brain injury: an observational, multicenter study. PLoS Med. 2017;14(8) - PMC - PubMed
    1. Webb Alastair J.S., et al. Accuracy of the ABC/2 score for intracerebral hemorrhage: systematic review and analysis of MISTIE, CLEAR-IVH, and CLEAR III. Stroke. 2015;46(9):2470–2476. - PMC - PubMed
    1. Rowe Brian H., et al. Concussion diagnoses among adults presenting to three Canadian emergency departments: missed opportunities. Am. J. Emerg. Med. 2018;36(12):2144–2151. - PubMed

Further reading

    1. Jason R., Taylor, et al. The Cambridge Centre for Ageing and Neuroscience (Cam-CAN) data repository: Structural and functional MRI, MEG, and cognitive data from a cross-sectional adult lifespan sample. Neuroimage. 2017;144:262–269. - PMC - PubMed
    1. Christian Ledig, et al. Robust whole-brain segmentation: application t traumatic brain injury. Med. Image Anal. 2015;21(1):40–58. - PubMed