. 2023 May 23:17:1128866.
doi: 10.3389/fninf.2023.1128866. eCollection 2023.

Quantifying evoked responses through information-theoretical measures

Affiliations

Quantifying evoked responses through information-theoretical measures

Julian Fuhrer et al. Front Neuroinform. .

Abstract

Information theory is a viable candidate to advance our understanding of how the brain processes information generated in the internal or external environment. With its universal applicability, information theory enables the analysis of complex data sets, is free of requirements about the data structure, and can help infer the underlying brain mechanisms. Information-theoretical metrics such as Entropy or Mutual Information have been highly beneficial for analyzing neurophysiological recordings. However, a direct comparison of the performance of these methods with well-established metrics, such as the t-test, is rare. Here, such a comparison is carried out by evaluating the novel method of Encoded Information with Mutual Information, Gaussian Copula Mutual Information, Neural Frequency Tagging, and t-test. We do so by applying each method to event-related potentials and event-related activity in different frequency bands originating from intracranial electroencephalography recordings of humans and marmoset monkeys. Encoded Information is a novel procedure that assesses the similarity of brain responses across experimental conditions by compressing the respective signals. Such an information-based encoding is attractive whenever one is interested in detecting where in the brain condition effects are present.

Keywords: ECoG; EEG; algorithmic complexity; frequency tagging; information content; t-test.


Conflict of interest statement

The authors declare that the research was conducted in the absence of any commercial or financial relationships that could be construed as a potential conflict of interest.

Figures

Figure 1
Figure 1
PSD and SNR of a responsive channel located in the superior temporal sulcus of a human. The activity of the channel shows synchrony to the main frequency of tone onsets, which is around 2 Hz. The displayed deviation is due to a constant lag of tone presentation during recording (the resulting theoretical main sequence is at 1.919 Hz). Further, it shows synchrony to half the main frequency indicating that the underlying region of this channel tags the presentation rate of solely standard or deviant tones. Thus, it discriminates between standard and deviant conditions. The dashed line indicates the statistical threshold.
Figure 2
Figure 2
Sketch of the procedure for an example electrode. Based on the trials, a mean response for each condition is computed. Trials are then shuffled, resulting in surrogate mean responses. Subsequently, these signals undergo a simplification procedure, followed by their compression. The output of the compression routine is the EI, quantifying the similarity between responses. The resulting values are then evaluated, leading to a null model distribution. This distribution serves to assess the significance of the actual EI value.
Figure 3
Figure 3
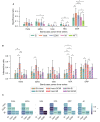
Performance of the different methods for the Optimum-1 paradigm. Error bars indicate 95%-CIs across subjects. Importantly, each subject has a unique electrode distribution such that the range of significant channels can greatly vary. (A) Significance ratio for each electrophysiological representation. Statistical significance is indicated with *p ≤ 5e−2, **p ≤ 1e−2, ***p ≤ 1e−3, and ****p ≤ 1e−4. (B) Intersection of the significant channels across methods. Each number is shown relative to the total number of significant channels. (C) Correlation matrices comparing the subject-specific significant ratios. The respective p-value is annotated in each square.
Figure 4
Figure 4
Significance ratio across brain regions for the different methods based on the Optimum-1 paradigm. The number of channels per ROI is indicated in brackets (For more detailed information on the ROIs, see supplementary of Fuhrer et al., 2021).
Figure 5
Figure 5
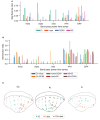
Performance of the different methods for the Roving Oddball paradigm across the three marmoset monkeys “Go”, “Kr”, and “Fr”. (A) Global significance ratio for each marmoset. (B) Intersection of the significant channels for each method combination. Each number is shown relative to the total number of significant channels for each method combination. (C) Location of the significant channels for EI and t-test for HFA (monkey “Go” has 64, “Kr” 62, and “Fr” exhibits 32 channels).
Figure 6
Figure 6
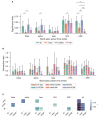
Performance of the different methods across subjects for the vWM task. (A) Performance of the different methods. The error bars indicate the 95% CIs across subjects. (B) Significance ratio across representation. Statistical significance is indicated with *p ≤ 5e-2, **p ≤ 1e−2, ***p ≤ 1e−3 and ****p ≤ 1e−4. (C) Correlation matrices comparing the subject-specific significant ratios. The respective p-value is annotated in each square.
Figure 7
Figure 7
Performance in the case of a limited amount of data and estimation of false positives. (A) Selection of channels according to their respective t-value. The channels emerged from HFA or the Optimum-1 paradigm and were located in the respective 25, 50, 75, and 97.5 -percentiles of the t-value distribution. (B) The number of trials was reduced by randomly selecting a varying number of trials for each condition. This was followed by repeatedly applying the measures (50 times for each percentage). The dashed line represents the significance threshold (p = 0.05). Note that the y-range is limited to 6 (corresponding to a p-value of 2.5e−3). 100% of the trials was around 759.50 ± 360.85 trials for deviant responses and 715.14 ± 388.12 trials for standards for each channel. The dots on the significance line indicate the trial percentage when each method exceeded the significance level. (C) False positive rate estimation by repeatably discriminating two random samples with 100 observations each, drawn from the standard normal distribution. The significance level α = 0.05 is indicated with a black dashed line.

References

    1. Bastos A. M., Vezoli J., Bosman C., Schoffelen J.-M., Oostenveld R., Dowdall J., et al. . (2015). Visual areas exert feedforward and feedback influences through distinct frequency channels. Neuron. 85, 390–401. 10.1016/j.neuron.2014.12.018 - DOI - PubMed
    1. Blenkmann A. O., Collavini S., Lubell J., Llorens A., Funderud I., Ivanovic J., et al. . (2019). Auditory deviance detection in the human insula: An intracranial eeg study. Cortex 121, 189–200. 10.1016/j.cortex.2019.09.002 - DOI - PubMed
    1. Canales-Johnson A., Billig A. J., Olivares F., Gonzalez A., Garcia M. D. C., Silva W., et al. . (2020). Dissociable neural information dynamics of perceptual integration and differentiation during bistable perception. Cerebral Cortex 30, 4563–4580. 10.1093/cercor/bhaa058 - DOI - PMC - PubMed
    1. Canales-Johnson A., Teixeira Borges A. F., Komatsu M., Fujii N., Fahrenfort J. J., Miller K. J., et al. . (2021). Broadband dynamics rather than frequency-specific rhythms underlie prediction error in the primate auditory cortex. J. Neurosci. 41, 9374–9391. 10.1523/JNEUROSCI.0367-21.2021 - DOI - PMC - PubMed
    1. Colquhoun D. (2014). An investigation of the false discovery rate and the misinterpretation of p-values. R. Soc. Open Sci. 1, 140216. 10.1098/rsos.140216 - DOI - PMC - PubMed

LinkOut - more resources