. 2023 May 23:13:1156812.
doi: 10.3389/fonc.2023.1156812. eCollection 2023.

5-aminolevulinic acid, fluorescein sodium, and indocyanine green for glioma margin detection: analysis of operating wide-field and confocal microscopy in glioma models of various grades

Affiliations

5-aminolevulinic acid, fluorescein sodium, and indocyanine green for glioma margin detection: analysis of operating wide-field and confocal microscopy in glioma models of various grades

Evgenii Belykh et al. Front Oncol. .

Abstract

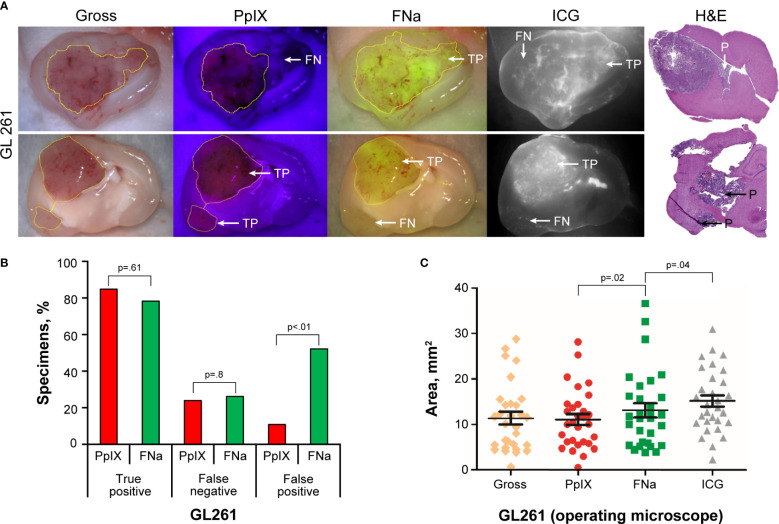
Introduction: Surgical resection remains the first-line treatment for gliomas. Several fluorescent dyes are currently in use to augment intraoperative tumor visualization, but information on their comparative effectiveness is lacking. We performed systematic assessment of fluorescein sodium (FNa), 5-aminolevulinic acid (5-ALA)-induced protoporphyrin IX (PpIX), and indocyanine green (ICG) fluorescence in various glioma models using advanced fluorescence imaging techniques.

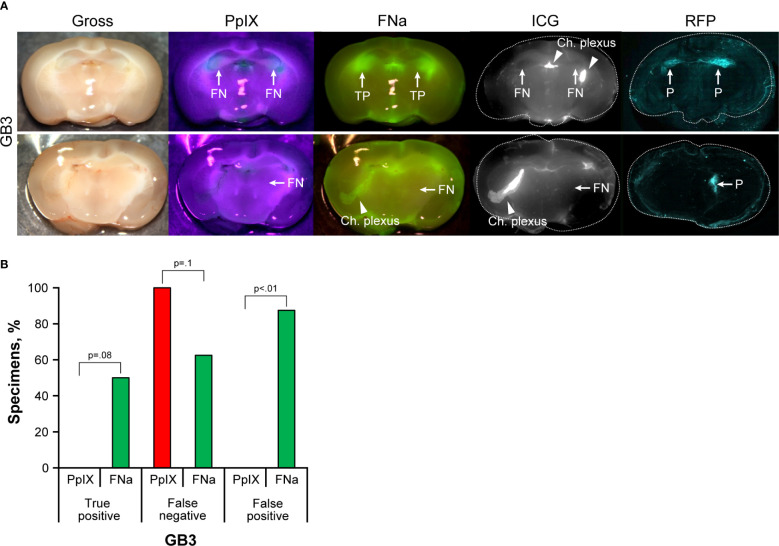
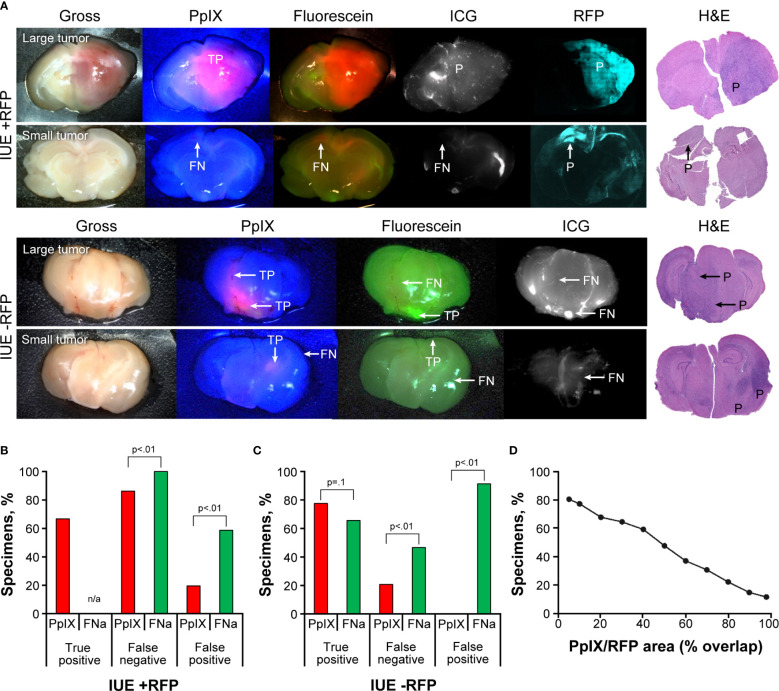
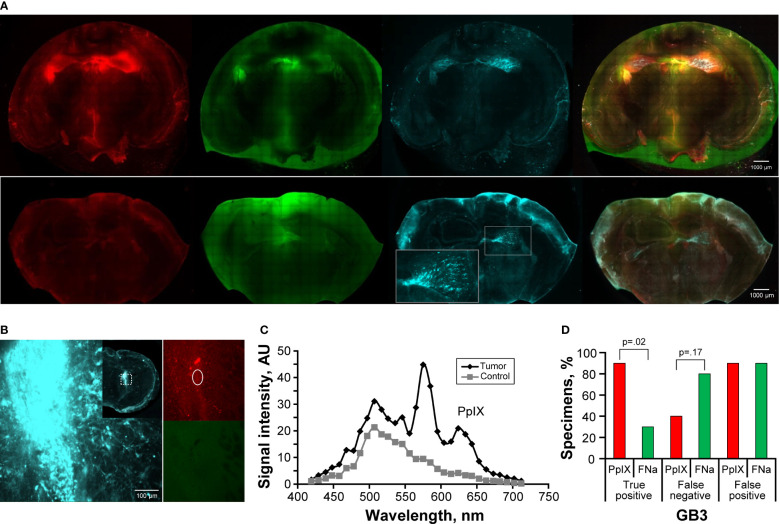
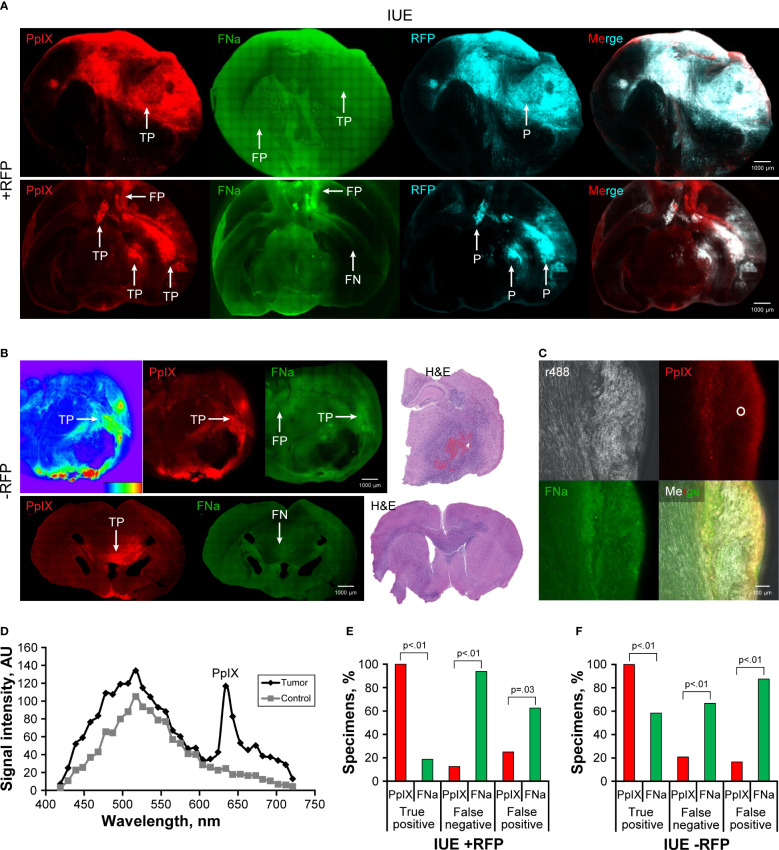
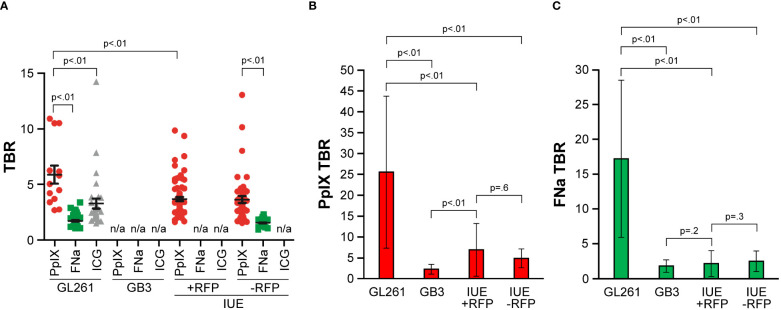
Methods: Four glioma models were used: GL261 (high-grade model), GB3 (low-grade model), and an in utero electroporation model with and without red fluorescence protein (IUE +RFP and IUE -RFP, respectively) (intermediate-to-low-grade model). Animals underwent 5-ALA, FNa, and ICG injections and craniectomy. Brain tissue samples underwent fluorescent imaging using a wide-field operative microscope and a benchtop confocal microscope and were submitted for histologic analysis.

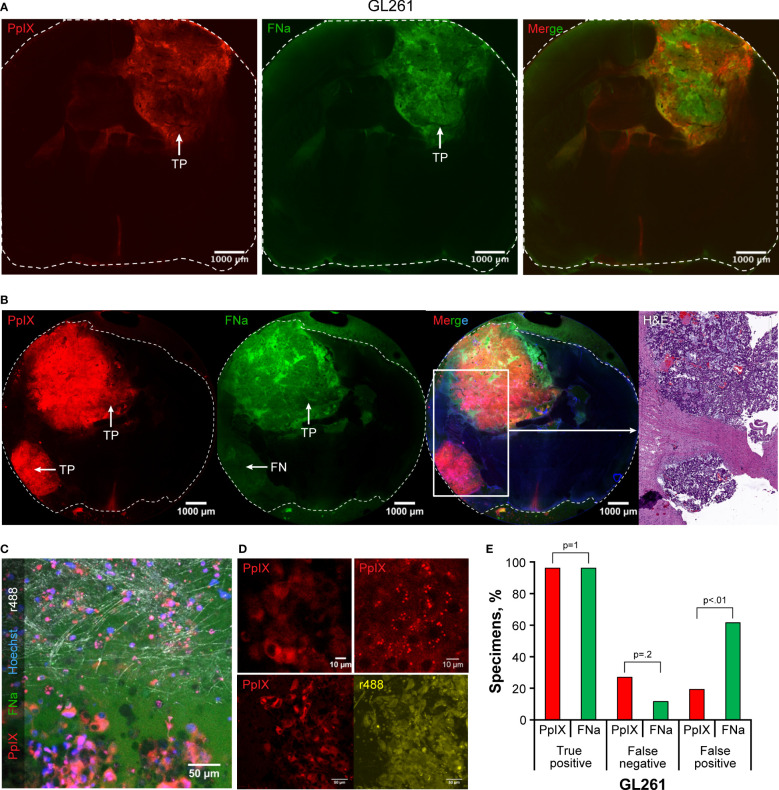
Results: Our systematic analysis showed that wide-field imaging of highly malignant gliomas is equally efficient with 5-ALA, FNa, and ICG, although FNa is associated with more false-positive staining of the normal brain. In low-grade gliomas, wide-field imaging cannot detect ICG staining, can detect FNa in only 50% of specimens, and is not sensitive enough for PpIX detection. With confocal imaging of low-intermediate grade glioma models, PpIX outperformed FNa.

Discussion: Overall, compared to wide-field imaging, confocal microscopy significantly improved diagnostic accuracy and was better at detecting low concentrations of PpIX and FNa, resulting in improved tumor delineation. Neither PpIX, FNa, nor ICG delineated all tumor boundaries in studied tumor models, which emphasizes the need for novel visualization technologies and molecular probes to guide glioma resection. Simultaneous administration of 5-ALA and FNa with use of cellular-resolution imaging modalities may provide additional information for margin detection and may facilitate maximal glioma resection.

Keywords: 5-aminolevulinic acid; fluorescein sodium; fluorescence guided surgery; glioma; indocyanine green; laser scanning microscopy; protoporphyrin IX.


Conflict of interest statement

The authors declare that the research was conducted in the absence of any commercial or financial relationships that could be construed as a potential conflict of interest.

Figures

Figure 1
Figure 1
GL261 gliomas visualized using operating microscope with various fluorescent filters. (A) Examples of coronal slices of mouse brains interrogated under white light view (gross) as well as protoporphyrin IX (PpIX), fluorescein sodium (FNa), and indocyanine green (ICG) fluorescence. In most cases, PpIX, FNa, and ICG highlighted the bulk of the tumors well. However, there was a tumor area that was highlighted by FNa fluorescence but not by PpIX (top row) and vice versa (bottom row). Samples stained with hematoxylin and eosin (H&E) were used as a reference to identify location of the tumors, indicated as positive (P). (B) Comparison of the percentages of true-positive (TP), false-negative (FN), and false-positive (FP) areas between PpIX and FNa fluorescence. The y-axis indicates the percentage of specimens in which TP, FN, and FP fluorescence were identified. Among 46 GL261 brain samples (18 animals), 39 (85%) had TP findings, 11 (24%) had FN findings, and 5 (11%) had FP findings of areas of tumor with PpIX fluorescence. With FNa fluorescence, 36 (78%) samples had TP findings of areas of tumor, 12 (26%) had FN findings, and 24 (52%) had FP findings. PpIX fluorescence showed significantly fewer FP fluorescent areas (p<0.01). (C) Quantitative comparison of tumor areas (n=30 samples) as identified from gross white light picture (mean [SD] area, 11.4 [7.5] mm2), PpIX fluorescence (11.1 [6.5] mm2), FNa fluorescence (13.1 [8.4] mm2), and ICG fluorescence (15.4 [6.9] mm2). A larger area was highlighted with FNa than with PpIX (p=0.02, by Wilcoxon matched-pairs signed rank test), and a smaller area was highlighted with FNa than with ICG (p=0.04, by Wilcoxon matched-pairs signed rank test). Used with permission from Barrow Neurological Institute, Phoenix, Arizona.
Figure 2
Figure 2
GB3 gliomas visualized using operating microscope with various fluorescent filters. (A) Examples of coronal slices of mouse brains visualized using operating microscope with various fluorescent filters for gross view and protoporphyrin IX (PpIX), fluorescein sodium (FNa), and indocyanine green (ICG) fluorescence. No visible PpIX fluorescence was detected using the operating microscope. Some tumors showed visible FNa fluorescence (top row); however, most were FNa negative (bottom row). ICG did not show visible fluorescence in GB3 tumors but highlighted the choroid plexus. FNa stained normal tissue at the base of the brain, at the choroid plexus (Ch. Plexus), and around the third ventricle. Red fluorescence protein (RFP) visualized under a confocal microscope was used as a reference to identify tumors, indicated as positive (P). (B) Comparison of the percentages of true-positive (TP), false-negative (FN), and false-positive (FP) areas between PpIX and FNa fluorescence. Among 8 GB3 samples analyzed (6 animals), 0 (0%) had TP findings, 8 (100%) had FN findings, and 0 (0%) had FP findings of areas of tumor with PpIX fluorescence. With FNa fluorescence, 4 (50%) samples had TP findings, 5 (63%) had FN findings, and 7 (88%) had FP finding of areas of tumor. More TP fluorescent areas were seen with FNa fluorescence than with PpIX (p<0.01); however, these areas were seen in only 50% of the tumors (p=0.08). Used with permission from Barrow Neurological Institute, Phoenix, Arizona.
Figure 3
Figure 3
In utero electroporation glioma model with and without red fluorescence protein (IUE +RFP and IUE -RFP, respectively) visualized using operating microscope with various fluorescent filters. (A) Examples of gross view, protoporphyrin IX (PpIX), fluorescein sodium (FNa), and indocyanine green (ICG) fluorescence. In IUE +RFP tumors, PpIX highlighted the bulk of the tumors; however, the peripheries of large and small tumors were PpIX negative. True-positive (TP), false-negative (FN), and positive (P) findings are indicated where appropriate. (B) Comparison of percentages of TP, FN, and false-positive (FP) areas between PpIX and FNa fluorescence. We were able to calculate the percentage of visualized areas and determine the staining pattern of PpIX in the IUE +RFP model compared with the IUE -RFP model. Strong fluorescence of RFP under YELLOW 560 mode did not permit reliable detection of TP FNa in IUE +RFP tumors; therefore, it was not calculated in this model. However, in small tumors, where bright FP FNa fluorescence of the normal brain areas was obvious and RFP signal was not as bright and did not oversaturate the image, we were able to assess FP and FN FNa percentages. We used RFP fluorescence visualized under confocal microscope and hematoxylin and eosin (H&E)–stained sections as a reference to identify tumor locations. Among 87 IUE +RFP samples (13 animals), 58 (67%) had TP findings, 75 (86%) had FN findings, and 17 (20%) had FP findings of areas of tumor with PpIX fluorescence. Areas of tumor with TP FNa fluorescence were not calculated because of overlapping strong RFP fluorescence. FN areas were observed in 87 (100%) samples, and FP areas were observed in 51 (59%) samples. Significantly fewer FN and FP fluorescent areas were found with PpIX fluorescence than with FNa (both p<0.01). (C) Among 58 IUE -RFP samples (7 animals), 45 (78%) had TP findings, 13 (22%) had FN findings, and 0 (0%) had FP findings with PpIX fluorescence. With FNa fluorescence, 38 (66%) samples had TP findings, 27 (47%) samples had FN findings, and 53 (91%) samples had FP findings. Significantly fewer FN and FP fluorescent areas were observed with PpIX fluorescence than with FNa (both p<0.01). (D) Relation between percentage of specimens and overlap between PpIX and RFP fluorescence. PpIX-positive fluorescence covering 80% of the tumor was observed in only 22% of specimens, 50% overlap was observed in 47% of specimens, and at least 20% overlap was observed in 68% of specimens. Used with permission from Barrow Neurological Institute, Phoenix, Arizona.
Figure 4
Figure 4
Confocal imaging of coronal brain slices with GL261 gliomas. (A) Most tumors presented as large uniform mass highlighted equally well by protoporphyrin IX (PpIX) and fluorescein sodium (FNa). (B) In some areas, however, PpIX highlighted tumor areas that were not highlighted by FNa. Presence of the tumor in false-negative (FN) FNa areas is evident in the hematoxylin and eosin (H&E) stain. (C) A confocal image at the tumor border shows large, atypical cells with intracellular PpIX accumulation at the bottom of the image. FNa has typical extracellular distribution, creating shadows of unstained cells. Note sparse PpIX-positive cells in the normal brain at the top of the image. Reflection (r488) shows normal brain axons in white, and Hoechst stain highlights nuclei in blue. (D) GL261 tumor cells have various PpIX staining patterns. Note heterogeneous staining of the cells in the top left image and intracellular granules with PpIX on the top right image. Another field of view at the bottom demonstrates that not all GL261 cells accumulate PpIX and that the degree of accumulation varies. The contours of all cells are shown in reflection r488 mode for reference. (E) Quantitative comparison of the percentages of true-positive (TP), FN, and false-positive (FP) areas between PpIX and FNa fluorescence seen on confocal images. Among 26 GL261 samples (6 animals), 25 (96%) had TP findings, 7 (27%) had FN findings, and 5 (19%) had FP findings with PpIX fluorescence. With FNa fluorescence, 25 (96%) samples had TP findings, 3 (12%) samples had FN findings, and 16 (62%) samples had FP findings. A lower percentage of FP areas was found with PpIX fluorescence than with FNa (p<0.02). Used with permission from Barrow Neurological Institute, Phoenix, Arizona.
Figure 5
Figure 5
Confocal imaging of coronal brain slices with GB3 gliomas. (A) The top row shows tumors in both hemispheres with detectable protoporphyrin IX (PpIX) and fluorescein (FNa) fluorescent signal. Note false-positive (FP) PpIX and FNa fluorescence in the areas with permeable blood-brain barrier, such as the third ventricle, ependymal area, and choroidal plexus. Red fluorescence protein (RFP) was used as a reference for locating the tumor. The bottom row shows an example of a smaller GB3 glioma with false-negative (FN) PpIX and FNa fluorescence. The inset shows RFP-positive tumor enlarged. (B) Example of RFP-positive tumor in the basal ganglia with mildly positive PpIX signal and negative FNa fluorescence. The inset shows a large, tiled scan of the coronal brain slice and square area from which the image was taken. The oval area shows the region from which spectroscopic measurements shown in panel C were taken. (C) Diagram showing spectroscopic confirmation of PpIX presence (smaller peak at 633 nm) and negative brain area as a control in a GB3 tumor sample shown in panel (B). (D) Quantitative comparison of the percentages of true-positive (TP), FN, and FP areas between PpIX and FNa fluorescence seen on confocal images. Among 10 GB3 samples (6 animals), 9 (90%) had TP findings, 4 (40%) had FN findings, and 9 (90%) had FP findings with PpIX fluorescence. With FNa fluorescence, 3 (30%) samples had TP findings, 8 (80%) samples had FN findings, and 9 (90%) samples had FP findings. A higher percentage of TP areas was found with PpIX fluorescence than with FNa (p=0.02). Low PpIX accumulation in the GB3 model, as evidenced by low PpIX fluorescence signal, made it difficult to identify tumor. Used with permission from Barrow Neurological Institute, Phoenix, Arizona.
Figure 6
Figure 6
Confocal imaging of coronal brain slices with in utero electroporation gliomas with and without red fluorescence protein (IUE +RFP and IUE -RFP, respectively). (A) Top row demonstrates example of a large IUE +RFP glioma with positive protoporphyrin IX (PpIX) fluorescence findings. Fluorescein sodium (FNa) was detected both in the tumor and in normal brain, which made it impossible to differentiate the tumor border. RFP was used as a reference for identification of the tumor. The bottom row shows large, complex IUE +RFP glioma highlighted with PpIX fluorescence. Some of the tumor accumulated FNa, but most of the tumor did not show significant FNa accumulation compared to the normal brain. Also note the false-positive (FP) PpIX and FNa fluorescence of the base of the brain and at the third ventricle. (B) The top row shows an example of a large IUE -RFP glioma that had significant PpIX accumulation of various degrees. Heatmap diagram demonstrates intensity of PpIX signal (red indicates high intensity, and blue indicates low intensity). Note the large necrotic core devoid of PpIX and FNa fluorescence as well as areas with FP FNa fluorescence. FNa signal was increased in some tumor areas but did not provide sufficient contrast to identify the tumor border. The bottom row shows smaller IUE -RFP glioma in the corpus callosum with true-positive (TP) PpIX and false-negative (FN) FNa fluorescence. Hematoxylin and eosin (H&E)–stained slices were used as a reference to identify the location of IUE -RFP gliomas. (C) A higher magnification confocal image shows accumulation of PpIX and FNa in the glioma on the right side of the specimen, with a reflectance image showing organized normal brain white matter nerve fibers on the left. Circle shows the area where spectroscopic measurements were taken. (D) Diagram shows an example of spectroscopic confirmation of PpIX presence in an IUE -RFP sample. (E) Quantitative comparison of the TP, FN, and FP percentages between PpIX and FNa seen on confocal images. Among 16 IUE +RFP samples (8 animals), 16 (100%) had TP findings, 2 (13%) had FN findings, and 4 (25%) had FP findings with PpIX fluorescence. With FNa fluorescence, 3 (19%) samples had TP findings, 15 (94%) samples had FN findings, and 10 (63%) samples had FP findings. PpIX fluorescence was associated with a higher percentage of TP areas (p<0.01) and a lower percentage of FN and FP fluorescent areas (p<0.01 and p=0.03, respectively). (F) Among 24 IUE -RFP samples (15 animals), 24 (100%) had TP findings, 5 (21%) had FN findings, and 4 (17%) had FP findings with PpIX fluorescence. With FNa fluorescence, 14 (58%) samples had TP findings, 16 (67%) samples had FN findings, and 21 (88%) samples had FP findings. PpIX fluorescence was associated with a higher percentage of TP areas and a lower percentage of FN and FP areas (all p<0.01). Used with permission from Barrow Neurological Institute, Phoenix, Arizona.
Figure 7
Figure 7
Comparison of fluorescence intensities as measured by tumor-to-background ratio (TBR) among GL261, GB3, and in utero electroporation with and without red fluorescence protein (IUE +RFP and IUE -RFP, respectively) gliomas. (A) Operating microscopy showed significant differences in TBR among different fluorophores (p<0.01). Among GL261 tumors, the protoporphyrin IX (PpIX) TBR (mean [SD], 5.6 [3.0]; n=13) was significantly higher than the TBR for fluorescein sodium (FNa) (mean [SD], 1.4 [0.5]; n=63) or indocyanine green (ICG) (mean [SD], 2.9 [2.5]; n=31) (both p<0.01). GB3 gliomas have no significant PpIX fluorescence and were excluded from analysis. Mean (SD) PpIX fluorescence TBR in IUE +RFP gliomas was 3.4 (1.6) (n=75). In IUE -RFP gliomas, mean (SD) TBR was higher for PpIX fluorescence (3.4 [2.1]; n=46) than for FNa (1.3 [0.3]; p<0.01). GL261 gliomas showed higher TBR than both IUE models (both p<0.01). Differences in FNa TBR between GL261 and IUE -RFP gliomas were not significant (p=0.17). (B) Comparison of TBR of PpIX fluorescence detected by confocal microscope. (C) Comparison of TBR of FNa fluorescence detected by confocal microscope. Used with permission from Barrow Neurological Institute, Phoenix, Arizona.

Similar articles

Cited by

References

    1. Koc K, Anik I, Cabuk B, Ceylan S. Fluorescein sodium-guided surgery in glioblastoma multiforme: a prospective evaluation. Br J Neurosurg (2008) 22(1):99–103. doi: 10.1080/02688690701765524 - DOI - PubMed
    1. Zhao S, Wu J, Wang C, Liu H, Dong X, Shi C, et al. . Intraoperative fluorescence-guided resection of high-grade malignant gliomas using 5-aminolevulinic acid-induced porphyrins: a systematic review and meta-analysis of prospective studies. PloS One (2013) 8(5):e63682. doi: 10.1371/journal.pone.0063682 - DOI - PMC - PubMed
    1. Stummer W, Pichlmeier U, Meinel T, Wiestler OD, Zanella F, Reulen HJ, et al. . Fluorescence-guided surgery with 5-aminolevulinic acid for resection of malignant glioma: a randomised controlled multicentre phase III trial. Lancet Oncol (2006) 7(5):392–401. doi: 10.1016/S1470-2045(06)70665-9 - DOI - PubMed
    1. Chen B, Wang H, Ge P, Zhao J, Li W, Gu H, et al. . Gross total resection of glioma with the intraoperative fluorescence-guidance of fluorescein sodium. Int J Med Sci (2012) 9(8):708–14. doi: 10.7150/ijms.4843 - DOI - PMC - PubMed
    1. Stummer W, Stocker S, Wagner S, Stepp H, Fritsch C, Goetz C, et al. . Intraoperative detection of malignant gliomas by 5-aminolevulinic acid-induced porphyrin fluorescence. Neurosurgery (1998) 42(3):518–25. doi: 10.1097/00006123-199803000-00017 - DOI - PubMed

LinkOut - more resources