. 2023 May 23:14:1192604.
doi: 10.3389/fimmu.2023.1192604. eCollection 2023.

Simultaneous co-infection with swine influenza A and porcine reproductive and respiratory syndrome viruses potentiates adaptive immune responses

Affiliations

Simultaneous co-infection with swine influenza A and porcine reproductive and respiratory syndrome viruses potentiates adaptive immune responses

Tiphany Chrun et al. Front Immunol. .

Abstract

Porcine respiratory disease is multifactorial and most commonly involves pathogen co-infections. Major contributors include swine influenza A (swIAV) and porcine reproductive and respiratory syndrome (PRRSV) viruses. Experimental co-infection studies with these two viruses have shown that clinical outcomes can be exacerbated, but how innate and adaptive immune responses contribute to pathogenesis and pathogen control has not been thoroughly evaluated. We investigated immune responses following experimental simultaneous co-infection of pigs with swIAV H3N2 and PRRSV-2. Our results indicated that clinical disease was not significantly exacerbated, and swIAV H3N2 viral load was reduced in the lung of the co-infected animals. PRRSV-2/swIAV H3N2 co-infection did not impair the development of virus-specific adaptive immune responses. swIAV H3N2-specific IgG serum titers and PRRSV-2-specific CD8β+ T-cell responses in blood were enhanced. Higher proportions of polyfunctional CD8β+ T-cell subset in both blood and lung washes were found in PRRSV-2/swIAV H3N2 co-infected animals compared to the single-infected groups. Our findings provide evidence that systemic and local host immune responses are not negatively affected by simultaneous swIAV H3N2/PRRSV-2 co-infection, raising questions as to the mechanisms involved in disease modulation.

Keywords: immune response; pig; porcine reproductive and respiratory syndrome virus; swine influenza A virus; viral co-infection.


Conflict of interest statement

The authors declare that the research was conducted in the absence of any commercial or financial relationships that could be construed as a potential conflict of interest.

Figures
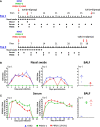
Figure 1
Figure 1
Effect of PRRSV-2 single infection and H3N2 co-infection on viral loads. (A) In the first experiment (Exp 1), eighteen 5–7-week-old pigs were randomly assigned to three groups (n = 6) and intranasally challenged with 1 × 10⁶ pfu of H3N2, 105 TCID50 PRRSV-2, or simultaneously with 1 × 10⁶ pfu of H3N2 and 105 TCID50 PRRSV-2. In a second experiment (Exp 2), a higher dose of H3N2 at 5 × 10⁶ pfu was used in the single-infected and PRRSV-2/H3N2 co-infected animals. Pigs were culled to assess lung lesions at 5 dpi (n = 3 in Exp 1) or kept until ~6 weeks post-challenge (n = 3 in Exp 1 and n = 6 in Exp 2). Nasal swabs and blood samples were collected on the indicated day by a dot at the corresponding timepoints for both experiments. (B) H3N2 titers (pfu/ml) in nasal swabs and bronchoalveolar lavage fluid (BALF) were measured by plaque assay. (C) PRRSV-2 viral RNA copy numbers/ml in serum and BALF were assessed by qRT-PCR specific to PRRSV-2 ORF7. The mean values of viral loads in nasal swabs and sera for each group ± SD are indicated (n = 3 per group from 5 dpi in Exp 1 or n = 6 per group in Exp 2). Individual values of viral loads in BALF are represented by a symbol, and the mean is indicated by a horizontal bar (n = 3 per group). Comparisons between two groups were performed using the Mann–Whitney test. ND, not done.
Figure 2
Figure 2
Effects of PRRSV-2/H3N2 co-infection on antibody responses. (A) H3N2-specific or (B) PRRSV-2 IgG titers in serum collected longitudinally (both Exp 1 and Exp 2) and in bronchoalveolar lavage fluid (BALF) collected at 41 dpi (Exp 1) were assessed by ELISA. (C) H3N2 and (D) PRRSV-2 neutralizing antibody titers in serum were assessed longitudinally by microneutralization (MN) and virus neutralization test (VNT). The mean value ± SD for each group (serum) or individual value and the mean in the indicated group (BALF) are represented. The H3N2 and PRRSV-2 loads’ area under the curve (Table 1) values were calculated over the time course for each animal. Comparisons between two groups were made using the Mann–Whitney test.
Figure 3
Figure 3
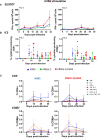
H3N2-specific polyfunctional T-cell responses in peripheral blood mononuclear cell (PBMC) following PRRSV-2/H3N2 co-infection. (A) IFN-γ secretion by PBMCs isolated weekly was determined by ELISpot assay. Cells were restimulated in vitro for 18 h with H3N2 (multiplicity of infection (MOI) 3.4) or cultured with medium. Corrected H3N2-specific IFN-γ-producing cells (minus unstimulated controls) were calculated per 106 PBMC. (B) Total frequency of H3N2-specific cytokine (IFN-γ, TNF, and IL-2) production within CD4+ and CD8β+ T cells was determined by intracellular cytokine staining. Cells were restimulated in vitro for 18 h with H3N2 (MOI 0.1) or cultured with medium. Single, double, and triple IFN-γ-, TNF-, and IL-2-expressing CD4+ and CD8β+ T cells were analyzed by Boolean gate analysis. The corrected frequency values are shown (percentage of cytokine-producing cells minus unstimulated controls). The non-specific T-cell responses at 0 dpi were further subtracted from the T-cell responses at 14, 28, and 34 dpi. (C) Frequencies of single- and double-cytokine producers in CD4+ and CD8β+ T cells. The mean values ± SD (A, C) for each group or individual data and the mean ± SD are indicated (n = 3 per group in Exp 1 or n = 6 per group in Exp 2). Comparisons between two groups were made using the Mann–Whitney test.
Figure 4
Figure 4
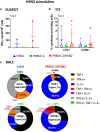
H3N2-specific polyfunctional T-cell responses in bronchoalveolar lavage fluid cells (BALCs) following PRRSV-2/H3N2 co-infection. (A) IFN-γ secretion by BALCs isolated at the cull (41 dpi) was determined by ELISpot assay. (B) Total frequency of H3N2-specific cytokines production within the CD4+ and CD8β+ T cells in BALCs collected at the end of the study (36/38 dpi) was determined by intracellular cytokine staining. Corrected frequencies of total single, double, and triple IFN-γ-, TNF-, and IL-2-producing CD4+ and CD8β+ T cells are shown. (C) Pie charts represent the average proportion of CD4+ and CD8β+ T cells that produced between one and three cytokines simultaneously. Individual data are indicated (n = 3 per group in Exp 1 or n = 6 per group in Exp 2). Comparisons between two groups were made using the Mann–Whitney test.
Figure 5
Figure 5
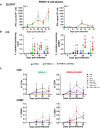
PRRSV-2-specific polyfunctional T-cell responses in peripheral blood mononuclear cell (PBMC) following PRRSV-2/H3N2 co-infection. (A) IFN-γ secretion by PBMCs was determined by ELISpot after stimulation with PRRSV-2 (multiplicity of infection (MOI) 3.2) or cultured with medium for 18 h. The corrected PRRSV-2-specific IFN-γ-producing cells (minus unstimulated controls) were calculated. (B) Total frequency of PRRSV-2-specific cytokine production within the CD4+ and CD8β+ T cells was determined by intracellular cytokine staining. Cells were restimulated in vitro for 18 h with PRRSV-2 (MOI 0.1) or cultured with medium. Total single, double, and triple IFN-γ-, TNF-, and IL-2-producing CD4+ and CD8β+ T cells were calculated as described in Figure 3. (C) Frequencies of single- and double-cytokine producers in CD4+ and CD8β+ T cells. The mean values + SD (A, C) for each group or individual data and the mean ± SD are indicated (n = 3 per group in Exp 1 or n = 6 per group in Exp 2). Comparisons between two groups were made using the Mann–Whitney test.
Figure 6
Figure 6
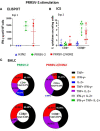
PRRSV-2-specific polyfunctional T-cell responses in bronchoalveolar lavage fluid cells (BALCs) following PRRSV-2/H3N2 co-infection. (A) IFN-γ secretion by BALCs isolated at the cull (41 dpi) was determined by ELISpot assay. (B) Total frequency of PRRSV-2-specific cytokines production within the CD4+ and CD8β+ T cells in BALCs collected at the end of study (36/38 dpi) was determined by intracellular cytokine staining as described in Figure 3. Corrected frequencies of total single, double, and triple IFN-γ-, TNF-, and IL-2-producing CD4+ and CD8β+ T cells are shown. (C) Pie charts represent the mean proportion of single, double, and triple cytokine producers in CD4+ and CD8β+ T cells. Individual data are indicated (n = 3 per group in Exp 1 or n = 6 per group in Exp 2). Comparisons between two groups were made using the Mann–Whitney test.

References

    1. Neumann EJ, Kliebenstein JB, Johnson CD, Mabry JW, Bush EJ, Seitzinger AH, et al. . Assessment of the economic impact of porcine reproductive and respiratory syndrome on swine production in the united states. J Am Vet Med Assoc (2005) 227(3):385–92. doi: 10.2460/javma.2005.227.385 - DOI - PubMed
    1. Assavacheep P, Thanawongnuwech R. Porcine respiratory disease complex: dynamics of polymicrobial infections and management strategies after the introduction of the African swine fever. Front Vet Sci (2022) 9:1048861. doi: 10.3389/fvets.2022.1048861 - DOI - PMC - PubMed
    1. Choi YK, Goyal SM, Joo HS. Retrospective analysis of etiologic agents associated with respiratory diseases in pigs. Can Vet J (2003) 44(9):735–7. - PMC - PubMed
    1. Fablet C, Marois-Crehan C, Simon G, Grasland B, Jestin A, Kobisch M, et al. . Infectious agents associated with respiratory diseases in 125 farrow-to-finish pig herds: a cross-sectional study. Vet Microbiol (2012) 157(1-2):152–63. doi: 10.1016/j.vetmic.2011.12.015 - DOI - PubMed
    1. Walker PJ, Siddell SG, Lefkowitz EJ, Mushegian AR, Adriaenssens EM, Alfenas-Zerbini P, et al. . Recent changes to virus taxonomy ratified by the international committee on taxonomy of viruses (2022). Arch Virol (2022) 167(11):2429–40. doi: 10.1007/s00705-022-05516-5 - DOI - PMC - PubMed

Publication types