. 2023 May 23:14:1177245.
doi: 10.3389/fimmu.2023.1177245. eCollection 2023.

Lack of strong innate immune reactivity renders macrophages alone unable to control productive Varicella-Zoster Virus infection in an isogenic human iPSC-derived neuronal co-culture model

Affiliations

Lack of strong innate immune reactivity renders macrophages alone unable to control productive Varicella-Zoster Virus infection in an isogenic human iPSC-derived neuronal co-culture model

Elise Van Breedam et al. Front Immunol. .

Abstract

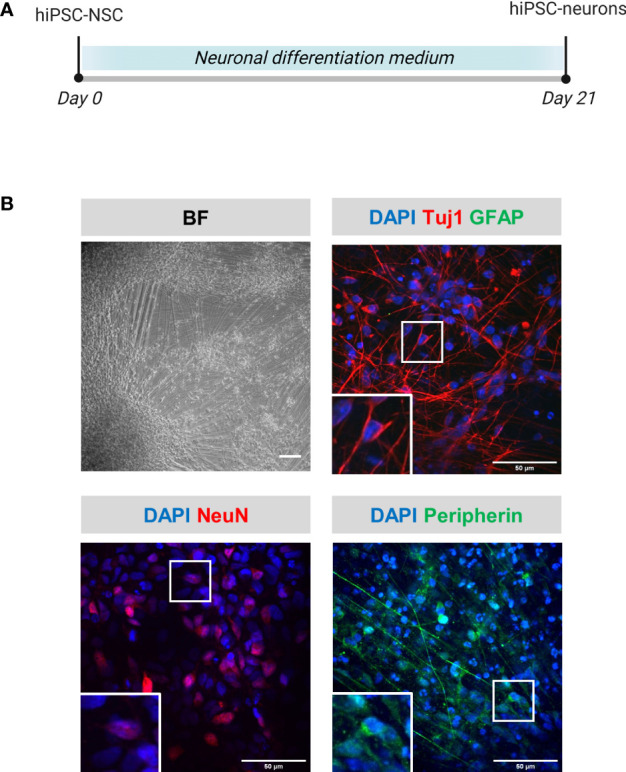
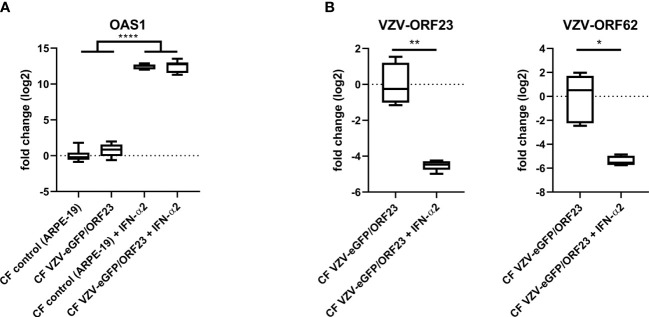
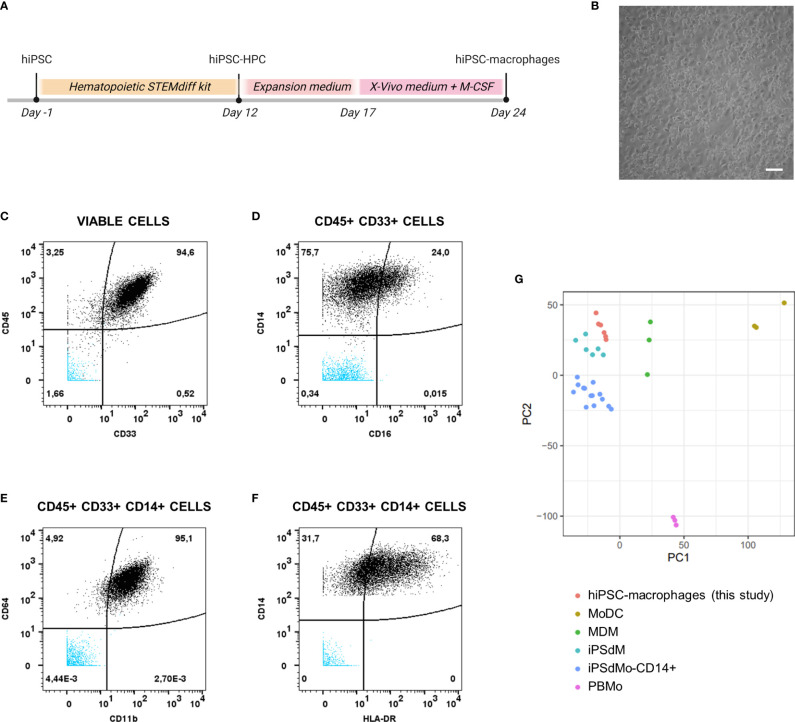
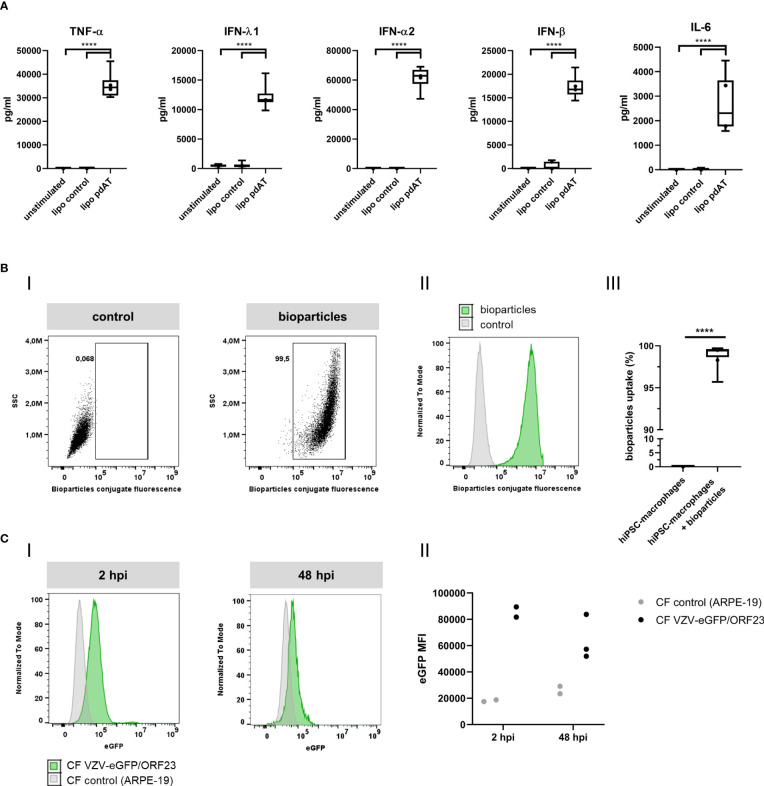
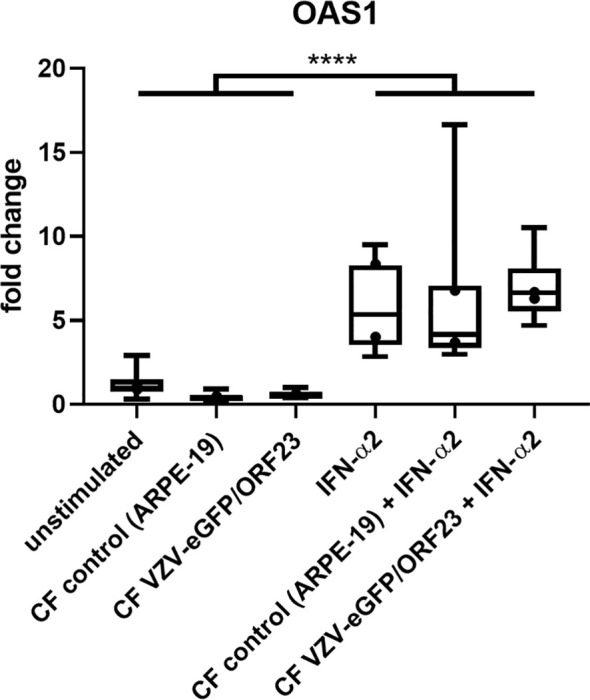
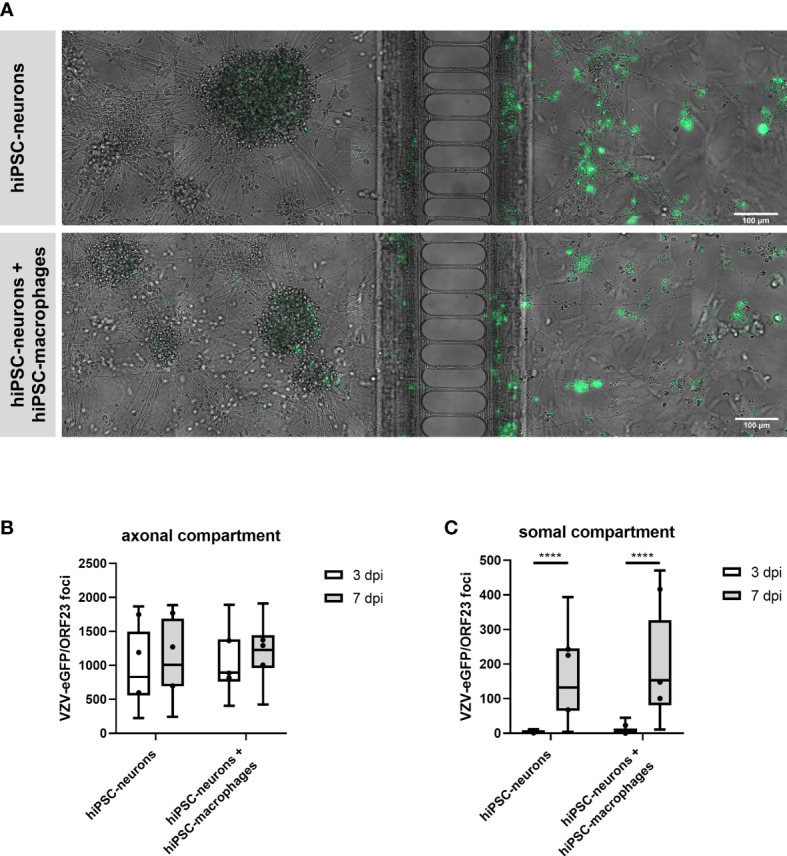
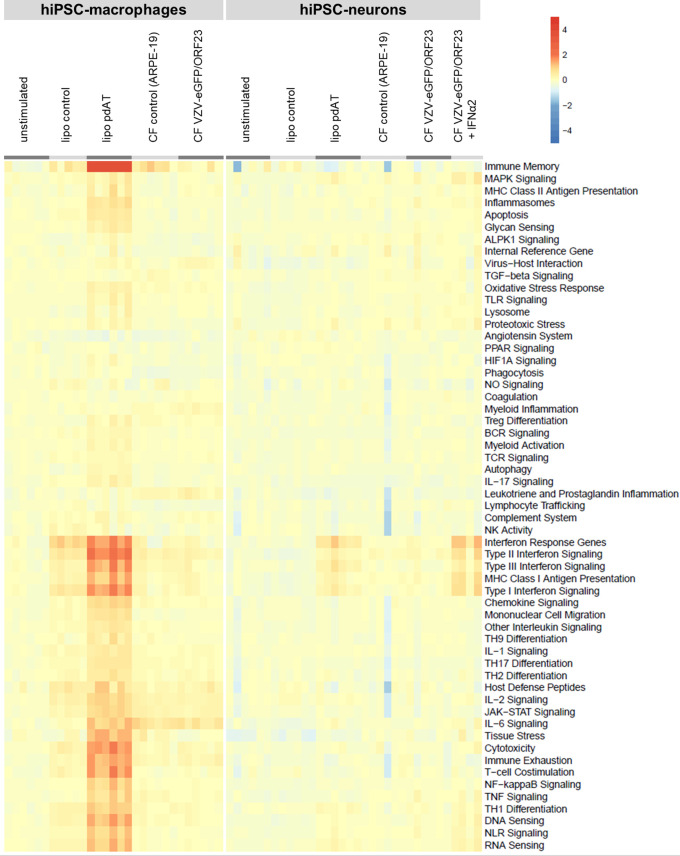
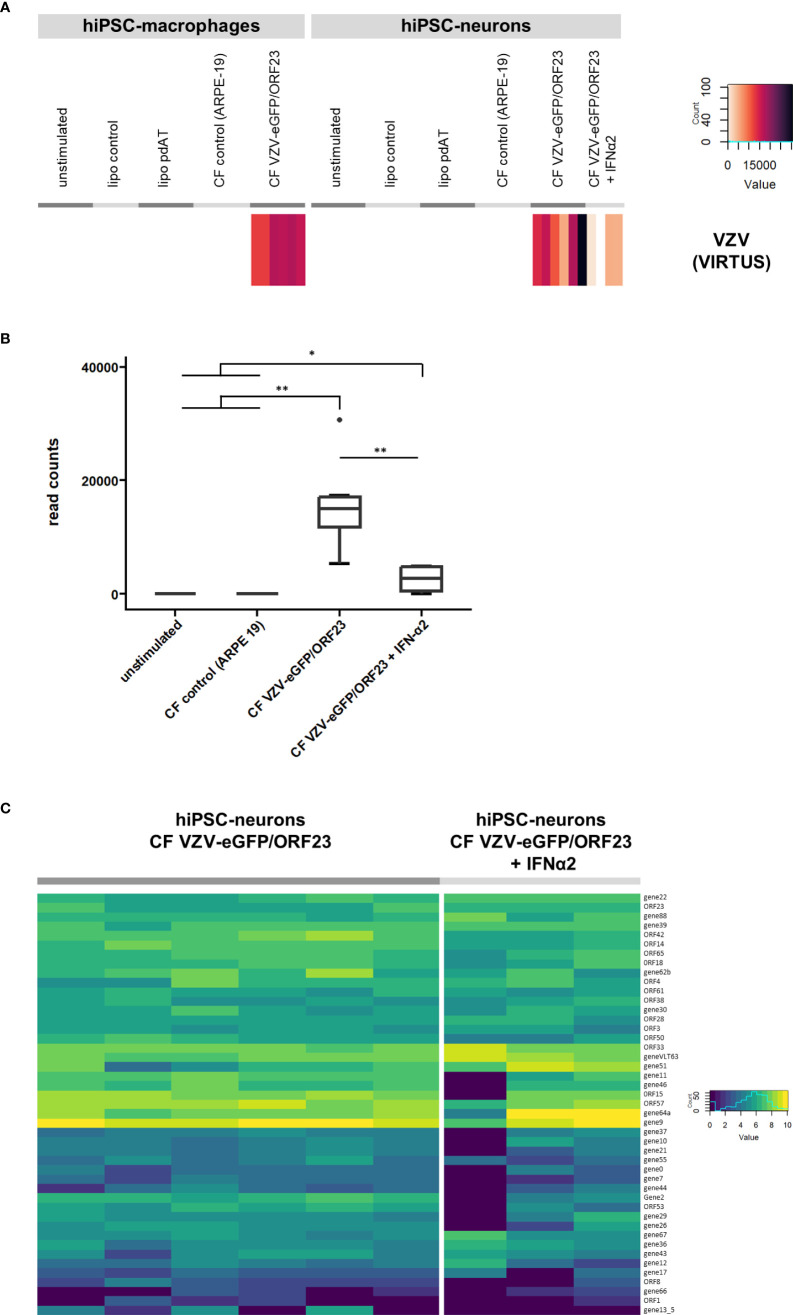
With Varicella-Zoster Virus (VZV) being an exclusive human pathogen, human induced pluripotent stem cell (hiPSC)-derived neural cell culture models are an emerging tool to investigate VZV neuro-immune interactions. Using a compartmentalized hiPSC-derived neuronal model allowing axonal VZV infection, we previously demonstrated that paracrine interferon (IFN)-α2 signalling is required to activate a broad spectrum of interferon-stimulated genes able to counteract a productive VZV infection in hiPSC-neurons. In this new study, we now investigated whether innate immune signalling by VZV-challenged macrophages was able to orchestrate an antiviral immune response in VZV-infected hiPSC-neurons. In order to establish an isogenic hiPSC-neuron/hiPSC-macrophage co-culture model, hiPSC-macrophages were generated and characterised for phenotype, gene expression, cytokine production and phagocytic capacity. Even though immunological competence of hiPSC-macrophages was shown following stimulation with the poly(dA:dT) or treatment with IFN-α2, hiPSC-macrophages in co-culture with VZV-infected hiPSC-neurons were unable to mount an antiviral immune response capable of suppressing a productive neuronal VZV infection. Subsequently, a comprehensive RNA-Seq analysis confirmed the lack of strong immune responsiveness by hiPSC-neurons and hiPSC-macrophages upon, respectively, VZV infection or challenge. This may suggest the need of other cell types, like T-cells or other innate immune cells, to (co-)orchestrate an efficient antiviral immune response against VZV-infected neurons.

Keywords: RNA-seq analysis; axonal infection; iPSC; innate immune response; macrophages; neuronal models; neurons; varicella zoster virus.


Conflict of interest statement

CM, PR and MA-R are affiliated with the Centre for Genomics and Oncological Research (GENYO), Pfizer-University of Granada-Junta de Andalucía, whereby Pfizer is solely the owner of the build-ing and provides funding for maintenance of the building. The remaining authors declare that the research was conducted in the absence of any commercial or financial relationships that could be construed as a potential conflict of interest.

Figures

Figure 1
Figure 1
Phenotypical characterization of hiPSC-neurons. (A) Schematic overview of the differentiation protocol of hiPSC-neurons. (B) Representative brightfield (BF) and immunofluorescent microscopic images of hiPSC-neurons obtained at the end of the differentiation protocol (day 21). hiPSC-neurons were stained for the neuronal markers Tuj1 and NeuN, the astrocyte marker GFAP and the PNS neuronal marker peripherin. Scale bars indicate 100µm and 50µm, for BF and immunofluorescent images, resp. (hiPSC-NSC, hiPSC-derived neural stem cells).
Figure 2
Figure 2
hiPSC-neurons are irresponsive to VZV-infection without exogenous IFN-α2. (A) OAS1 RT-qPCR data of hiPSC-neurons after infection with CF VZV-eGFP/ORF23 or CF control (ARPE-19), with or without IFN-α2 treatment. For each condition n = 5-6, measured in duplicate. (B) VZV-ORF23 and VZV-ORF62 RT-qPCR data of hiPSC-neurons after infection with CF VZV-eGFP/ORF23 or CF control (ARPE-19), with or without IFN-α2 treatment. For each condition n = 5-6, measured in duplicate. *p<0.05, **p<0.01, ****p<0.0001.
Figure 3
Figure 3
Phenotypical and molecular characterization of hiPSC-macrophages. (A) Schematic overview of the differentiation protocol of hiPSC-derived macrophages. (B) Representative brightfield microscopic image of hiPSC-derived macrophages obtained at the end of the differentiation protocol (day 24). Scale bar 50µm. (C–F) Mass cytometry analysis of hiPSC-derived macrophages immunolabeled for the hematopoietic cell marker CD45, the myeloid marker CD33 and the monocyte/macrophage markers CD14, CD16, CD64, CD11b, and HLA-DR. Data shown here are from a representative sample, i.e. sample from the experiment of which the proportion of marker positive cells is closest to the overall mean value of the three independent experiments combined, depicted in Table 3 . The population subsets are given on top of the corresponding plots. Unstained hiPSC-macrophage population is visible in blue. (G) Principal component analysis of expressed genes obtained by bulk RNA-sequencing for the generated hiPSC-macrophages derived from two independent differentiations (n=3 per differentiation) along with primary and iPSC-derived myeloid subtypes available from a public dataset (34). The top 2 principal components were used. (hiPSC-HPC, hiPSC-derived hematopoietic progenitor cell; MoDC, human primary monocyte-derived dendritic cell; MDM, human primary monocyte-derived macrophages; iPSdM, iPSC-derived macrophages; iPsdMo-CD14+, iPSC-derived CD14+ monocytes; PBMo, human primary monocytes).
Figure 4
Figure 4
Functional characterization of hiPSC-macrophages. (A) Anti-viral cytokine concentrations in the culture supernatants of hiPSC-macrophages transfected with 0.25 µg/ml pdAT using lipofectamine, stimulated with lipofectamine alone or unstimulated for 24h, obtained by LEGENDplex. Data were obtained from two independent experiments with n = 5-6 per condition, measured in duplicate. The box plots indicate median and interquartile range, whiskers indicate the minimum and maximum values of the two independent experiments combined. The dots indicate the median value of each individual experiment. (B) Phagocytosis of fluorescent S. aureus bioparticles by hiPSC-macrophages. (i) Representative image of gating strategy to determine the relative number of hiPSC-macrophages that phagocytosed fluorescent S. aureus bioparticles. (ii) Representative histogram (i.e. histogram from sample with median bioparticle uptake closest to the overall median bioparticle uptake of all experiments combined from Figure iii) of hiPSC-macrophages demonstrating their phagocytic capacity. Grey, control hiPSC-macrophages; green, hiPSC-macrophages with addition of bioparticles. (iii) Quantification of the relative number of phagocytic hiPSC-macrophages, represented as percentage bioparticles uptake in the graph. Data obtained from two independent experiments with n = 1-2 for control hiPSC-macrophages (hiPSC-macrophages) and n = 3-6 for hiPSC-macrophages with addition of bioparticles (hiPSC-macrophages + bioparticles) per experiment. The box plots indicate median and interquartile range, whiskers indicate the minimum and maximum values of the two independent experiments combined. The dots indicate the median value of each individual experiment. (C) Phagocytosis of fluorescent CF VZV-eGFP/ORF23 by hiPSC-macrophages at 2hpi and 48hpi. (i) Representative histogram of hiPSC-macrophages demonstrating their phagocytic capacity of CF VZV-eGFP/ORF23 at 2hpi and 48hpi. Grey, hiPSC-macrophages incubated with CF control (ARPE-19); green, hiPSC-macrophages incubated with CF VZV-eGFP/ORF23. (ii) Median fluorescence intensity (MFI) of eGFP signal of hiPSC-macrophages incubated with CF control (ARPE-19) or CF VZV-eGFP/ORF23 for 2 or 48h. The dots indicate values of individual experiments. (pdAT, poly(dA:dT); hpi, hours post-infection) ****p<0.0001.
Figure 5
Figure 5
hiPSC-macrophages do not upregulate OAS1 mRNA following VZV-infection without exogenous IFN-α2. OAS1 RT-qPCR data of hiPSC-macrophages stimulated with CF VZV-eGFP/ORF23 or CF control (ARPE-19), with or without simultaneous IFN-α2 treatment for 48h. Only IFN-α2-stimulated and unstimulated hiPSC-macrophages were included in this experimental set-up. Data were obtained from two independent experiments with per experiment n = 4-6 per condition, measured in duplicate. The box plots indicate median and interquartile range, whiskers indicate the minimum and maximum values of the two independent experiments combined. The dots indicate the median value of each individual experiment. ****p<0.0001.
Figure 6
Figure 6
hiPSC-macrophages are unable to control VZV-infection in hiPSC-neurons in a compartmentalized neuronal model. (A) Representative images of hiPSC-neuronal cultures with or without hiPSC-macrophages in the somal compartment at day 7 after inoculation with ARPE-19-associated VZV-eGFP/ORF23 in the axonal compartment. Scale bar 100 µm. (B, C) Quantification of the number of VZV-eGFP/ORF23 foci present in the axonal compartment (B) or somal compartment (C) at 3 dpi and 7 dpi. Data were obtained from three independent experiments with n = 4-8 for hiPSC-neurons and n = 5-8 for hiPSC-neurons + hiPSC-macrophages per experiment. The box plots indicate median and interquartile range, whiskers indicate the minimum and maximum values of the three independent experiments combined. The dots indicate the median value of each individual experiment. ****p<0.0001.
Figure 7
Figure 7
Transcriptomic profile of hiPSC-macrophages and hiPSC-neurons shows absence of a strong host immune response following VZV challenge, despite their immune competence. Heat-map shows the up-or downregulation of genes implicated in different host response pathways (retrieved from Nanostring) for the different conditions relative to the unstimulated control condition for hiPSC-macrophages or hiPSC-neurons.
Figure 8
Figure 8
Viral transcript analysis. (A) VZV viral transcripts recovered in VZV challenged hiPSC-macrophages and VZV-infected hiPSC-neurons. Heatmap showing the raw read count of reads mapping to the VZV reference genome, for the different conditions of hiPSC-macrophages or hiPSC-neurons. (B) Boxplot showing the reduction of VZV transcripts in hiPSC-neurons infected with VZV following treatment with exogenous IFN-α2. (C) Gene expression of VZV recovered in VZV-infected hiPSC-neurons. Heatmap showing the log2(n+1) normalized counts of reads mapping to VZV genes, for hiPSC-neurons infected with CF VZV-eGFP/ORF23 and those additionally treated with IFN-α2. *p<0.05. **p<0.01.

References

    1. Zerboni L, Sen N, Oliver SL, Arvin AM. Molecular mechanisms of varicella zoster virus pathogenesis. Nat Rev Microbiol (2014) 12(3):197–210. doi: 10.1038/nrmicro3215 - DOI - PMC - PubMed
    1. Carter-Timofte ME, Paludan SR, Mogensen TH. RNA Polymerase III as a gatekeeper to prevent severe VZV infections. Trends Mol Med (2018) 24(10):904–15. doi: 10.1016/j.molmed.2018.07.009 - DOI - PubMed
    1. Laing KJ, Ouwendijk WJD, Koelle DM, Verjans G. Immunobiology of varicella-zoster virus infection. J Infect Dis (2018) 218(suppl_2):S68–74. doi: 10.1093/infdis/jiy403 - DOI - PMC - PubMed
    1. Kennedy JJ, Steain M, Slobedman B, Abendroth A. Infection and functional modulation of human monocytes and macrophages by varicella-zoster virus. J Virol (2019) 93(3). doi: 10.1128/JVI.01887-18 - DOI - PMC - PubMed
    1. Haberthur K, Engelmann F, Park B, Barron A, Legasse A, Dewane J, et al. CD4 T cell immunity is critical for the control of simian varicella virus infection in a nonhuman primate model of VZV infection. PloS Pathog (2011) 7(11):e1002367. doi: 10.1371/journal.ppat.1002367 - DOI - PMC - PubMed

Publication types