. 2023 Aug;43(8):e339-e357.
doi: 10.1161/ATVBAHA.123.319145. Epub 2023 Jun 8.

Redox Dysregulation of Vascular Smooth Muscle Sirtuin-1 in Thoracic Aortic Aneurysm in Marfan Syndrome

Affiliations

Redox Dysregulation of Vascular Smooth Muscle Sirtuin-1 in Thoracic Aortic Aneurysm in Marfan Syndrome

Enkhjargal Budbazar et al. Arterioscler Thromb Vasc Biol. 2023 Aug.

Abstract

Background: Thoracic aortic aneurysms (TAAs) are abnormal aortic dilatations and a major cardiovascular complication of Marfan syndrome. We previously demonstrated a critical role for vascular smooth muscle (VSM) SirT1 (sirtuin-1), a lysine deacetylase, against maladaptive aortic remodeling associated with chronic oxidative stress and aberrant activation of MMPs (matrix metalloproteinases).

Methods: In this study, we investigated whether redox dysregulation of SirT1 contributed to the pathogenesis of TAA using fibrillin-1 hypomorphic mice (Fbn1mgR/mgR), an established model of Marfan syndrome prone to aortic dissection/rupture.

Results: Oxidative stress markers 3-nitrotyrosine and 4-hydroxynonenal were significantly elevated in aortas of patients with Marfan syndrome. Moreover, reversible oxidative post-translational modifications (rOPTM) of protein cysteines, particularly S-glutathionylation, were dramatically increased in aortas of Fbn1mgR/mgR mice, before induction of severe oxidative stress markers. Fbn1mgR/mgR aortas and VSM cells exhibited an increase in rOPTM of SirT1, coinciding with the upregulation of acetylated proteins, an index of decreased SirT1 activity, and increased MMP2/9 activity. Mechanistically, we demonstrated that TGFβ (transforming growth factor beta), which was increased in Fbn1mgR/mgR aortas, stimulated rOPTM of SirT1, decreasing its deacetylase activity in VSM cells. VSM cell-specific deletion of SirT1 in Fbn1mgR/mgR mice (SMKO-Fbn1mgR/mgR) caused a dramatic increase in aortic MMP2 expression and worsened TAA progression, leading to aortic rupture in 50% of SMKO-Fbn1mgR/mgR mice, compared with 25% of Fbn1mgR/mgR mice. rOPTM of SirT1, rOPTM-mediated inhibition of SirT1 activity, and increased MMP2/9 activity were all exacerbated by the deletion of Glrx (glutaredoxin-1), a specific deglutathionylation enzyme, while being corrected by overexpression of Glrx or of an oxidation-resistant SirT1 mutant in VSM cells.

Conclusions: Our novel findings strongly suggest a causal role of S-glutathionylation of SirT1 in the pathogenesis of TAA. Prevention or reversal of SirT1 rOPTM may be a novel therapeutic strategy to prevent TAA and TAA dissection/ruptures in individuals with Marfan syndrome, for which, thus far, no targeted therapy has been developed.

Keywords: Marfan syndrome; aorta; aortic aneurysm; lysine deacetylase; oxidative stress.


Conflict of interest statement

Disclosures None.

Figures

Figure 1.
Figure 1.
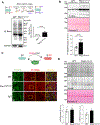
(A) Representative images of human aortic sections, from healthy (n=3) and Marfan (n=3) donors (circles, females; squares, males), stained for 3-nitrotyrosine (3-NT) and 4-hydroxynonenal (4-HNE), two indices of reactive oxygen species (ROS)-mediated oxidation of proteins and lipids, respectively. Quantitation of immunostaining signal in graph. Data expressed as fold change vs controls; p=0.04 for 3-NT, p=0.05 for 4-HNE, nested unpaired t-test. Scale bar = 50 μm. (B) ROS, mainly superoxide anion, assessed using DHE staining in aortic sections from WT (n=10) and Fbn1mgR/mgR (n=10) mice (circles, females; squares, males); p=0.03, unpaired Student’s t-test. Scale bar = 100 μm. Representative regions with intense DHE signal are magnified in the yellow box.
Figure 2.
Figure 2.
(A) Representative Western blot of total reversible oxidation of proteins (total ReOx) in aortas of WT (n=5) and Fbn1mgR/mgR (n=5) mice (circles, females; squares, males), measured using a biotin switch assay, as described in Materials & Methods. β-actin was used as loading control. The graph shows band intensity quantitation, and data are expressed as fold change versus WT; p=0.008, Mann-Whitney non-parametric test. (B) Representative Western blot of total protein glutathionylation (Pr-SSG), a form of reversible oxidation, in aortas of WT (n=6) and Fbn1mgR/mgR (n=5) mice (circles, females; squares, males). The graph shows quantitative results of Pr-SSG band intensities expressed as the ratio of corresponding Ponceau S membrane staining. Each lane represents one mouse; p=0.02, unpaired Student’s t-test. (C) Representative images, acquired at 40× magnification, of aortic sections from WT (n=3) and Fbn1mgR/mgR (n=3) mice after immunostaining with an anti-Pr-SSG antibody (scale bar: 10 μm). Elastin autofluorescence (in green) is shown to delineate the aortic wall. Representative regions with intense Pr-SSG signal are magnified in the yellow box. IgG indicates mouse IgG used as negative control for antibody specificity. (D) Representative Western blot of 3-nitrotyrosine (3-NT) and 4-hydroxynonenal (4-HNE), two indices of ROS-mediated irreversible oxidation of protein residues, in aortas of WT (n=6) and Fbn1mgR/mgR (n=5) mice (circles, females; squares, males). Each lane represents one mouse. Quantitation in graphs indicates 3-NT and 4-HNE band intensities expressed as ratio of corresponding Ponceau S membrane staining (p=0.58 and p=0.08, respectively, by unpaired Student’s t-test).
Figure 3.
Figure 3.
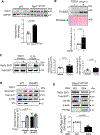
(A) Biotin switch assay to detect reversibly oxidized SirT1 (ReOx SirT1) in WT and Fbn1mgR/mgR VSMCs; n=7 replicate experiments. Circles and squares indicate VSMCs isolated from females and males mice, respectively. Band intensity quantitation, summarized in the graph, were calculated as the ratio of total SirT1 and expressed as fold change versus WT, for each experiment; p=0.05, unpaired Student’s t-test. (B) Representative Western blots for SirT1 and acetylated p53 at lysine 379 (Ac-p53), an index of SirT1 activity, in aortas of WT (n=4–15) and Fbn1mgR/mgR (n=5–13) mice (circles, females; squares, males); p<0.0001 and p=0.004, respectively, by unpaired Student’s t-test. (C) Graphic representation of Fbn1mgR/mgR mice with tamoxifen-inducible VSM-specific SirT1 deletion (SMKO-Fbn1mgR/mgR) and littermates (vehicle-treated) Fbn1mgR/mgR mice. Genotype PCR on biopsied tail DNA confirmed the presence of the Fbn1mgR/mgR allele (500bp band) in both vehicle- and tamoxifen-treated Fbn1mgR/mgR mice and the SirT1ex4 deletion (200bp band) after tamoxifen in SMKO-Fbn1mgR/mgR mice. (D) Top: Representative images of aortas, taken in bright field (BF), from WT, Fbn1mgR/mgR and SMKO-Fbn1mgR/mgR mice (all males) showing severe TAA in SMKO-Fbn1mgR/mgR. Asterisk indicates TAA. Scale bar = 1mm. Bottom: Representative images, taken at 20× magnification, of H&E-stained aortic sections and elastin laminae, captured as autofluorescence at 488nm, in WT, Fbn1mgR/mgR and SMKO-Fbn1mgR/mgR mice. Scale bar = 100 μm. Graphs indicate aortic diameter and elastin fragmentation in WT (n=12), Fbn1mgR/mgR (n=12) and SMKO-Fbn1mgR/mgR (n=8) mice, measured at necropsy; p=0.017, WT vs Fbn1mgR/mgR; p=0.0002 Fbn1mgR/mgR vs SMKO/Fbn1mgR/mgR; p<0.0001 Fbn1mgR/mgR or SMKO/Fbn1mgR/mgR vs WT; one-way ANOVA with Tukey’s multiple comparisons test. Horizontal line in graph indicates the threshold for AA, defined as an increase in aortic diameter >150% of WT diameter. (E) Survival curve of WT (n=8), SMKO (n=8), Fbn1mgR/mgR (n=8) and SMKO-Fbn1mgR/mgR (n=10) mice after vehicle or tamoxifen administration, respectively; p=0.01; Log-rank (Mantel-Cox) test.
Figure 4.
Figure 4.
(A) Western blot of aortas from WT (n=5) and Fbn1mgR/mgR (n=5) mice (circles, females; squares, males) indicating increased levels of TGFβ in Fbn1mgR/mgR aortas. GAPDH was used as the loading control. Each lane represents one mouse. Quantitation of band intensities shown in graph; p=0.0002, unpaired Student’s t-test. (B) Representative Western blot of total protein glutathionylation (Pr-SSG) in VSMCs from WT mice treated with vehicle or TGFβ1 (20 ng/mL). Circles and squares indicate VSMCs isolated from females and males mice, respectively. n=5 replicate experiments; p=0.02, unpaired Student’s t-test. (C) Representative Western blots of reversibly oxidized SirT1 (ReOx SirT1) in VSMCs after overnight treatment with 20 ng/mL TGFβ1; n=7 replicate experiments; p=0.04, unpaired Student’s t-test; or 15 min treatment with 100 μM H2O2; n=8 replicate experiments; p=0.04, unpaired Student’s t-test. Samples were subjected to a biotin switch assay, as described in Materials & Methods. Circles and squares indicate VSMCs isolated from females and males mice, respectively. (D) Biotin switch assay for ReOx SirT1 in VSMCs from WT and Glrx-null mice (GlrxKO), treated overnight with vehicle or TGFβ1 (20 ng/mL); n=4 replicate experiments with VSMCs isolated from 4 female (circles) and 4 male (squares) WT or GlrxKO mice; p=0.03 WT/vehicle vs WT/TGFβ1 and p=0.03 WT/vehicle vs GrlxKO/vehicle, two-way ANOVA with Tukey’s multiple comparisons post hoc test. (E) Overexpression of Glrx using an AAV (8.2×10⁷ vg/μL) in Fbn1mgR/mgR VSMCs decreased SirT1 reversible oxidation, as measured using a biotin switch assay, and decreased histone 3 (H3) acetylated at lysine 9 (Ac-H3lys9), an index of SirT1 activity, compared to a control AAV. β-actin used as loading control. HA tag confirms overexpressed Glrx. n=4 replicate experiments with VSMCs isolated from 4 female (circles) or male (squares) Fbn1mgR/mgR mice; p=0.001, unpaired Student’s t-test.
Figure 5.
Figure 5.
(A) Treatment of human recombinant SirT1 (750ng) with GSH/GSSG (20 mM/5 mM) inhibited SirT1 activity. Anti-FLAG antibody was used to detect total p53 and an anti-GSH antibody was used to detect glutathionylated recombinant SirT1 (SirT1-SSG). Data were calculated as ratio of band intensities for acetylated and total p53, which was used as an indicator of SirT1 deacetylase activity and expressed per μg SirT1 per hour. n=4 replicate experiments; p=0.0004 control vs SirT1; p=0.0002 SirT1 vs SirT1/GSSG, one-way ANOVA with Tukey’s multiple comparisons post hoc test. (B) Representative Western blot for acetylated p53 (Ac-p53), an index of SirT1 activity, in WT and GlrxKO VSMCs. β-actin used as loading control. Quantification of band intensities is shown in the graph; n=4 replicate experiments with VSMCs isolated from 4 female (circles) and 4 male (squares) WT or GlrxKO mice; p=0.0003, unpaired Student’s t-test. (C) Representative Western blot for SirT1 and acetylated p53 (Ac-p53) in WT and Fbn1mgR/mgR VSMCs. β-actin used as loading control. Quantification of band intensities is shown in the graph; n=3 replicate experiments with VSMCs isolated from 3 WT and 3 Fbn1mgR/mgR mice (circles, females; squares, males); p=0.03, unpaired Student’s t-test. (D) Representative Western blot for SirT1 and acetylated p53 in Fbn1mgR/mgR VSMCs treated with a control or 3M SirT1 AAV. Quantitation of band intensities is shown in the graph; n=4 replicate experiments with VSMCs isolated from 4 female (circles) and 4 male (squares) Fbn1mgR/mgR mice; p=0.01, unpaired Student’s t-test. (E) Representative Western blot for SirT1 and acetylated p53 (Ac-p53) in human VSMCs treated with TGFβ1 (20 ng/mL, overnight) and H2O2 (100 μM, 15 min), with or without the SirT1 activator resveratrol (10μM, 2 hrs), 3M SirT1 AAV (1.3×10¹⁰ vg) or left untreated (control). GAPDH used as loading control. n=4 replicate experiments with VSMCs from 4 female (circles) or male (squares) donors; p=0.02, one-way ANOVA with Tukey’s multiple comparison test.
Figure 6.
Figure 6.
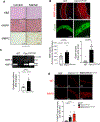
(A) Representative images of aortic sections from healthy donors (n=3) or individuals with Marfan syndrome (n=3), stained with H&E, elastin stain and MMP2, as described in Materials & Methods. Scale bar = 50 μm. (B) Representative images of MMP activity on aortic sections from WT (n=6) and Fbn1mgR/mgR (n=7) mice. The immunofluorescent red signal is indicative of MMP activity measured in situ with a specific MMP substrate, which fluoresces upon specific cleavage by active MMPs. Signal intensity was quantified using ImageJ and normalized to the aortic area for each mouse, as shown in the graph; p=0.03, unpaired Student’s t-test. Green signal indicates elastin autofluorescence at 488 nm in aortic cryosections, acquired at 40× magnification, in WT (n=9) and Fbn1mgR/mgR (n=11) aortas. Elastin fragmentation was quantified manually as described in Materials & Methods. Scale bar = 100 μm; p<0.0001, unpaired Student’s t-test. Circles and squares indicate female and male mice, respectively. (C) Representative images of in-gel zymography of culture medium from WT and Fbn1mgR/mgR VSMCs; data are expressed as fold change of pg gelatinase activity per μg protein. n=7 replicate experiments with VSMCs isolated from 7 WT and 7 Fbn1mgR/mgR mice (circles, females; squares, males); p=0.01, unpaired Student’s t-test. (D) Representative images of MMP2 immunostaining on aortic sections from WT (n=8), Fbn1mgR/mgR (n=6) and SMKO-Fbn1mgR/mgR (n=5) mice (males). Scale bar = 100 μm. Quantitation in graph; p=0.01 WT vs Fbn1mgR/mgR; p=0.003, Fbn1mgR/mgR vs SMKO-Fbn1mgR/mgR, Kruskal-Wallis non parametric test with Dunn’s multiple comparisons test. IgG, rabbit IgG used as negative control.
Figure 7.
Figure 7.
(A) Representative images of MMP activity, measured using in-gel zymography, in cell culture medium from WT and Glrx knockout (GlrxKO) VSMCs. Band intensities are normalized to 10 ng of recombinant MMP2, which was used as a standard (not shown) and expressed as average fold-change of pg gelatinase activity per μg protein. n=4 replicate experiments with VSMCs isolated from 4 WT and 4 GlrxKO mice (circles, females; squares, males); p=0.004, unpaired Student’s t-test. (B) In-gel zymography in medium of Fbn1mgR/mgR VSMCs treated with a control AAV or an AAV overexpressing Glrx. n=4 replicate experiments with VSMCs isolated from 8 female (circles) or male (squares) Fbn1mgR/mgR mice; p=0.05, Mann-Whitney non parametric test. (C) Representative images of MMP activity, measured using in-gel zymography, in medium of Fbn1mgR/mgR VSMCs infected with a control or 3M SirT1 AAV. n=3 replicate experiments with VSMCs isolated from 6 female (circles) or male (squares) Fbn1mgR/mgR mice; p=0.03, unpaired Student’s t-test.

References

    1. Virani SS, Alonso A, Aparicio HJ, et al. American Heart Association Council on Epidemiology and Prevention Statistics Committee and Stroke Statistics Subcommittee. Heart Disease and Stroke Statistics-2021 Update: A Report From the American Heart Association. Circulation. 2021;143:e254–e743. - PubMed
    1. Zúñiga-Muñoz AM, Pérez-Torres I, Guarner-Lans V, Núñez-Garrido E, Velázquez Espejel R, Huesca-Gómez C, Gamboa-Ávila R, Soto ME. Glutathione system participation in thoracic aneurysms from patients with Marfan syndrome. Vasa. 2017;46:177–186. - PubMed
    1. You W, Hong Y, He H, Huang X, Tao W, Liang X, Zhang Y, Li X. TGF-β mediates aortic smooth muscle cell senescence in Marfan syndrome. Aging. 2019;11:3574–3584. - PMC - PubMed
    1. Jiménez-Altayó F, Meirelles T, Crosas-Molist E, et al. Redox stress in Marfan syndrome: Dissecting the role of the NADPH oxidase NOX4 in aortic aneurysm. Free Radic Biol Med. 2018;118:44–58. - PubMed
    1. Pizzino G, Irrera N, Cucinotta M, Pallio G, Mannino F, Arcoraci V, Squadrito F, Altavilla D, Bitto A. Oxidative Stress: Harms and Benefits for Human Health. Oxid Med Cell Longev. 2017;2017:8416763. - PMC - PubMed

Publication types

MeSH terms