. 2023 Jun 8;8(11):e166001.
doi: 10.1172/jci.insight.166001.

REST contributes to AKI-to-CKD transition through inducing ferroptosis in renal tubular epithelial cells

REST contributes to AKI-to-CKD transition through inducing ferroptosis in renal tubular epithelial cells

Shuiqin Gong et al. JCI Insight. .

Abstract

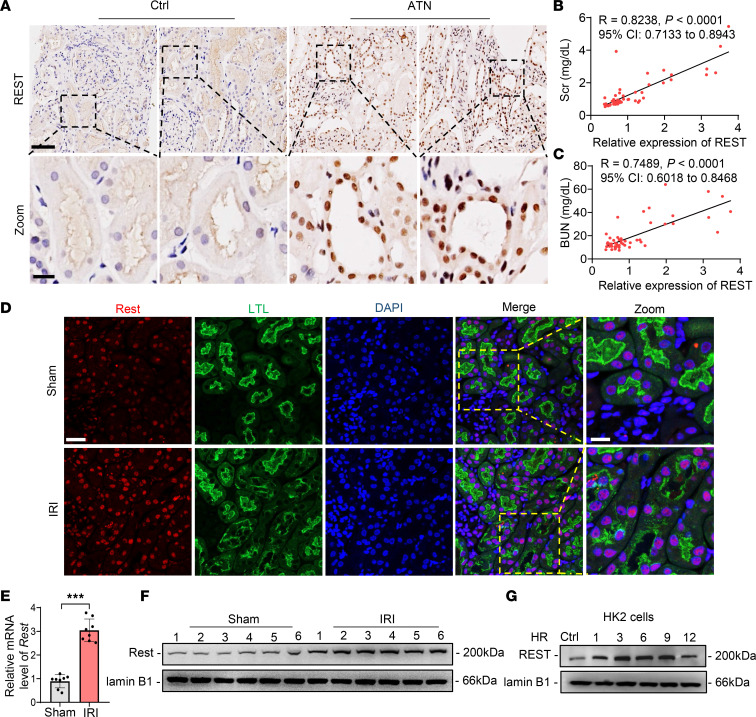
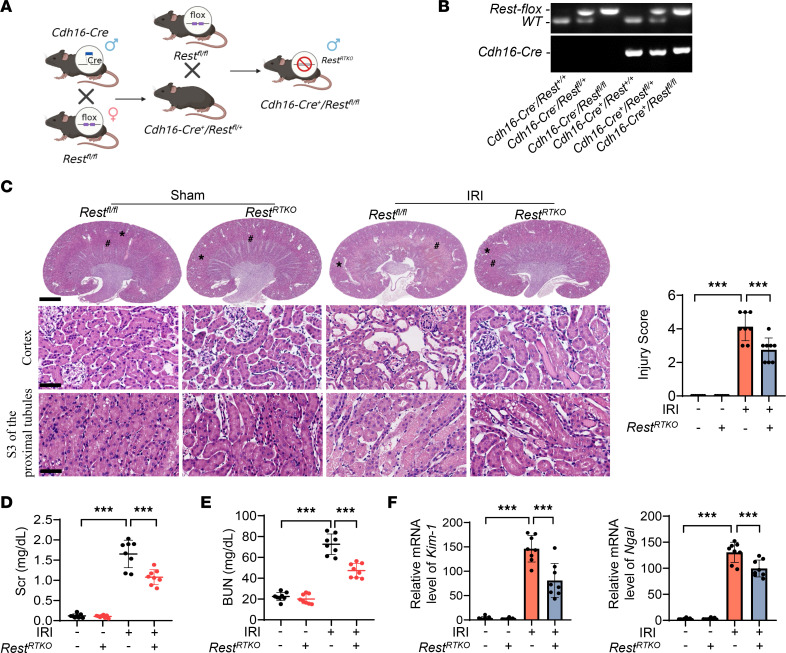
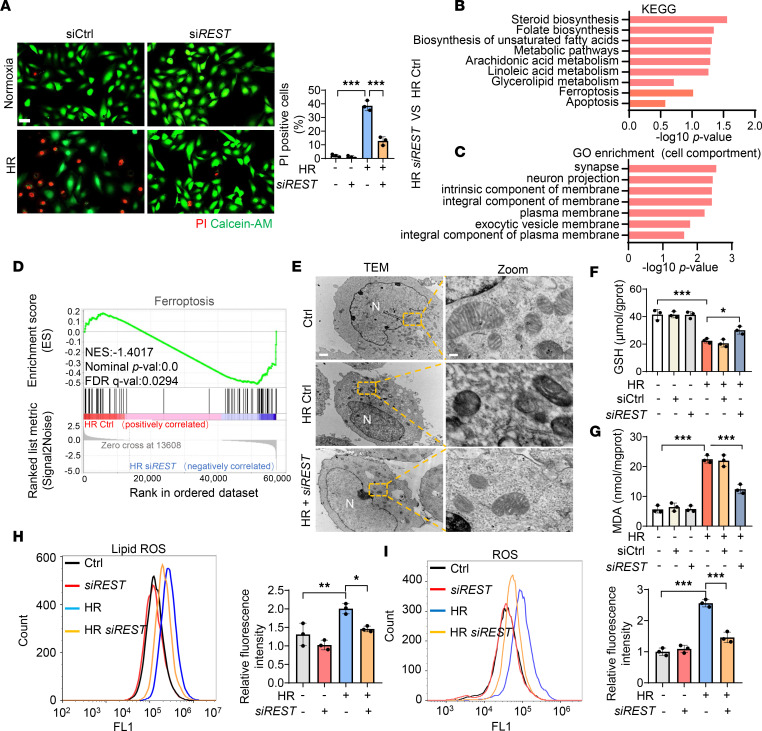
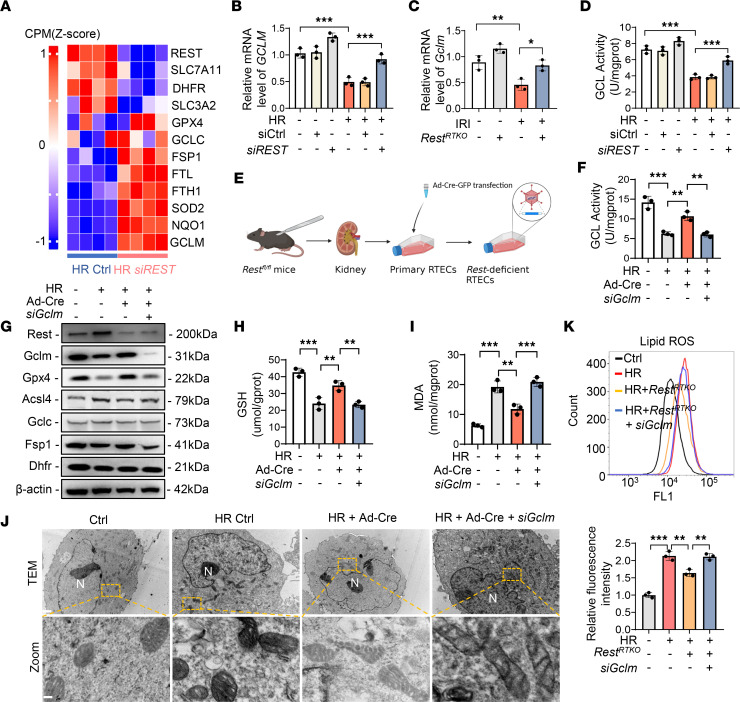
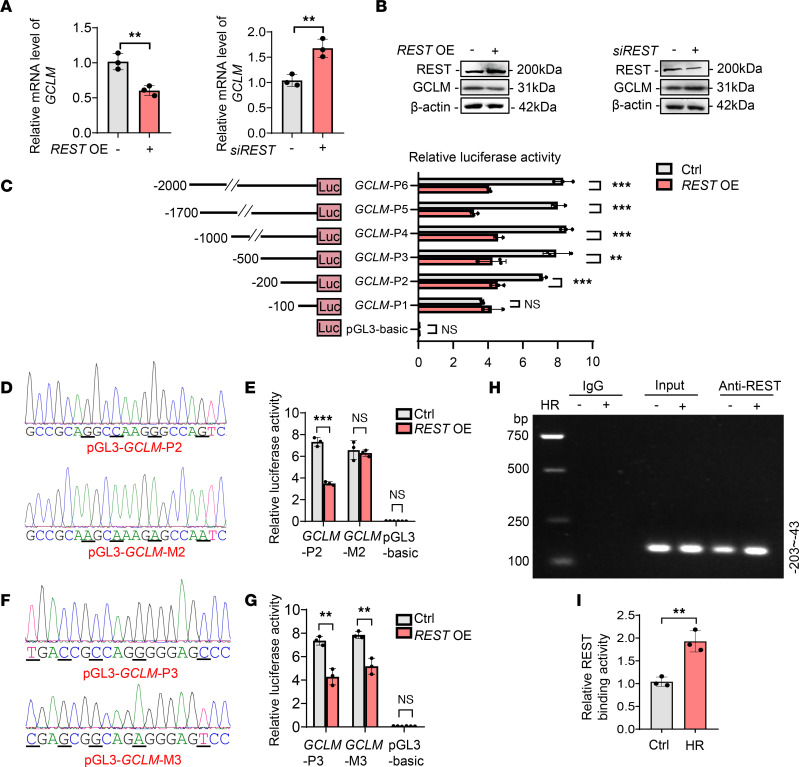
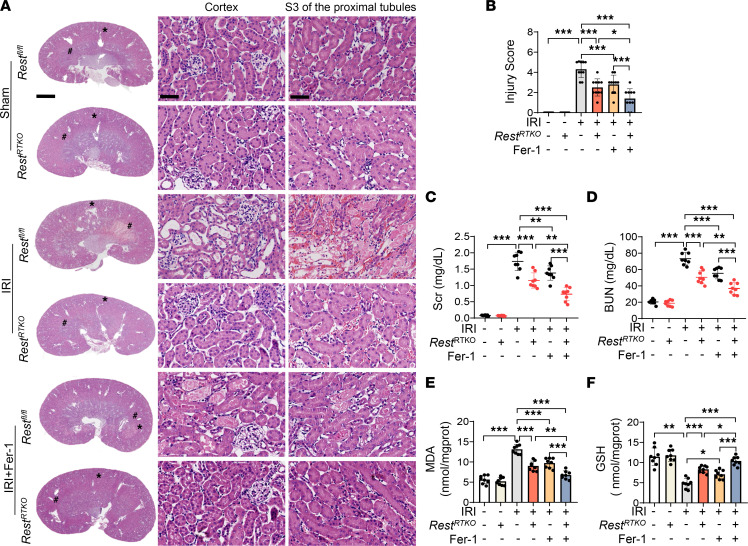
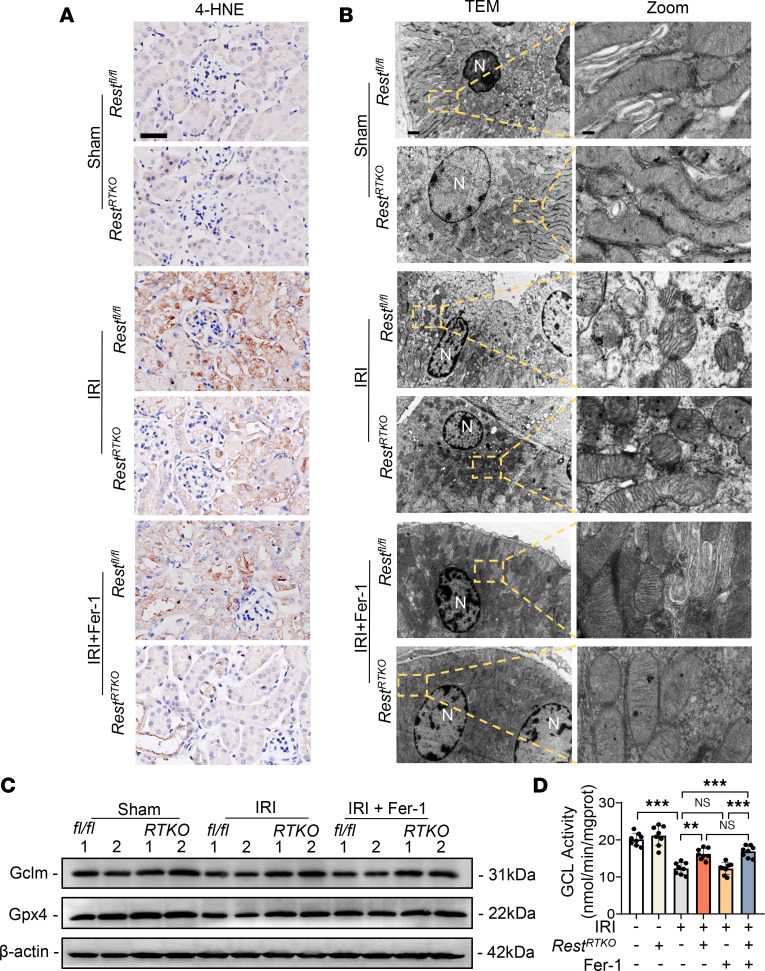
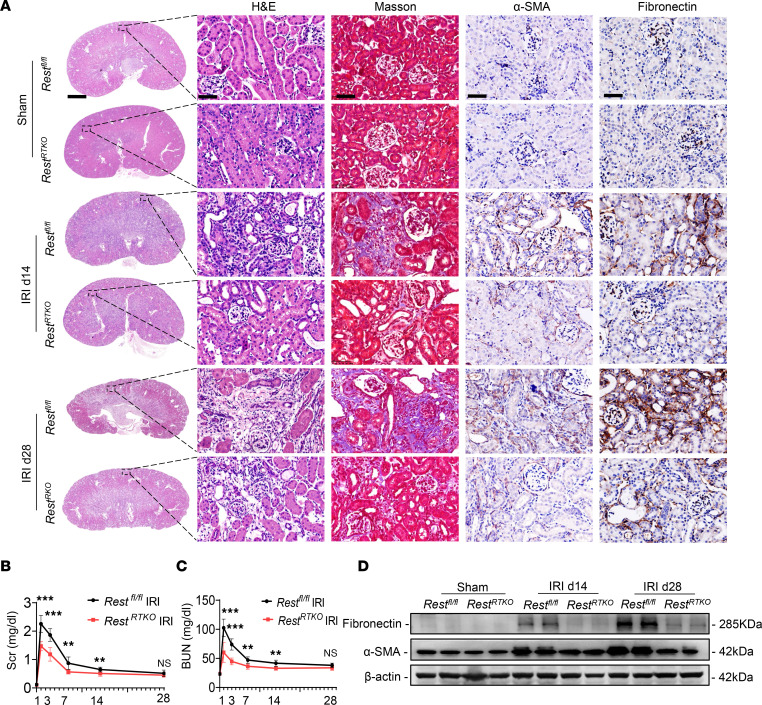
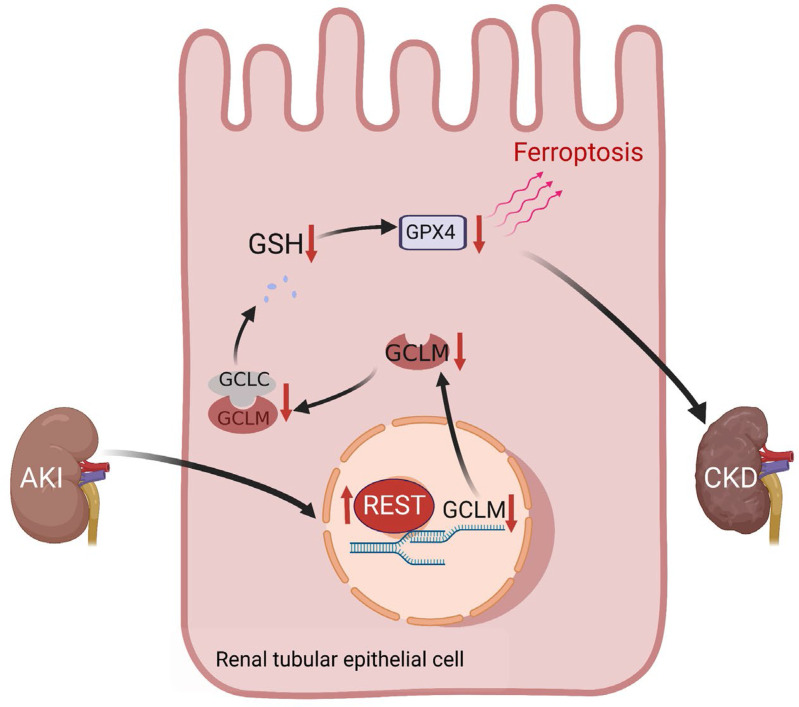
Ischemic-reperfusion injury (IRI) is a major pathogenic factor in acute kidney injury (AKI), which directly leads to the hypoxic injury of renal tubular epithelial cells (RTECs). Although emerging studies suggest repressor element 1-silencing transcription factor (REST) as a master regulator of gene repression under hypoxia, its role in AKI remains elusive. Here, we found that REST was upregulated in AKI patients, mice, and RTECs, which was positively associated with the degree of kidney injury, while renal tubule-specific knockout of Rest significantly alleviated AKI and its progression to chronic kidney disease (CKD). Subsequent mechanistic studies indicated that suppression of ferroptosis was responsible for REST-knockdown-induced amelioration of hypoxia-reoxygenation injury, during which process Cre-expressing adenovirus-mediated REST downregulation attenuated ferroptosis through upregulating glutamate-cysteine ligase modifier subunit (GCLM) in primary RTECs. Further, REST transcriptionally repressed GCLM expression via directly binding to its promoter region. In conclusion, our findings revealed the involvement of REST, a hypoxia regulatory factor, in AKI-to-CKD transition and identified the ferroptosis-inducing effect of REST, which may serve as a promising therapeutic target for ameliorating AKI and its progression to CKD.

Keywords: Fibrosis; Hypoxia; Nephrology.


Conflict of interest statement

Conflict of interest: The authors have declared that no conflict of interest exists.

Figures

Figure 1
Figure 1. REST is upregulated in AKI both in vitro and in vivo.
(A) Representative immunohistochemical staining of REST in ATN patients (n = 20) or control (n = 34). Scale bar: 100 μm (top); 25 μm (down). (B and C) Correlation analysis between REST and Scr (B) or BUN (C). (DF) Immunofluorescence (D), qPCR (E), and Western blot (F) analyses of REST in kidney tissues of sham and IRI-induced AKI mice. Scale bar: 50 μm (left); 25 μm (right). LTL, Lotus tetragonolobus lectin. (G) Western blot analysis of REST in HK2 cells under HR condition (n = 3). Data are shown as mean ± SD and were analyzed by Pearson’s correlation analysis (B and C) or 2-tailed, unpaired Student’s t test (E). ***P < 0.001.
Figure 2
Figure 2. Conditional knockout of Rest in renal tubular epithelial cells protects against AKI.
(A and B) Reproductive strategy of renal tubular conditional Rest-knockout mice (A) and genotyping confirmation of mice at the age of 2 weeks (B). (C) H&E staining and injury score of the kidneys from Restfl/fl and RestRTKO mice with or without IRI. *, cortex; #, S3 of the proximal tubules (n = 8 mice per group). Scale bars: 1.25 mm (top) and 50 μm (middle and bottom). (DF) Levels of Scr (D) and BUN (E) and qPCR analyses of Kim-1 and Ngal levels (F) of the kidneys from mice in C. Data are shown as mean ± SD and were analyzed by 1-way ANOVA (CF). ***P < 0.001.
Figure 3
Figure 3. Silencing REST relieves ferroptosis under HR condition.
HK2 cells were transfected with control or siRNAs against REST (siREST), and then exposed to HR injury for RNA-seq (n = 4). (AD) PI/calcein-AM staining (A), KEGG pathway classification (B), GO enrichment analysis of significant changes in cellular component (C), and GSEA enrichment analysis of ferroptosis pathway (D) between control and REST-knockdown group under HR condition. Scale bar: 50 μm. (EI) Representative TEM images of mitochondria (E), GSH levels (F), MDA levels (G), lipid ROS production (H), and ROS production (I) in different groups (n = 3). Scale bar: 1 μm (left), 0.15 μm (right). N, nucleus. Data are shown as mean ± SD and were analyzed by 1-way ANOVA (A and FI). *P < 0.05; **P < 0.01; ***P < 0.001.
Figure 4
Figure 4. The knockdown of REST inhibits ferroptosis via upregulating GCLM expression under HR condition.
(A) Heatmap analysis of REST and ferroptosis-related genes between control and REST-knockdown group under HR condition. (B and C) qPCR analyses of GCLM expression in HK2 cells under normal conditions or HR injury transfected with control or siREST (B) and renal tubules from Restfl/fl or RestRTKO mice (C). (D) GCL activity of cells in B (n = 3). (EJ) Primary RTECs from Restfl/fl mice were infected with control or Ad-Cre-GFP and cotransfected with control or siRNAs against GCLM (siGCLM) (E), and then subjected to HR injury for analysis of GCL activity (F), Western blot analyses of ferroptosis-related proteins REST, GCLM, GPX4, ACSL4, GCLC, FSP1, and DHFR (G), GSH levels (H), MDA levels (I), and TEM observation of ferroptosis (J) (n = 3). Scale bar: 1 μm (top); 0.15 μm (bottom). N, nucleus. (K) Primary RTECs were isolated from Restfl/fl and RestRTKO mice, and then cotransfected with control or siRNAs against GCLM under normal or HR conditions to detect lipid ROS production (n = 3). Data are shown as mean ± SD and were analyzed by 1-way ANOVA (BD, F, H, I, and K). *P < 0.05; **P < 0.01; ***P < 0.001.
Figure 5
Figure 5. REST suppresses GCLM transcription through directly binding to its promoter region.
(A and B) qPCR (A) and Western blot (B) analyses of GCLM in HK2 cells transfected with control or siREST, or REST overexpression plasmids (REST OE) (n = 3). (C) HK2 cells were cotransfected with pRL-TK plasmids and pGL3-basic or recombinant reporter plasmids containing various fragments of the GCLM promoter region with or without REST overexpression, after which cells were harvested for luciferase assay (n = 3). (D) The pGL3-GCLM-P2 and pGL3-GCLM-M2 fragments (mutant bases are underlined in the sequencing results). (E) HK2 cells were cotransfected with pRL-TK and pGL3-GCLM-P2 or pGL3-GCLM-M2 with or without REST overexpression, and harvested for luciferase assay (n = 3). (F) The pGL3-GCLM-P3 and pGL3-GCLM-M3 fragments (mutant bases are underlined in the sequencing results). (G) HK2 cells were cotransfected with pRL-TK and pGL3-GCLM-P3 or pGL3-GCLM-M3 with or without REST overexpression, and harvested for luciferase assay (n = 3). (H and I) Cells were exposed to control or HR injury and collected for ChIP assay. REST antibody was immunoprecipitated with DNA fragments. The precipitated DNA was amplified using PCR primers covering the GCLM promoter region (–43 to –203). The PCR and qPCR analyses are respectively shown in H and I (n = 3). Data are shown as mean ± SD and were analyzed by 2-tailed, unpaired Student’s t test (A, C, E, G, and I). **P < 0.01; ***P < 0.001. NS, no significance.
Figure 6
Figure 6. Renal tubule–specific knockout of Rest alleviates lipid peroxidation in IRI-induced AKI mice.
RestRTKO and Restfl/fl mice were subjected to IRI and sacrificed on reperfusion day 1. Ferrostatin-1 (Fer-1; 5 mg/kg) or normal saline was intraperitoneally injected into the mice at the onset of reperfusion. The following indices were evaluated (n = 8 mice per group). (A and B) H&E staining (A) and injury scores (B) of the kidneys from all groups. *, cortex; #, S3 of the proximal tubules. Scale bars: 1.25 mm (left) and 50 μm (middle and right). (C and D) Levels of Scr (C) and BUN (D) from mice in A. (E and F) GSH levels (E) and MDA levels (F) of the kidneys from mice in A. Data are shown as mean ± SD and were analyzed by 1-way ANOVA (BF). *P < 0.05; **P < 0.01; ***P < 0.001.
Figure 7
Figure 7. Renal tubule–specific knockout of Rest alleviates AKI through upregulating GCLM expression to inhibit ferroptosis.
RestRTKO mice and Restfl/fl mice were subjected to IRI and sacrificed on reperfusion day 1. Ferrostatin-1 (Fer-1; 5 mg/kg) or normal saline was intraperitoneally injected into the mice at the onset of reperfusion. The following indices were evaluated (n = 8 mice per group). (A) Representative immunohistochemical staining of 4-HNE from all groups. Scale bar: 50 μm. (BD) TEM observation of mitochondria (B), representative Western blot analyses of GCLM and GPX4 (C), and GCL activity (D) of the kidneys from all groups. Scale bar: 1 μm (left); 0.15 μm (right). N, nucleus. Data are shown as mean ± SD and were analyzed by 1-way ANOVA (D). **P < 0.01; ***P < 0.001. NS, no significance.
Figure 8
Figure 8. Renal tubule–specific Rest knockout retards the transition from AKI to CKD.
(A) Restfl/fl and RestRTKO mice were subjected to IRI or sham, and then sacrificed on the 14th and 28th day after reperfusion. The kidneys were removed for H&E and Masson’s staining, and immunohistochemical staining of α-SMA and fibronectin. Scale bars: 1.25 mm (far left) and 50 μm (others) (n = 8 mice per group). (B and C) Levels of Scr (B) and BUN (C) in mice in A. (D) Western blot analysis of the protein levels of fibronectin and α-SMA in the renal tubules from mice in A. Data are shown as mean ± SD and were analyzed by 2-tailed, unpaired Student’s t test (B and C). **P < 0.01, ***P < 0.001. NS, no significance.
Figure 9
Figure 9. Proposed model for the role and mechanism of REST in suppressing ferroptosis and alleviating the transition from AKI to CKD.

References

    1. Levey AS, James MT. Acute kidney injury. Ann Intern Med. 2017;167(9):ITC66–ITC80. doi: 10.7326/AITC201711070. - DOI - PubMed
    1. Rewa O, Bagshaw SM. Acute kidney injury-epidemiology, outcomes and economics. Nat Rev Nephrol. 2014;10(4):193–207. doi: 10.1038/nrneph.2013.282. - DOI - PubMed
    1. Gao L, et al. Potential targeted therapy and diagnosis based on novel insight into growth factors, receptors, and downstream effectors in acute kidney injury and acute kidney injury-chronic kidney disease progression. Signal Transduct Target Ther. 2020;5(1):9. doi: 10.1038/s41392-020-0106-1. - DOI - PMC - PubMed
    1. See EJ, et al. Long-term risk of adverse outcomes after acute kidney injury: a systematic review and meta-analysis of cohort studies using consensus definitions of exposure. Kidney Int. 2019;95(1):160–172. doi: 10.1016/j.kint.2018.08.036. - DOI - PubMed
    1. Tang C, et al. Mitochondrial quality control in kidney injury and repair. Nat Rev Nephrol. 2021;17(5):299–318. doi: 10.1038/s41581-020-00369-0. - DOI - PMC - PubMed

Publication types

Substances