. 2023 Jun 1;136(11):jcs260768.
doi: 10.1242/jcs.260768. Epub 2023 Jun 8.

Nuclear segmentation facilitates neutrophil migration

Affiliations

Nuclear segmentation facilitates neutrophil migration

Connie Shen et al. J Cell Sci. .

Abstract

Neutrophils are among the fastest-moving immune cells. Their speed is critical to their function as 'first responder' cells at sites of damage or infection, and it has been postulated that the unique segmented nucleus of neutrophils functions to assist their rapid migration. Here, we tested this hypothesis by imaging primary human neutrophils traversing narrow channels in custom-designed microfluidic devices. Individuals were given an intravenous low dose of endotoxin to elicit recruitment of neutrophils into the blood with a high diversity of nuclear phenotypes, ranging from hypo- to hyper-segmented. Both by cell sorting of neutrophils from the blood using markers that correlate with lobularity and by directly quantifying the migration of neutrophils with distinct lobe numbers, we found that neutrophils with one or two nuclear lobes were significantly slower to traverse narrower channels, compared to neutrophils with more than two nuclear lobes. Thus, our data show that nuclear segmentation in primary human neutrophils provides a speed advantage during migration through confined spaces.

Keywords: Endotoxemia; Microfluidics; Migration; Neutrophil; Nuclear segmentation; Nucleus.


Conflict of interest statement

Competing interests The authors declare no competing or financial interests.

Figures
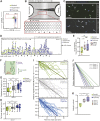
Fig. 1.
Fig. 1.
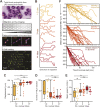
Neutrophil subsets display differential ability to migrate through tight spaces. (A) Representative FACS plot of CD16 and CD62L expression by neutrophils sorted from blood 3 h after low-dose endotoxin administration. Numbers indicate percent of cells in each gate. (B) Schematic of the custom-made pillar forest microfluidic device used in migration assays. Neutrophils were seeded on one side and 10−7M fMLF chemoattractant was added on the other side, such that cells migrated across the pillar forest in paths that decreased in width in a stepwise fashion from 6 μm to 4 μm to 3 μm to 2 μm along the chemoattractant gradient. (C) Example static images of three subsets of sorted neutrophils differentially stained with fluorescent dyes (Hoechst 33342, Calcein-AM or Draq-5). Dashed lines mark a subset of pillars to illustrate the difference in channel width in the two regions. Fluorescent neutrophils were visualized either by a static tile scan of the entire microchannel when at least 25% of the cells had passed through the 2 μm section (D,E) or by time-lapse microscopy (F–K). (D) Representative example from donor 4 of distance migrated by each neutrophil subset within the pillar forest after 3 h. Path width changes are indicated by arrowheads; dotted line represents the point at which cells have traversed the 2 μm section. n=251 cells. (E) Quantification of the percentage of cells that had crossed the 2 μm section after 3 h (as shown in D). Data are from n=6 human donors, 150–450 cells analysed per donor. P-values from one-way ANOVA with Tukey's multiple comparisons post hoc test are shown (ns, not significant; *P≤0.05). (F) Schematic illustrating the measured cell migration parameters: track length, speed, displacement and velocity. Track length is the total distance the cell has travelled. Speed is the rate of movement along the track. Displacement is the total distance travelled towards the chemoattractant. Velocity is the rate of movement in the direction of the chemoattractant source over the course of the cell track. (G–I) Representative plots of total displacement length (G) and cell mean speed (H), calculated by neutrophil subset for cells from donor 1 (total of n=63 cells). Individual data points for each subset are shown alongside the boxplots. P-values from one-way ANOVA with Tukey's multiple comparisons post hoc test are shown (ns, not significant; *P≤0.05). (I) Normalized tracks by subset (colour coded as in G,H) shown from one donor (donor 1), total of n=63 cells. Tracks are displayed as distance migrated towards the chemoattractant source as a function of time. Velocities were calculated as an average of the simple linear regression of each track. Bold lines show the average regression line across all tracks. Dotted lines indicate the start of the 2 μm section. Data in G–I are representative of four donors. (J,K) Relative velocities were calculated as in I for n=4 different donors, 40–65 cells analysed per donor. Velocities were normalized to the average velocity within each donor. Average velocities shown by subset (J; subsets colour coded as in G,H) and boxplots showing normalized velocity as calculated per donor (K). P-values from one-way ANOVA with Tukey's multiple comparisons post hoc test are shown (ns, not significant; *P≤0.05; **P≤0.01). Boxplots in E,G,H and K show the median (horizontal line), interquartile range (box) and range (whiskers). Hyperseg., hypersegmented; PBMC, peripheral blood mononuclear cell; popln, population.
Fig. 2.
Fig. 2.
Greater nuclear lobularity in neutrophils confers increased migratory capacity. (A) Schematic of workflow. After 3 h of intravenous endotoxin administration, total blood neutrophils were stained with nuclear dye Hoechst 33342, run through the pillar forest migration assay, and cells were visualized by time-lapse microscopy. Videos were analysed by cell tracking and manual nucleus lobule annotation. Neutrophils were annotated as having either one or two, three, or four or more lobes. Example annotations and tracking data are shown. Scale bars: 10 μm unless indicated otherwise. (B) Representative example of cell tracks, as relative x and y coordinates, shown by nucleus lobularity group. (C–E) Total displacement length (C), percentage of time spent in the 4 μm and 6 μm sections (D) and cell mean speed (E), calculated by nucleus lobularity group. n=49 cells in total from one donor. Individual data points for each subset are shown alongside the boxplots. Boxplots show the median (horizontal line), interquartile range (box) and range (whiskers). P-values from one-way ANOVA with Tukey's multiple comparisons post hoc test are shown (ns, not significant; *P≤0.05; **P≤0.01; ***P≤0.001. (F) Normalized tracks by subset shown from one donor, n=49 cells. All tracks are shown, including those also shown in B. Tracks are displayed as distance migrated towards the chemoattractant source as a function of time and are colour coded as in B. Velocities were calculated as an average simple linear regression of each track. Bold lines show the average regression lines across all tracks. Data in C–F are representative of three donors (45–60 cells per donor).

References

    1. Bruijnzeel, P. L. B., Uddin, M. and Koenderman, L. (2015). Targeting neutrophilic inflammation in severe neutrophilic asthma: can we target the disease-relevant neutrophil phenotype? J. Leukoc. Biol. 98, 549-556. 10.1189/jlb.3VMR1214-600RR - DOI - PubMed
    1. Carvalho, L. O., Aquino, E. N., Neves, A. C. D. and Fontes, W. (2015). The neutrophil nucleus and its role in neutrophilic function. J. Cell. Biochem. 116, 1831-1836. 10.1002/jcb.25124 - DOI - PubMed
    1. Davidson, P. M. and Lammerding, J. (2014). Broken nuclei – lamins, nuclear mechanics, and disease. Trends Cell Biol. 24, 247-256. 10.1016/j.tcb.2013.11.004 - DOI - PMC - PubMed
    1. Davidson, P. M., Denais, C., Bakshi, M. C. and Lammerding, J. (2014). Nuclear deformability constitutes a rate-limiting step during cell migration in 3-D environments. Cell Mol. Bioeng. 7, 293-306. 10.1007/s12195-014-0342-y - DOI - PMC - PubMed
    1. Denais, C. M., Gilbert, R. M., Isermann, P., Mcgregor, A. L., te Lindert, M., Weigelin, B., Davidson, P. M., Friedl, P., Wolf, K. and Lammerding, J. (2016). Nuclear envelope rupture and repair during cancer cell migration. Science 352, 353-358. 10.1126/science.aad7297 - DOI - PMC - PubMed

Publication types

Grants and funding