. 2023 Aug 31;14(4):e0083423.
doi: 10.1128/mbio.00834-23. Epub 2023 Jun 8.

A new tractable method for generating human alveolar macrophage-like cells in vitro to study lung inflammatory processes and diseases

Affiliations

A new tractable method for generating human alveolar macrophage-like cells in vitro to study lung inflammatory processes and diseases

Susanta Pahari et al. mBio. .

Abstract

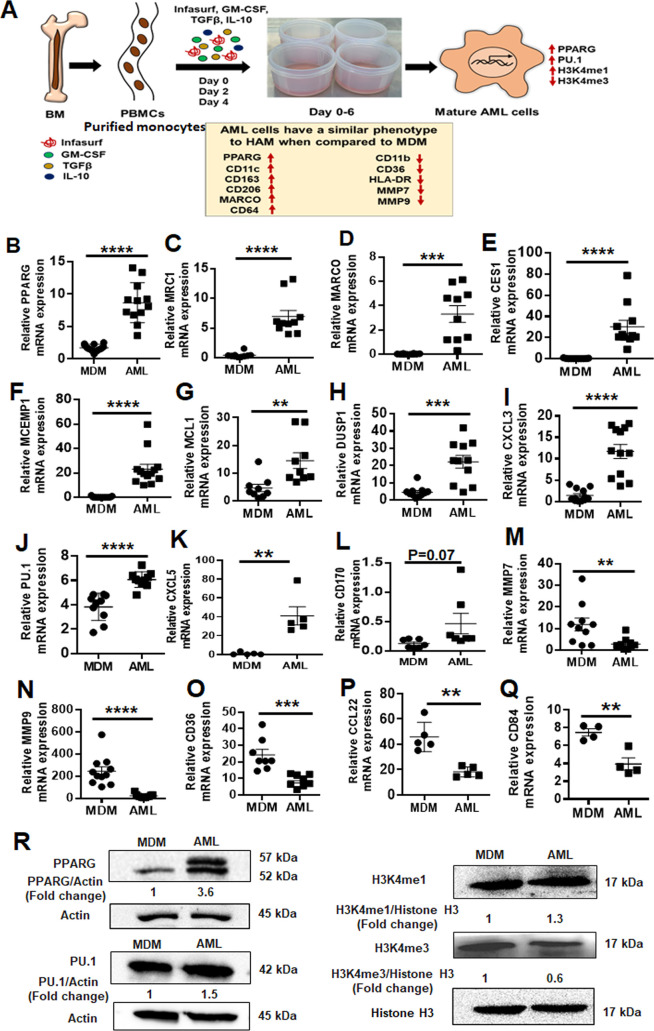
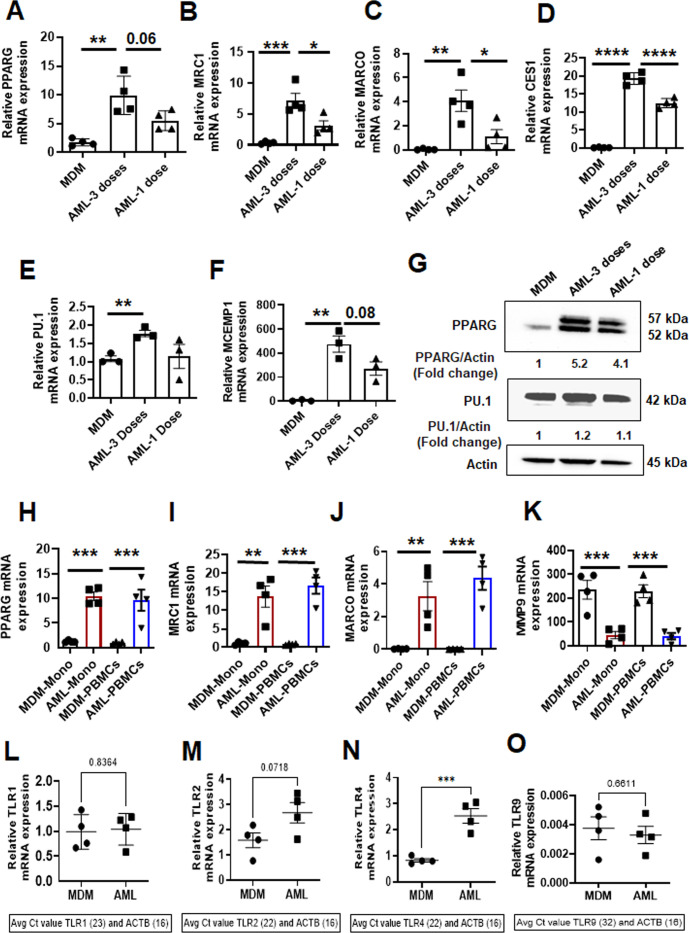
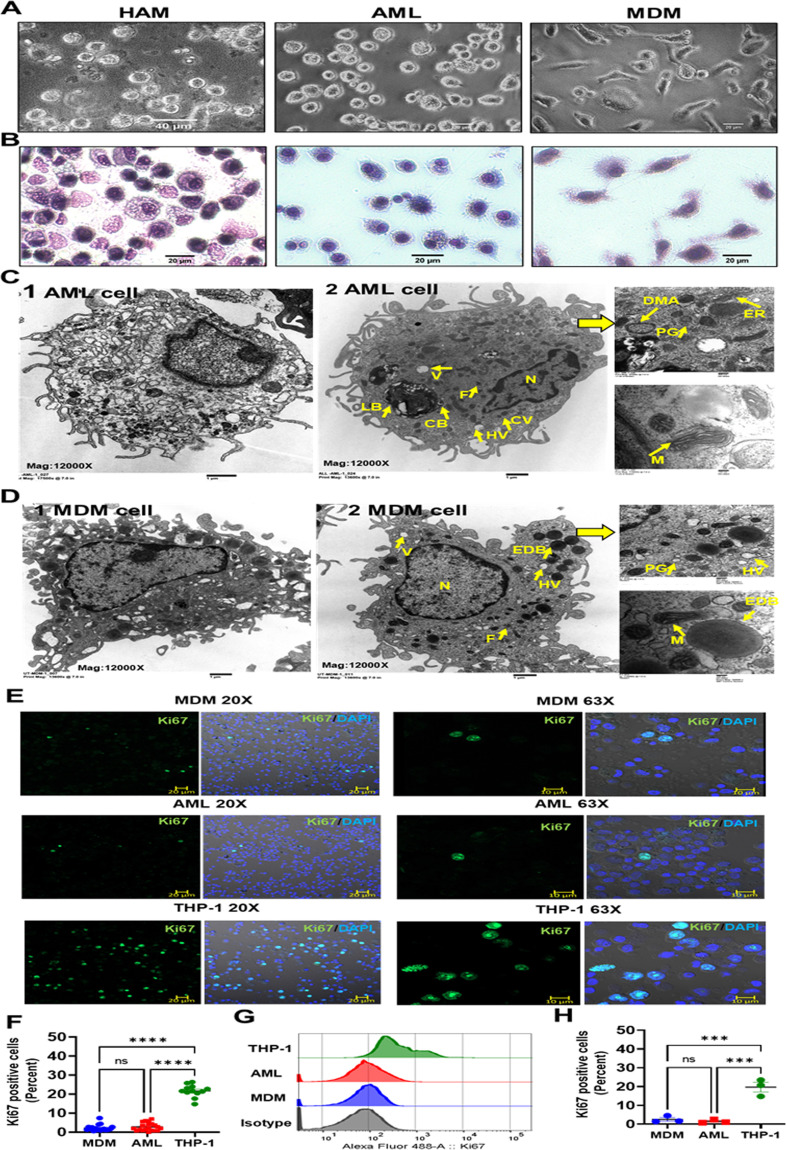
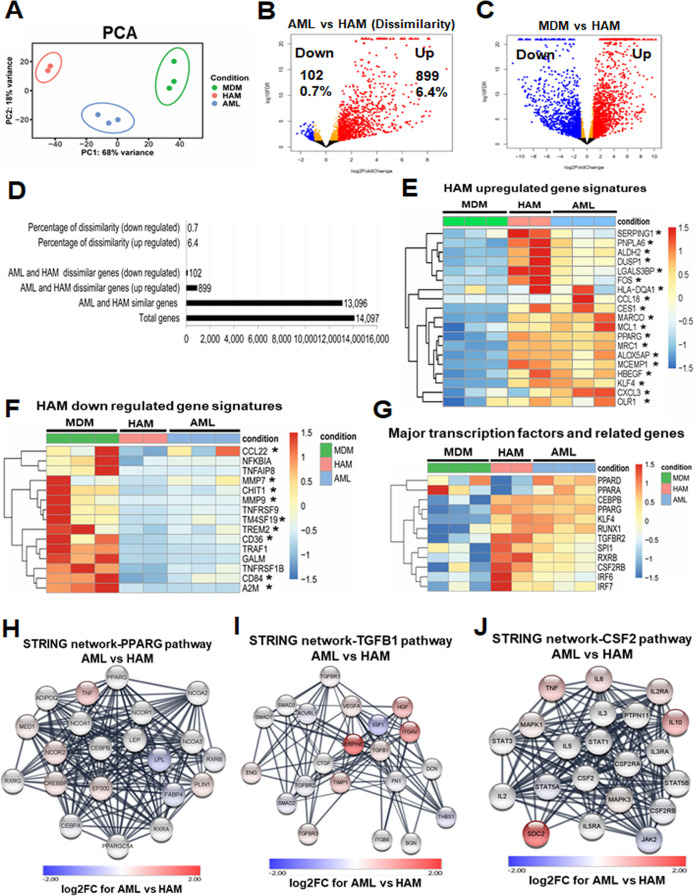
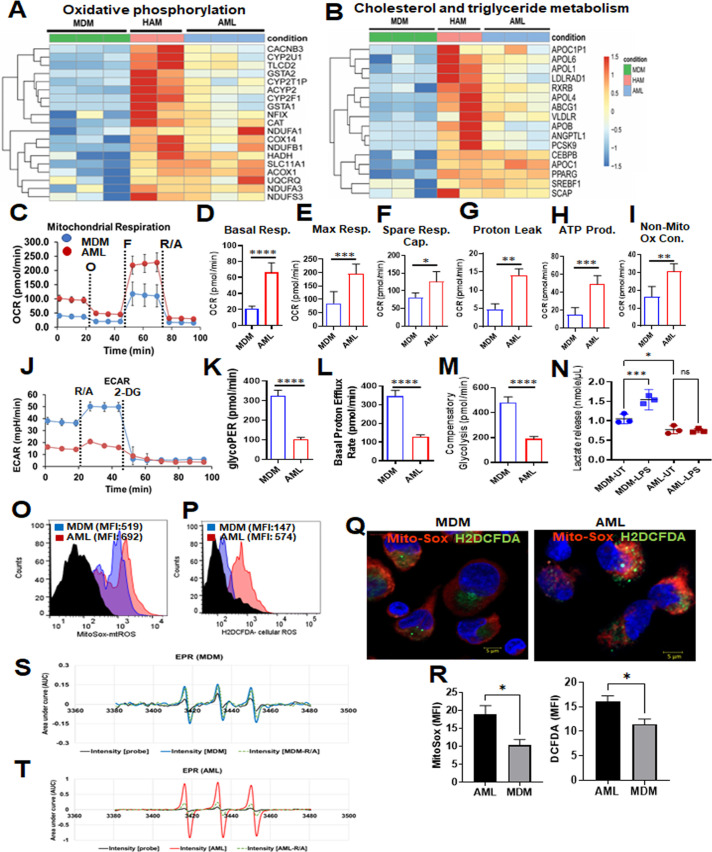
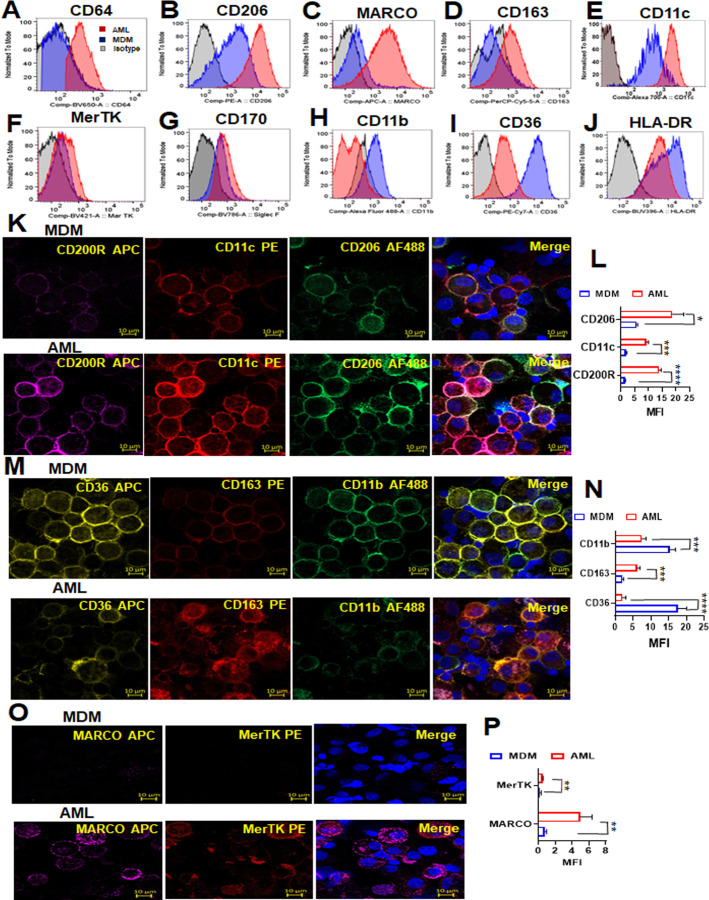
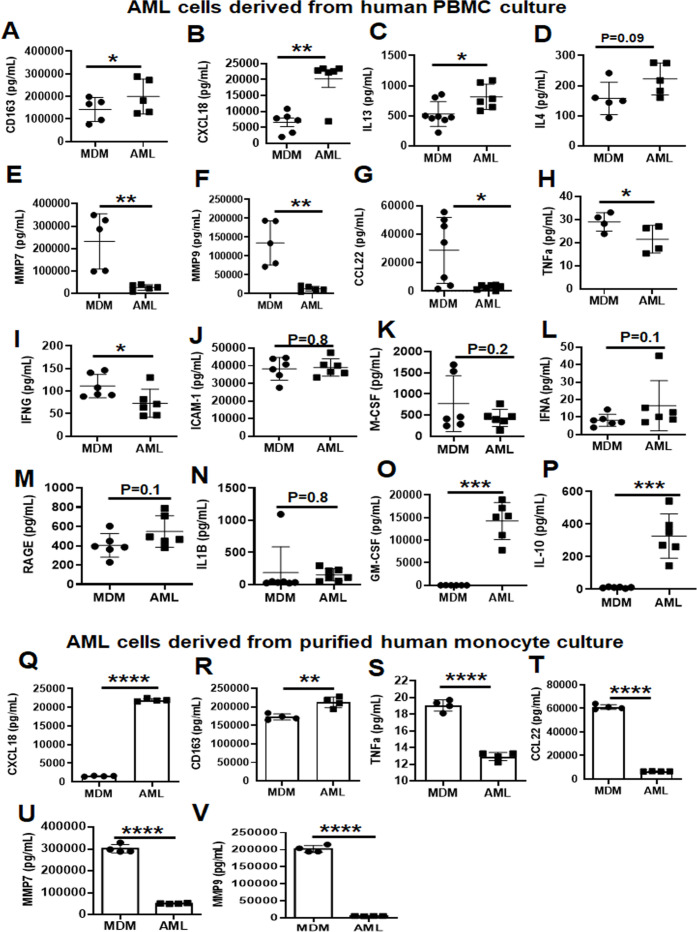
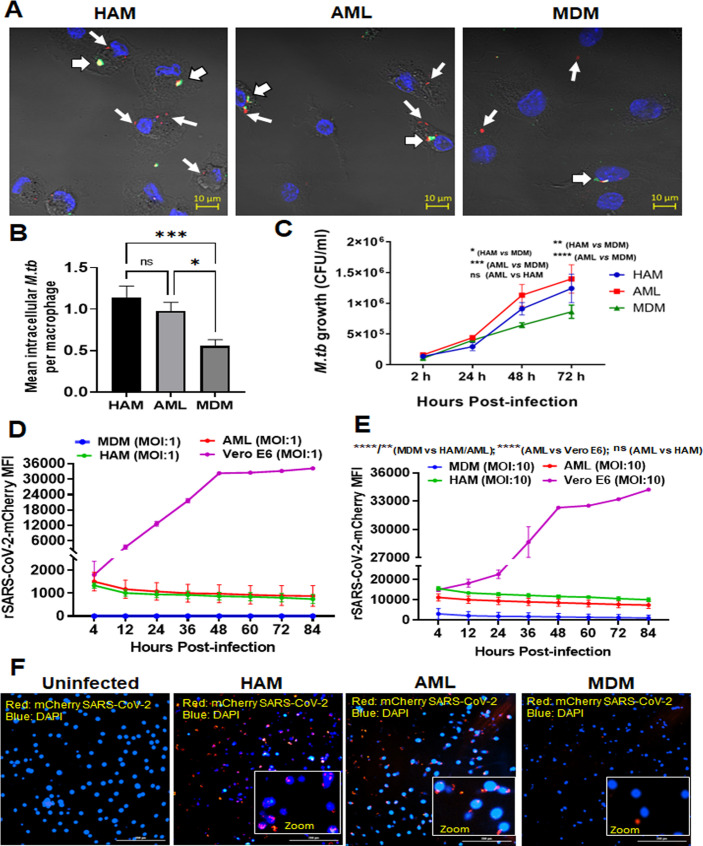
Alveolar macrophages (AMs) are unique lung resident cells that contact airborne pathogens and environmental particulates. The contribution of human AMs (HAMs) to pulmonary diseases remains poorly understood due to the difficulty in accessing them from human donors and their rapid phenotypic change during in vitro culture. Thus, there remains an unmet need for cost-effective methods for generating and/or differentiating primary cells into a HAM phenotype, particularly important for translational and clinical studies. We developed cell culture conditions that mimic the lung alveolar environment in humans using lung lipids, that is, Infasurf (calfactant, natural bovine surfactant) and lung-associated cytokines (granulocyte macrophage colony-stimulating factor, transforming growth factor-β, and interleukin 10) that facilitate the conversion of blood-obtained monocytes to an AM-like (AML) phenotype and function in tissue culture. Similar to HAM, AML cells are particularly susceptible to both Mycobacterium tuberculosis and severe acute respiratory syndrome coronavirus 2 (SARS-CoV-2) infections. This study reveals the importance of alveolar space components in the development and maintenance of HAM phenotype and function and provides a readily accessible model to study HAM in infectious and inflammatory disease processes, as well as therapies and vaccines. IMPORTANCE Millions die annually from respiratory disorders. Lower respiratory track gas-exchanging alveoli maintain a precarious balance between fighting invaders and minimizing tissue damage. Key players herein are resident AMs. However, there are no easily accessible in vitro models of HAMs, presenting a huge scientific challenge. Here, we present a novel model for generating AML cells based on differentiating blood monocytes in a defined lung component cocktail. This model is non-invasive, significantly less costly than performing a bronchoalveolar lavage, yields more AML cells than HAMs per donor, and retains their phenotype in culture. We have applied this model to early studies of M. tuberculosis and SARS-CoV-2. This model will significantly advance respiratory biology research.

Keywords: Mycobacterium tuberculosis; SARS-CoV-2; alveolar macrophage-like (AML) cells; human alveolar macrophages; lung cytokines; oxidative phosphorylation; surfactant.


Figures

Fig 1
Fig 1
Alveolar macrophage-like (AML) cells exhibit a similar phenotype to HAM when compared to MDM. (A) Model of in vitro generation of human AML cells from human PBMCs. Healthy human PBMCs were exposed (days 0, 2, and 4) to lung-associated components (surfactant [Infasurf] and cytokines [GM-CSF, TGF-β, IL-10]) (ALL cocktail) for 6 days or left untreated (MDM). AML cells demonstrated a similar phenotype to HAM (17, 24) compared to MDM with indicated higher (red upside arrow) and lower (red downside arrow) cell surface expression. AML cells and HAM have similar transcriptional profiles with increased expression of PPAR-γ and PU.1 (SPI1). Like HAM (17, 24), AML cells express specific histone modifications and methylation with high H3K4me1 and low H3K4me3. (B–Q) PBMCs were exposed to ALL cocktail for 6 days on alternative days (days 0, 2, and 4) or left untreated (MDM). qRT-PCR data demonstrate significant increases in (B) PPAR-γ, (C) MRC1, (D) MARCO, (E) CES1, (F) MCEMP1, (G) MCL1, (H) DUSP1, (I) CXCL3, (J) PU.1 (SPI1), (K) CXCL5, and (L) CD170 and decreases in (M) MMP7, (N) MMP9, (O) CD36, (P) CCL22, and (Q) CD84 expression in AML cells compared to untreated MDM. Gene expression was normalized to actin. Representative dot plots showing relative mRNA expression of the indicated genes from 12 to 15 human donors. Each dot indicates individual donors. Data are expressed as mean ± SEM and analyzed by unpaired Student’s t-test **P ≤ 0.01, ***P ≤ 0.001, ****P ≤ 0.0001. (R) AML cells demonstrate a HAM-like phenotype, with increased expression of PPAR-γ, PU.1, H3K4me1 and decreased expression of H3K4me3. Nuclear extracts were collected, and western blot was performed to assess the expression of PPAR-γ, PU.1, H3K4me1, and H3K4me3. Actin and histone H3 were used as loading controls. Representative blots from n = 4 and numbers below each blot indicate mean fold change relative to MDM.
Fig 2
Fig 2
Continuous supplementation of the lung component cocktail during differentiation is necessary to drive monocytes to AML cells. (A–F) PBMCs from healthy human donors were exposed to ALL cocktail (surfactant [Infasurf: 100 µg/mL] and cytokines [GM-CSF: 10 ng/mL, TGF-β: 5 ng/mL, IL-10: 5 ng/mL]) for 6 days after only one administration on day 0 (one dose), on alternative days (three doses), or left untreated (MDM). Gene expression of (A) PPAR-γ, (B) MRC1, (C) MARCO, (D) CES1, (E) PU.1, and (F) MCEMP1 was significantly higher in AML cells that received three doses of treatment than one or 0 dose. Each dot indicates an individual donor, n = 4. (G) PPAR-γ and PU.1 protein levels were also higher in AML cells stimulated with all three doses. Actin was used as a loading control. Representative blots from two human donors and the numbers below each blot indicate mean fold change relative to MDM. (H–K) Monocytes were purified by EasySep human monocyte isolation kit from healthy human PBMCs on day 0 (Mono) and exposed to ALL cocktail [AML-Mono: surfactant (Infasurf: 100 µg/mL) and cytokines (GM-CSF: 10 ng/mL, TGF-β: 5 ng/mL, IL-10: 5 ng/mL)] for 6 days on alternative days or left untreated (MDM-Mono). In addition, PBMCs were exposed to ALL cocktail for 6 days on alternative days (AML-PBMCs) or left untreated (MDM-PBMCs), then macrophages were purified by adherence. The cells were collected for qRT-PCR analysis of selected HAM signature genes (17). Gene expression was compared within the groups: MDM and AML cells that were matured from purified monocytes (MDM-Mono and AML-Mono) and MDM and AML cells that were matured in the PBMCs (MDM-PBMCs and AML-PBMCs). The qRT-PCR data show gene expression of (H) PPAR-γ, (I) MRC1, (J) MARCO, and (K) MMP9 expressed as relative mRNA expression normalized to Beta-actin control. Each dot indicates an individual donor. Data are expressed as mean ± SEM (n = 4) and analyzed by ordinary one-way ANOVA with Sidak’s multiple comparisons test. *P ≤ 0.05, **P ≤ 0.01, ***P ≤ 0.001, ****P ≤ 0.0001. Differential expression of relevant Toll-Like Receptor (TLR) genes in AML cells and MDM are shown in (L) TLR1), (M) TLR2, (N) TLR4, and (O) TLR9. n = 4. Each dot indicates an individual donor. Data are expressed as mean ± SEM and analyzed by unpaired Student’s t-test ***P ≤ 0.001.
Fig 3
Fig 3
AML cells are morphologically similar to HAM when compared to MDM. (A) Light microscopy images of HAM, AML, and MDM cells indicate that AML cells have a more rounded appearance resembling HAM. (B) Morphology of AML cells was compared with HAM and MDM after cytospin and staining with HEMA 3 by light microscopy. (C and D) Representative TEM images (1 and 2) of AML cells and MDM, scale bar: 1 µm. AML cells are rounded with long pseudopodia similar to what has been reported using TEM on HAM from healthy adult human donors (26). (C) AML cells contain onion-shaped phago(lyso)somes with phospholipid-rich surfactant material stored in lipid inclusion bodies, named as lamellar bodies (LBs), composite bodies (CBs), coated vesicles (CVs), heterophagic vacuoles (HVs), double-membrane autophagosomes (DMAs), round/irregular or elongated mitochondria (M), Palade granules (PGs), ferritin (F), endoplasmic reticulum (ER), and nucleus (N). (D) MDMs are irregularly shaped with an eccentrically placed nucleus (N), ER, numerous vesicles (CV) and vacuoles (V), and ruffled surface-, free-, or membrane-bound lysosomal inclusions in the vacuole. Round or ovoid electron-dense bodies (EDBs), Palade granules (PGs), ferritin (F), round or elongated mitochondria (M) are more abundant in MDM. (C and D) Magnification: 12,000×, higher magnification insets on the right: 50,000×, scale bar: 200 nm. (E and F) MDM, AML, and THP-1 monocytic cells were immunostained with Ki67 antibody (green) and DAPI for nucleus (blue), then imaged with confocal microscopy. Scale bar: 10 µm, 20 µm, and 20×, 63× magnification. (F) Confocal data of Ki67-positive cells (percent) were quantified from >200 macrophages (DAPI-positive cells) per microscopic field. Each dot indicates a separate field. Cumulative data from three donors, mean ± SEM and analyzed with one-way ANOVA. ****P ≤ 0.0001. (G and H) Flow cytometry histogram data (G) show representative Ki67 MFI and (H) each dot indicates percent of positive cells, n = 3 donors. Data are expressed as mean ± SEM with one-way ANOVA. ***P < 0.001, ns = non-significant.
Fig 4
Fig 4
HAM and AML cells share similar transcriptional profiles and related pathways. (A) Principal component analysis (PCA) demonstrates minimal variation within the biological replicates (HAM: n = 2 donors; AML: n = 3 donors; MDM: n = 3 donors). (B) Volcano plot demonstrates the comparison between the AML and HAM transcriptome. AML and HAM are similar: out of 14,097 expressed genes, only 899 genes are upregulated ≥ two-fold with FDR-adjusted P-value <0.05 (red), and 102 genes are downregulated (blue) in AML cells. (C) Volcano plot demonstrates the comparison between MDM and HAM transcriptome. MDM and HAM are more dissimilar: out of 14,097 expressed genes, 1,516 are upregulated (red) and 1,319 are downregulated (blue) in MDM. (D) Bar graph represents the comparison between the AML and HAM transcriptome. (E and F) Heatmaps showing major up- and downregulated genes in MDM, HAM, and AML cells. The asterisks indicate genes that are listed in Table 1. (G) Heatmap indicates the major transcription factors that are important for HAM development and function, with similar patterns in AML cells and HAM. (H–J) STRING protein–protein interaction analysis of three key signaling pathways in HAM (PPAR-γ, TGFB1, and CSF2). Most of the interacting proteins in these pathways are shown in white, indicating that they have similar expression levels in HAM and AML cells.
Fig 5
Fig 5
Metabolic status of AML cells, HAM, and MDM. (A) Heatmap from the RNA-seq data indicates higher relative expression of genes related to fatty acid oxidation and OxPhos in AML cells and HAM. (B) Heatmap from the RNA-seq data indicates that cholesterol and triglyceride metabolism–related genes have a similar expression pattern in HAM and AML cells. (C–M) Red bars and lines represent AML cells, and blue bars and lines represent MDM. Extracellular flux analysis was performed in AML cells and MDM cells by Seahorse analyzer. The oxygen consumption rate (OCR) and extracellular acidification rate (ECAR) were analyzed under basal conditions and in response to Mito Stress Test reagent. (C) The dashed lines indicate when O: oligomycin; F: FCCP; R/A: rotenone and antimycin A were added. (D–F) Representative Mito Stress Test kinetic graphs show higher levels of basal, maximal OCR and higher Spare respiratory capacity (SRC) in AML cells compared to MDM. (G–I) Proton leak, non-mitochondrial OCR and ATP production were also higher in AML cells. (J) The glycolytic rate (ECAR) kinetics graph demonstrates an increase in the glycolytic rate in MDM as compared to AML cells. 2-Deoxy-D-glucose (2-DG) was used to inhibit glycolysis. (K–M) Quantification of basal and compensatory glycolysis in MDM and AML cells. Representative experiment is shown of n = 3, mean ± SD and analyzed by unpaired Student’s t-test *P ≤ 0.05, **P ≤ 0.01, ***P ≤ 0.001, ****P ≤ 0.0001. (N) Lactate levels (nmol/µL) in the culture supernatant of MDM and AML cells after 24-hour LPS treatment (MDM: 10 ng/mL and AML: 100 ng/mL) were measured by Lactate Colorimetric Assay Kit II. Each dot represents an individual donor (n = 3), mean ± SEM and analyzed with one-way ANOVA. *P ≤ 0.05, ***P ≤ 0.001. (O–Q) AML cells and MDM were treated with MitoSOX (5 µM) and DCFDA (5 µM) to demonstrate mitochondrial and cellular ROS (non-mitochondrial), respectively, by flow cytometry and confocal microscopy. Magnification: 63×, scale bar: 5 µM. (R) Bar graphs show mitochondrial and cellular ROS represented as MFI. Representative experiment is shown of n = 3, mean ± SD and analyzed by unpaired Student’s t-test *P ≤ 0.05. (S and T) Electron paramagnetic resonance (EPR) spectrum–based mitochondrial ROS detection in MDM (blue line) and AML cells (red line) probed with Mito-TEMPO-H for signal intensity measurements in cell lysates. The data were analyzed first after baseline correction and subsequently second integration that yielded the area under the curve (AUC) in arbitrary units (AU).
Fig 6
Fig 6
Phenotypic and functional characterization of AML cells compared to MDM. (A–J) PBMCs were exposed to ALL cocktail for 6 days on alternative days or left untreated (MDM). Flow cytometry data reveal that the AML cell surface phenotype resembles HAM with increased expression of (A) CD64, (B) CD206, (C) MARCO, (D) CD163, (E) CD11c, (F) MerTk, and (G) CD170 and decreased expression of (H) CD11b, (I) CD36, and (J) HLA-DR when compared to MDM. Control fluorescence is shown in gray, and specific fluorescence for AML cells is in red and MDM in blue. (K, M, and O) The cells were immunostained with the indicated antibodies and DAPI for nucleus (blue), then imaged with confocal microscopy. Scale bar: 10 µm and 63× magnification. (L, N, and P) Confocal data were quantified by MFI and represented as bar graphs. Representative experiment of n = 3, mean ± SD and analyzed by unpaired Student’s t-test *P ≤ 0.05, **P ≤ 0.01, ***P ≤ 0.001, ****P ≤ 0.0001.
Fig 7
Fig 7
AML cells release several inflammation-related proteins. (A–I) PBMCs were exposed to ALL cocktail (surfactant [Infasurf] and cytokines [GM-CSF, TGF-β, IL-10]) for 6 days on alternative days or left untreated (MDM). Cell supernatants were collected and the release of several inflammation-related proteins was analyzed simultaneously by Luminex technology. Like HAM, AML cells released increased levels of (A) CD163, (B) CXCL18, (C) IL-13, and (D) IL-4, and decreased levels of (E) MMP7, (F) MMP9, (G) CCL22, (H) TNFα, and (I) IFNG compared to MDM. AML cells and MDM released similar quantities of soluble (J) ICAM-1, (K) M-CSF, (L) IFNA, (M) RAGE, and (N) IL-1B, and there was significantly more (O) GM-CSF and (P) IL-10 in the supernatants collected from AML cells than from MDM. Data are mean ± SEM; each dot indicates results from one donor (n = 5–8) and analyzed by unpaired Student’s t-test. *P ≤ 0.05, **P ≤ 0.01, ***P ≤ 0.001. (Q–V) Monocytes were purified by EasySep human monocyte isolation kit by magnetic sorting (negative selection) of healthy human PBMCs on day 0 and exposed to ALL cocktail treatment (surfactant [Infasurf] and cytokines [GM-CSF, TGF-β, IL-10]) for 6 days on alternative days or left untreated (MDM). Cell supernatants were collected and the release of inflammation-related proteins was analyzed simultaneously by Luminex Technology. AML cells differentiated from isolated monocytes release higher (Q) CXCL18, and (R) CD163, and lower (S) TNFα, (T) CCL22, (U) MMP7, and (V) MMP9 amounts than MDM, similar to those cells differentiated from PBMCs. Data are expressed as mean ± SEM; each dot indicates results from one donor (n = 4) and analyzed by unpaired Student’s t-test. **P ≤ 0.01, ****P ≤ 0.0001.
Fig 8
Fig 8
Uptake and growth of M.tb and SARS-CoV-2 in AML cells are similar to HAM. PBMCs were exposed to ALL cocktail for 6 days on alternative days or left untreated (MDM). Freshly isolated HAMs were obtained from the same donor. Cell monolayers were then incubated with M.tb-H37Rv-mCherry (MOI 5; red) for 2 hours, fixed without permeabilization, and washed. (A) Cell monolayers on coverslips were immunostained with fluorophore-conjugated anti-M.tb antibody (green) and DAPI (blue), and then imaged using confocal microscopy. 63× magnification, scale bar: 10 µm. White arrows indicate mCherry (red) intracellular M.tb, and white arrowheads indicate attached/extracellular (yellow-green) M.tb. (B) Mean number of intracellular bacteria per cell was calculated from >100 macrophages. A representative experiment from MDM/AML cells n = 5, HAM n = 3, mean ± SD. Data were analyzed by ordinary one-way ANOVA. *P ≤ 0.05, ***P ≤ 0.001. (C) Intracellular growth of M.tb-H37Rv was monitored in the indicated time points post-infection (2, 24, 48, and 72 hours) by CFUs. Each point is the mean of CFU values from triplicate wells. Representative experiment of n = 5, mean ± SD with two-way ANOVA. *P ≤ 0.05, **P ≤ 0.01; ***P ≤ 0.001; ****P < 0.0001. (D and E) Kinetics of increased uptake of SARS-CoV-2 (MOI: 1 and 10) and persistence over time using the Cytation 5 live cell imaging system. Data were normalized to uninfected control and presented as mCherry MFI values. Data are expressed as mean ± SD with one-way ANOVA. **P ≤ 0.01; ****P < 0.0001. (F) Representative image of mCherry-positive cells infected with SARS-CoV-2/mCherry-Nluc, counterstained with DAPI at day 5 post-infection. Red: mCherry SARS-CoV-2, blue: DAPI (nucleus). Scale bar: 200 µm and 20× magnification. Inset photomicrographs show higher power images of cells infected with rSARS-CoV-2/mCherry-Nluc (red). The data in D–F are representative of four experiments using different MDM/AML donors and a HAM donor. Videos of cells infected with rSARS-CoV-2/mCherry-Nluc using Cytation 5 live cell imaging 4–84 hours post-infection are shown in Movies S1–S4.

Update of

References

    1. Hussell T, Bell TJ. 2014. Alveolar macrophages: plasticity in a tissue-specific context. Nat Rev Immunol 14:81–93. doi:10.1038/nri3600 - DOI - PubMed
    1. Ataya A, Knight V, Carey BC, Lee E, Tarling EJ, Wang T. 2021. The role of GM-CSF autoantibodies in infection and autoimmune pulmonary alveolar proteinosis: a concise review. Front Immunol 12:752856. doi:10.3389/fimmu.2021.752856 - DOI - PMC - PubMed
    1. Hashimoto D, Chow A, Noizat C, Teo P, Beasley MB, Leboeuf M, Becker CD, See P, Price J, Lucas D, Greter M, Mortha A, Boyer SW, Forsberg EC, Tanaka M, van Rooijen N, García-Sastre A, Stanley ER, Ginhoux F, Frenette PS, Merad M. 2013. Tissue-resident macrophages self-maintain locally throughout adult life with minimal contribution from circulating monocytes. Immunity 38:792–804. doi:10.1016/j.immuni.2013.04.004 - DOI - PMC - PubMed
    1. Ginhoux F, Jung S. 2014. Monocytes and macrophages: developmental pathways and tissue homeostasis. Nat Rev Immunol 14:392–404. doi:10.1038/nri3671 - DOI - PubMed
    1. Guilliams M, De Kleer I, Henri S, Post S, Vanhoutte L, De Prijck S, Deswarte K, Malissen B, Hammad H, Lambrecht BN. 2013. Alveolar macrophages develop from fetal monocytes that differentiate into long-lived cells in the first week of life via GM-CSF. J Exp Med 210:1977–1992. doi:10.1084/jem.20131199 - DOI - PMC - PubMed

Publication types