. 2024 Mar;131(2):456-493.
doi: 10.1037/rev0000427. Epub 2023 Jun 8.

The autocorrelated Bayesian sampler: A rational process for probability judgments, estimates, confidence intervals, choices, confidence judgments, and response times

Affiliations

The autocorrelated Bayesian sampler: A rational process for probability judgments, estimates, confidence intervals, choices, confidence judgments, and response times

Jian-Qiao Zhu et al. Psychol Rev. 2024 Mar.

Abstract

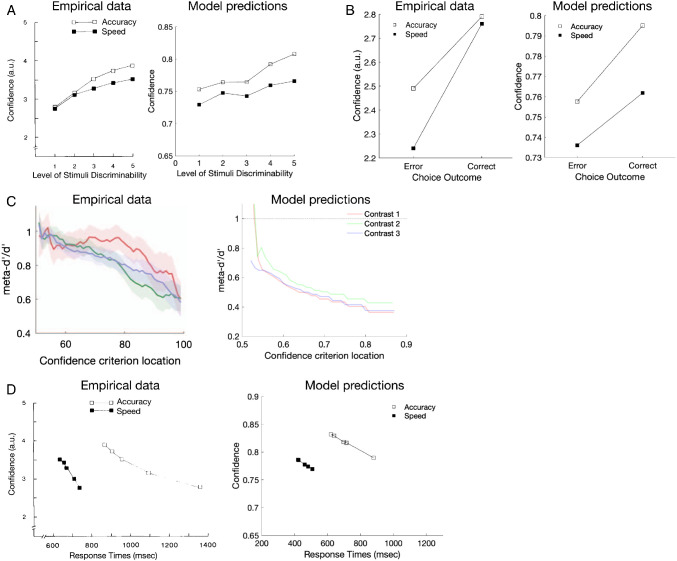
Normative models of decision-making that optimally transform noisy (sensory) information into categorical decisions qualitatively mismatch human behavior. Indeed, leading computational models have only achieved high empirical corroboration by adding task-specific assumptions that deviate from normative principles. In response, we offer a Bayesian approach that implicitly produces a posterior distribution of possible answers (hypotheses) in response to sensory information. But we assume that the brain has no direct access to this posterior, but can only sample hypotheses according to their posterior probabilities. Accordingly, we argue that the primary problem of normative concern in decision-making is integrating stochastic hypotheses, rather than stochastic sensory information, to make categorical decisions. This implies that human response variability arises mainly from posterior sampling rather than sensory noise. Because human hypothesis generation is serially correlated, hypothesis samples will be autocorrelated. Guided by this new problem formulation, we develop a new process, the Autocorrelated Bayesian Sampler (ABS), which grounds autocorrelated hypothesis generation in a sophisticated sampling algorithm. The ABS provides a single mechanism that qualitatively explains many empirical effects of probability judgments, estimates, confidence intervals, choice, confidence judgments, response times, and their relationships. Our analysis demonstrates the unifying power of a perspective shift in the exploration of normative models. It also exemplifies the proposal that the "Bayesian brain" operates using samples not probabilities, and that variability in human behavior may primarily reflect computational rather than sensory noise. (PsycInfo Database Record (c) 2024 APA, all rights reserved).


Figures

Figure 1
Figure 1. Illustrations of the Variety of Behavioral Measures for a Single Task
Note. After the presentation of sensory stimulus, people can be asked a wide range of questions and their responses lead to corresponding behavioral measures.
Figure 2
Figure 2. Schematic Illustrations of the Computational Mechanisms and Potential Behavioral Outputs of the SPRT (A) and the ABS (B)
Note. A typical trial of a numerosity task is visualized in which 24 dots are briefly presented on-screen as the stimulus. The SPRT draws sequential samples from the noisy sensory representation (e.g., corrupted images), while the ABS draws autocorrelated samples of hypotheses (e.g., numbers of dots). SPRT = sequential probability ratio test; ABS = Autocorrelated Bayesian Sampler; RT = response times. See the online article for the color version of this figure.
Figure 3
Figure 3. Relationship Between the Underlying Probabilities of Event A and the Average Probability Judgments of A Predicted by the ABS
Note. (A) From left to right, the number of alternatives, M, varies from 2 to 7. Within each panel, simulated sample sizes, N, range from 1 to 9 in increments of 2. While uniform Dirichlet priors were used in the simulation, the indifferent points are always located at (1/M, 1/M) for symmetric Dirichlet priors. (B) As produced by the ABS, the empirical indifference points between mean probability judgments and objective probabilities are related to the inverse of the number of alternatives (M). Indifference points were directly reported by the data analyses in Fox and Rottenstreich (2003), Bardolet et al. (2011), and Varey et al. (1990), and were inferred from the regression in Attneave (1953). ABS = Autocorrelated Bayesian Sampler. See the online article for the color version of this figure.
Figure 4
Figure 4. Mean-Variance Relationships in Probability Judgments
Note. (A) Empirical results based on the four experiments of Zhu et al. (2020) and Sundh et al. (2021), showing inverted U-shaped relationships between means and variances of probability estimates, such that extreme probability estimates (very near 0 or 1) are ruled out. Solid curves are the mixed-effect regression models fitted on individual-level probability estimates. (B) Analytic approximations of the mean-variance relationship predicted by the ABS. The model predicts an inverted-U shape, with stronger priors on responses moving the curve inward and more samples moving the curves downward. ABS = Autocorrelated Bayesian Sampler. See the online article for the color version of this figure.
Figure 5
Figure 5. Bias in Explicit Subadditivity, Computed as the Sum of the Probability Estimates of Each Component Hypothesis Minus the Probability Estimates of Their Disjunction, Increases as the Number of Component Hypotheses Increases
Note. This empirical effect is captured by the Bayesian Sampler (solid line). The sample sizes were set at N = 5, and the prior on responses was Beta(1,1). See the online article for the color version of this figure.
Figure 6
Figure 6. Slow and Fast Errors
Note. (A) Empirical choice outcomes and response-time distributions in the difficult-accuracy condition. (B) Simulated choice outcomes and RT distributions in the difficult-accuracy condition. RTs were fitted with Gamma distributions with the best-fitting distribution shown as solid lines for correct (in blue) and error (in red) responses. Overlaid dots and their horizontal error bars denote mean RTs and 95% confidence intervals respectively. Similarly, (C) and (D) are respectively empirical data and model simulations for the easy-speed condition. Across the different variants, only the full ABS model reproduces both slow and fast errors in the correct experimental conditions. All predicted RT distributions were unimodal and positively skewed. The full model also correctly reproduces an RT distribution that becomes more positively skewed and spreads out with an increase in the decision threshold. Empirical data were adapted from “Modeling Regularities in Response Time and Accuracy Data With the Diffusion Model,” by R. Ratcliff, P. L. Smith, and G. McKoon, 2015, Current Directions in Psychological Science, 24(6), 458–470 (https://doi.org/10.1177/0963721415596228). Copyright 2015 by Sage Publications. Adapted with permission. ABS = Autocorrelated Bayesian Sampler; RT = response times. See the online article for the color version of this figure.
Figure 7
Figure 7. Sample Quantile–Quantile Plots of Response-Times Distributions for Different Levels of Task Difficulty
Note. (A) An example Q–Q plot of empirical RT distributions adapted from “Modeling Regularities in Response Time and Accuracy Data With the Diffusion Model,” by R. Ratcliff, P. L. Smith, and G. McKoon, 2015, Current Directions in Psychological Science, 24(6), 458–470 (https://doi.org/10.1177/0963721415596228). Copyright 2015 by Sage Publications. Adapted with permission. One difficulty level was selected to compute its quantiles and then quantiles of the other four difficulty levels were plotted against the first condition. The rank of a condition depends on its mean RTs. (B) Q–Q plots of RT distributions produced by the ABS model and its variants. ABS = Autocorrelated Bayesian Sampler; RT = response times. See the online article for the color version of this figure.
Figure 8
Figure 8. ABS Simulations Showing Effects of Confidence in Decisions
Note. (A) Positive relationship between stimulus discriminability and average confidence. (B) Resolution of confidence in which average confidence is higher for correct responses than for incorrect responses. Empirical data replotted from Vickers and Packer (1982). (C) Degree of metacognitive efficiency showing extreme confidence ratings are less informative about the accuracy of a choice. (D) Negative (cross-trials) relationship between confidence and RT and positive (cross-conditions) relationship between confidence and RT. Each dot denotes a level of difficulty. Empirical data adapted from Vickers and Packer (1982). Error bars denote 95% confidence intervals of the model simulations. Panels A, B, and D adapted from “Effects of Alternating Set for Speed or Accuracy on Response Time, Accuracy and Confidence in a Unidimensional Discrimination Task,” by D. Vickers and J. Packer, 1982, Acta Psychologica, 50(2), 179–197 (https://doi.org/10.1016/0001-6918(82)90006-3). Copyright 1982 by Elsevier. Adapted with permission. Panel C adapted from “The Nature of Metacognitive Inefficiency in Perceptual Decision Making,” by M. Shekhar and D. Rahnev, 2021a, Psychological Review, 128(1), 45–70 (https://doi.org/10.1037/rev0000249). Copyright 2021 by the American Psychological Association. Adapted with permission. ABS = Autocorrelated Bayesian Sampler. See the online article for the color version of this figure.
Figure 9
Figure 9. Generating and Evaluating Confidence Intervals
Note. (A) Empirical data for interval evaluation (i.e., probability judgment) and interval production, adapted from “Calibration, Additivity, and Source Independence of Probability Judgments in General Knowledge and Sensory Discrimination Tasks,” by P. Juslin, A. Winman, and H. Olsson, 2003, Organizational Behavior and Human Decision Processes, 92(1–2), 34–51 (https://doi.org/10.1016/S0749-5978(03)00063-3). Copyright 2003 by Elsevier. Adapted with permission. Interval evaluations were relatively well calibrated while substantial overconfidence was observed in interval production. The dashed line illustrates perfect calibration. (B) ABS predictions of confidence interval production and evaluation: strong overconfidence in interval production (dots) and no overconfidence in interval evaluation (squares). The horizontal axis indicates either the requested interval coverage (production) or the judged probability of the interval (evaluation), while the vertical axis indicates the empirical proportion of events covered by the interval. ABS = Autocorrelated Bayesian Sampler.
Figure 10
Figure 10. Anchoring and Repulsion Effects
Note. (A) Experimental data on the decision-estimation task. For the region of correct hypotheses in the range of [21, 30], the estimates were pushed away from a nearby comparison value (25.5) used in the preceding decision task (blue bars), while pulled toward a far-off comparison value (75.5; red bars). The data was replotted from Spicer et al. (2022a). (B) Simulating the ABS (right), its direct sampling variant (left), and fixed sample size variant (middle) on decision-estimation tasks. The full ABS model predicts both anchoring (for far-away target stimuli; red bars) and repulsion effects (for close-by target stimuli; blue bars), whereas the direct-sampling variant only predicts the repulsion effect and the fixed-sample-size variant only predicts the anchoring bias. Target Gaussian distributions for sampling with means in the range of [21, 30] were shown in black solid lines, which were vertically rescaled by a factor of 1/4 to aid visualization. ABS = Autocorrelated Bayesian Sampler. See the online article for the color version of this figure.
Figure 11
Figure 11. Power Spectra for Time Series of Estimates and RT
Note. Dashed lines denote power spectra by a simulated participant with solid lines showing the average. RT time series are colored in red, whereas time series of estimates are in blue. (Left) The direct sampling variant predicts independent estimates and RTs and thus exhibits a flat line (i.e., the power spectrum of white noise). (Right) The ABS model predicts autocorrelations in estimates and RTs with the latter displaying flatter slopes than the former (i.e., the power spectra of 1/f noise). ABS = Autocorrelated Bayesian Sampler; RT = response times. See the online article for the color version of this figure.
Figure 12
Figure 12. Further Illustrations of the Autocorrelated Sampling Process (Top) and the Bayesian Monte Carlo Process (Bottom), Expanding the Illustrative Example of Numerosity in Figure 2B
Note. Here, the sampler was automatically terminated when five samples were generated, while the dashed lines denote potential future samples if continued. Samples were compared to a decision boundary of 25 (red dots: evidence for lower than 25 dots, blue dots: evidence for greater than or equal to 25). The five samples were then integrated with a prior on responses (here used an asymmetric prior, Beta(2, 1)), reaching a posterior of Beta(5, 3). The mean of this posterior on responses was then used to generate probability judgments or confidence judgments in decision-making. See the online article for the color version of this figure.
Figure C1
Figure C1. Decision Thresholds Obtained From Solving the Dynamic Programming Problem
Note. The sampling algorithm should be terminated once the accumulator reaches the yellow terminating regions. In this illustration, the accumulator started at the top-left corner {i = 0, j = 0} (white triangle) and terminated at the state {i = 3, j = 5} (white circle). See the online article for the color version of this figure.
Figure D1
Figure D1. An Illustration of Metacognitive Inefficiency Arising Not From Loss of Information in Confidence Judgment, but From Incorrectly Assuming Gaussian Generating Distributions
Note. Two confidence criteria were shown (x, y, where x > y). Hit rates were calculated based on the binomial distribution Bin(N,p) (black circles) given its intersection with a confidence criterion, whereas similarly false alarm rates were calculated using the symmetric binomial distribution Bin(N, 1 − p) (black squares). In this illustrative example, N = 12 and p = .8. Using a Gaussian to compute mete_d′ (difference in the horizontal positions of the solid curves) will lead to a decrease in value when the confidence criterion increases: mete_d′(x) < mete_d′(y). See the online article for the color version of this figure.
Figure E1
Figure E1. Using the Sample Average, Rather Than the Last Sample, as the Estimate Does Not Qualitatively Change Model Behaviors
Note. (A) The model predicts co-occurrence of repulsion and anchoring as shown in Figure 10. (B) The model produces 1/f noise as shown in Figure 11. The sample size used in the simulations was fixed at 5. See the online article for the color version of this figure.
Figure F1
Figure F1. Probability judgments and Response Times
Note. (A) Window-binned (bin width equals to 0.05) probability judgments show no relationship with response times. Empirical data were reanalyzed from the three experiments shown in the legend. Dots are mean RTs and shaded areas cover 95% confidence interval. (B) Histograms of RT data. Across the three experiments, RTs for probability judgments are unimodal and positively skewed. Colored lines are best-fitting Gamma distributions. RTs greater than 60 s were excluded from analysis. RT = response times. See the online article for the color version of this figure.

References

    1. Abbott J. T., & Griffiths T. L. (2011). Exploring the influence of particle filter parameters on order effects in causal learning. In Carlson L., Hoelscher C., & Shipley T. F. (Eds.), Proceedings of the annual meeting of the cognitive science society (pp. 2950–2955). Cognitive Science Society.
    1. Anderson J. R. (1991). The adaptive nature of human categorization. Psychological Review, 98(3), 409–429. 10.1037/0033-295X.98.3.409 - DOI
    1. Andrieu C., De Freitas N., Doucet A., & Jordan M. I. (2003). An introduction to MCMC for machine learning. Machine Learning, 50(1), 5–43. 10.1023/A:1020281327116 - DOI
    1. Aragones E., Gilboa I., Postlewaite A., & Schmeidler D. (2005). Fact-free learning. The American Economic Review, 95(5), 1355–1368. 10.1257/000282805775014308 - DOI
    1. Ariely D., Au W. T., Bender R. H., Budescu D. V., Dietz C. B., Gu H., Wallsten T. S., & Zauberman G. (2000). The effects of averaging subjective probability estimates between and within judges. Journal of Experimental Psychology: Applied, 6(2), 130–147. 10.1037/1076-898X.6.2.130 - DOI - PubMed