. 2023 Jun 9;380(6649):eabn9257.
doi: 10.1126/science.abn9257. Epub 2023 Jun 9.

Taurine deficiency as a driver of aging

Affiliations

Taurine deficiency as a driver of aging

Parminder Singh et al. Science. .

Abstract

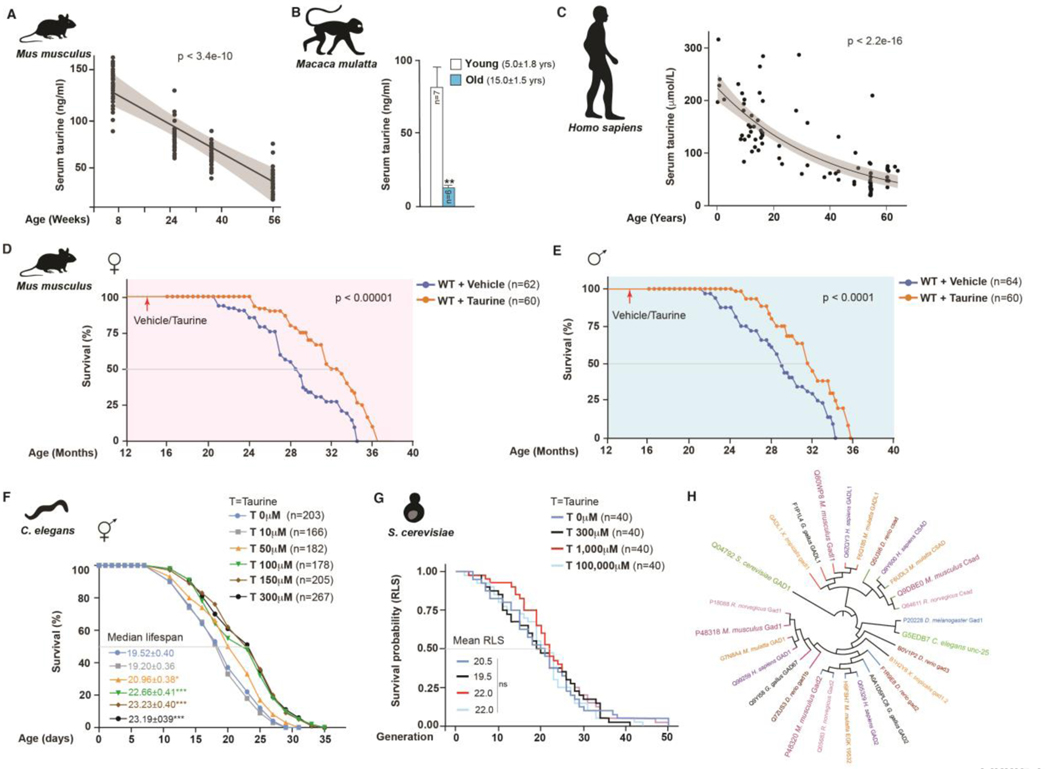
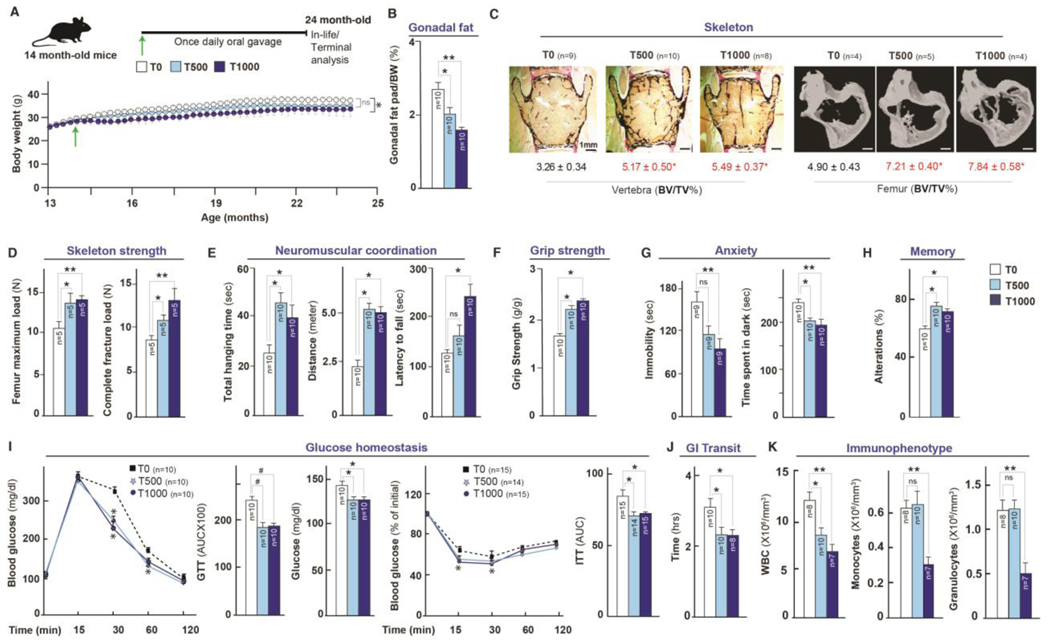
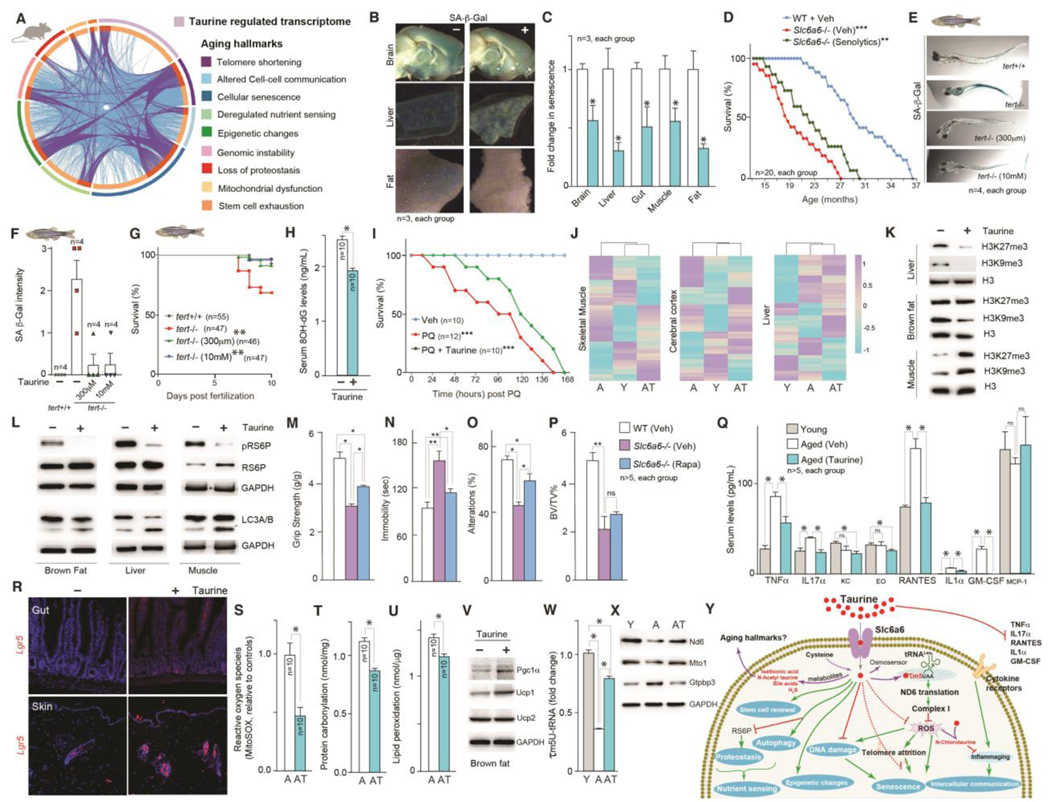
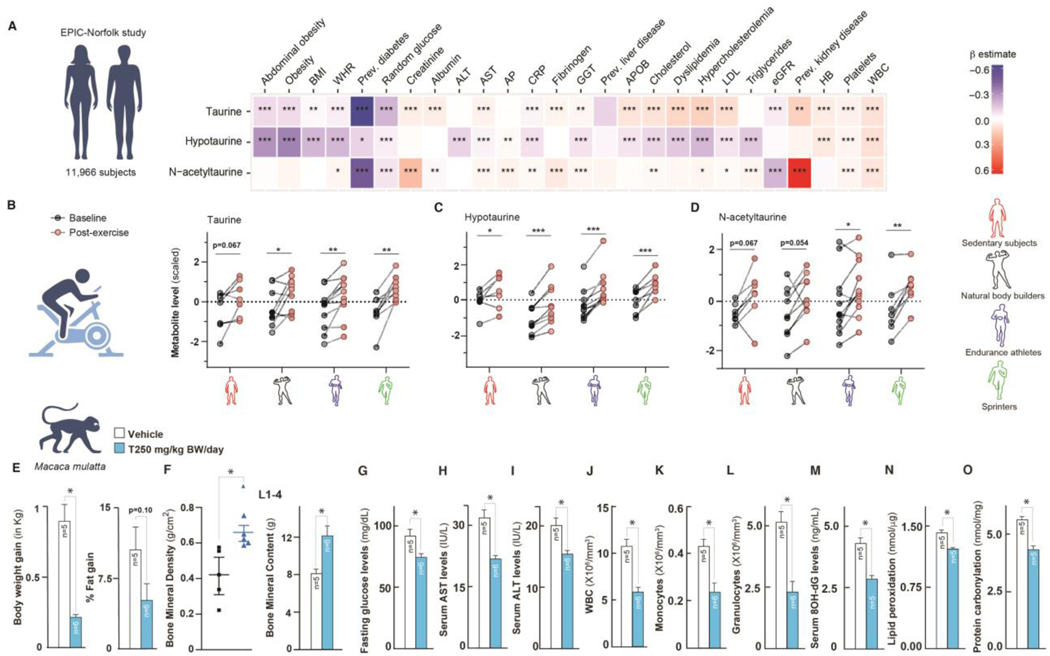
Aging is associated with changes in circulating levels of various molecules, some of which remain undefined. We find that concentrations of circulating taurine decline with aging in mice, monkeys, and humans. A reversal of this decline through taurine supplementation increased the health span (the period of healthy living) and life span in mice and health span in monkeys. Mechanistically, taurine reduced cellular senescence, protected against telomerase deficiency, suppressed mitochondrial dysfunction, decreased DNA damage, and attenuated inflammaging. In humans, lower taurine concentrations correlated with several age-related diseases and taurine concentrations increased after acute endurance exercise. Thus, taurine deficiency may be a driver of aging because its reversal increases health span in worms, rodents, and primates and life span in worms and rodents. Clinical trials in humans seem warranted to test whether taurine deficiency might drive aging in humans.


Conflict of interest statement

Competing interests: Columbia University has filed provisional patent applications for which VKY is an inventor. The remaining authors declare no competing interests.

Figures

Fig. 1.
Fig. 1.. Taurine deficiency is a driver of aging in evolutionarily divergent species.
(A-C) Serum taurine levels in female mice at different ages (A), in young (5-year-old) and old (15-year-old) female monkeys (B), and in humans at different ages (C). (D-E) Lifespan assay of middle-aged (14-month-old) wild-type (WT) female (D) and male (E) C57Bl/6J mice orally fed taurine (T, 1000 mg/kg BW/day) at 10:00 h till the end of life. (F) Lifespan assay of wild-type nematodes that were fed diet supplemented with different concentrations of taurine (0, 10, 50, 100, 150, and 300 μM). (G) Replicative lifespan (RLS) assay in yeast cultured on YPD plates with different concentrations of taurine (0, 300, 1000, and 100,000 μM). (H) Phylogenetic analysis of taurine biosynthesis enzymes in eukaryotes. Statistical analysis: The OASIS software (http://sbi.postech.ac.kr/oasis) was used for calculating p-values using a log rank test (the Mantel–Cox method) in mice and worm experiments. Wilcoxon rank-sum test was used by for calculating p-values in yeast RLS assays. N is represented within panels. All values are mean ± SEM. p ≤ 0.0001****, p ≤ 0.001***, p ≤ 0.01**, and p ≤ 0.05* are versus WT or control.
Fig. 2.
Fig. 2.. Taurine supplementation increases healthspan in aged mice.
(A-K) Changes in body weight (A), Fat % (B), bone structure, and strength parameters in spine and femur (C-D), neuromuscular and muscle strength (E-F, rotarod, wire hang, and grip-strength tests), anxiety (G, tail suspension and dark-light tests), memory (H, Y maze test), pancreas function (I, glucose and insulin tolerance tests), gastrointestinal (GI) transit (J, oral carmine dye test), and immunophenotyping (K, immune cell parameters in blood) in 24-month-old wild-type C57Bl/6J female mice orally fed, once daily with taurine (0, 500 or 1000 mg/kg BW/day) from middle-age (14 months). Statistical analysis was performed using Graph Pad Prism 7. Data were considered statistically significant at p ≤ 0.05 using the Student’s t-test, one-way or two-way ANOVA. n is represented within panels. All values are mean ± SEM. ns, not significant. p ≤ 0.001***, p ≤ 0.01**, and p ≤ 0.05* are versus WT or control.
Fig. 3.
Fig. 3.. Taurine regulation of healthy lifespan is associated with alterations in multiple aging hallmarks.
(A) Circos plot representing a comparative analysis of taurine-deficient transcriptome with the core gene signatures of nine aging hallmarks. (B-C) Senescence-associated beta-galactosidase (SA-β-Gal) staining (blue-stained cells) (B) and relative quantification of staining (C) in tissues collected from mice with or without taurine supplementation. (D) Lifespan assay of congenitally taurine-deficient (Slc6a6-/-) mice and littermate controls that received either vehicle or senolytics (dasatinib [D] + quercetin [Q]) bi-weekly till the end of their life. (E-G) SA-β-Gal staining photomicrographs (E), relative quantification of staining (F), and survival analysis (G) of telomerase deficient [tert-/-(G2)] zebrafish embryos with or without taurine supplementation (300 μm or 10 mM) from 2 days post-fertilization. (H) Serum 8-OH-dG concentrations in vehicle- or taurine-treated mice. (I) Kaplan–Meier survival curves for mice following paraquat, with or without prior taurine supplementation (T1000, for 1 month). (J-K) Comparative DNA methylation levels of 2045 age-related CpG sites in the muscle, cerebral cortex, and liver (J) and changes in histone H3K27me3, H3K9me3, and H3 levels in the liver, brown fat, and muscle (K) of 4-month-old WT (Young, Y), 16-month-old vehicle-treated WT (Aged, A), and 16-month-old taurine-treated WT (Aged-Taurine, AT) mice. (L) Changes in phospho-ribosomal S6 protein (pRS6P) and LC3A/B levels in the brown fat, liver, and muscle of vehicle- or taurine-treated aged mice. (M-P) Changes in muscle function (M, grip-strength test), anxiety (N, tail suspension test), memory (O, Y maze test), and bone mass (P, BV/TV %) in 6-month-old congenitally taurine-deficient (Slc6a6-/-) mice and littermate controls that received either vehicle or rapamycin (once-daily, for 6 weeks). (Q) Serum levels of various cytokines in young, aged, and aged mice treated with taurine. (R) In situ hybridization analysis of Lgr5 expression in the gut and skin (R), levels of mitochondrial ROS (superoxide anion radicals, MitoSOX assay) in skeletal muscle mitochondria (S), protein carbonyl levels in the liver (T), lipid peroxidation levels in the liver (U), Pgc1α, Ucp1, and Ucp2 levels in the brown fat (V) of aged mice treated without or with taurine. (W-X) Changes in 5-taurinomethylUridine (τm5U) tRNA modification (W), and Nd6, Mto1, and Gtpbp3 protein levels in the liver (X) of young, aged, and aged mice treated with taurine. (Y) Schematic representation of the effect of taurine and taurine-derived biomolecules (in red) on classical hallmarks of aging. n ≥ 6 mice in each group. Western blots are representative of at least three independent biological replicates. Statistical analysis: For panels D, G, I, the OASIS software (http://sbi.postech.ac.kr/oasis) was used for calculating p-values using a log rank test (the Mantel–Cox method). For other panels, statistical analysis was performed using Graph Pad Prism 7 employing Student’s t-test, one-way or two-way ANOVA. All values are mean ± SEM. ns, not significant. p ≤ 0.0001****, p ≤ 0.001***, p ≤ 0.01**, and p ≤ 0.05* are versus WT or control.
Fig. 4.
Fig. 4.. Taurine pathway affects healthspan in primates.
(A) Heatmap showing the results from linear regression models for assessing the associations between clinical risk factors and taurine-related metabolites (taurine, hypotaurine, and N-acetyltaurine) in blood from 11,966 subjects in the EPIC-Norfolk study. Effect size and direction of these associations are given by the β-estimates resulting from these regression models. A negative β-estimate (blue color) indicates an inverse association, where higher levels of a metabolite correlated with lower levels of a clinical parameter. A positive β-estimate (red color) indicates a positive association, where higher levels of a metabolite correlated with higher levels of a clinical parameter. For example, as shown in blue, higher levels of taurine correlated with lower prevalence of type 2 diabetes. Taurine-related metabolites were measured using an untargeted metabolomics approach (Metabolon HD4 platform). Data were extracted from the open-access web server (https://omicscience.org/apps/mwasdisease/). BMI, Body mass index; WHR, waist-to-hip ratio; AST, aspartate aminotransferase; ALT, alanine aminotransferase; AP, alkaline phosphatase; CRP, C-reactive protein, APOB, apolipoprotein B; LDL, low-density lipoprotein; eGFR, estimated glomerular filtration rate; HB, hemoglobin; WBC, white blood cell count. (B-D) Serum taurine (B), hypotaurine (C), and N-acetyltaurine (D) levels at fasted rest (=baseline) and 5 minutes after a maximum graded exercise test (= post-exercise) in three groups of competitive athletes and healthy sedentary subjects. Metabolite levels are provided as z-scores, i.e., relative to the mean of measured levels with mean = 0 and standard deviation = 1. (E-O) Body weight gain in kilogram and % fat gain (E), bone mineral density and content in Lumber 1–4 (F, bone), fasting glucose levels (G, pancreas function), serum AST and ALT levels (H-I, liver dysfunction markers), WBC/monocyte/granulocyte numbers (J-L, immunophenotyping in blood), serum 8-OH-dG, lipid peroxide, and protein carbonyl levels (M-O, indirect markers of ROS-induced molecular damages) in 15-year-old monkeys orally fed once-daily with vehicle (T0) or taurine (T250) for 6 months. Statistical analysis: (A) Summary statistics, including standardized regression coefficients (β-estimates) and nominal p-values on a relevant subset of 26 clinical traits and three taurine-related metabolites were extracted from the web server. Regression coefficients and nominal p-values were plotted in a heatmap using R version 4.1.0. Statistical analysis for the exercise cohort (B-D): Differences between baseline and post-exercise metabolite levels were analyzed per subject group using a paired sample t-test. Batch corrections were done using R version 4.1.0; the graphs were prepared using GraphPad Prism. For other panels (E-O), statistical analysis was performed using Graph Pad Prism 7 employing the Student’s t-test, one-way or two-way ANOVA. All values are mean ± SEM. ns, not significant. p ≤ 0.0001****, p ≤ 0.001***, p ≤ 0.01**, and p ≤ 0.05* are versus WT or control.

Comment in

  • Taurine levels modulate aging.
    Kriebs A. Kriebs A. Nat Aging. 2023 Jul;3(7):758-759. doi: 10.1038/s43587-023-00465-3. Nat Aging. 2023. PMID: 37414989 No abstract available.

References

    1. D. o. E. a. S. A. United Nations, Population Division, World populations ageing 2019, highlights. https://www.un.org/en/development/desa/population/publications/pdf/agein..., (2019).
    1. Mkrtchyan GV et al., ARDD 2020: from aging mechanisms to interventions. Aging (Albany NY) 12, 24484–24503 (2020). - PMC - PubMed
    1. Gems D, Partridge L, Genetics of longevity in model organisms: debates and paradigm shifts. Annu Rev Physiol 75, 621–644 (2013). - PubMed
    1. Campisi J. et al., From discoveries in ageing research to therapeutics for healthy ageing. Nature 571, 183–192 (2019). - PMC - PubMed
    1. Meyer K, Yankner BA, Slowing Down Aging. Cell Metab 26, 592–593 (2017). - PubMed