

Short-chain fatty acids and insulin sensitivity: a systematic review and meta-analysis
- PMID: 37290429
- PMCID: PMC10777678
- DOI: 10.1093/nutrit/nuad042
Short-chain fatty acids and insulin sensitivity: a systematic review and meta-analysis
Abstract
Context: There is substantial evidence that reduced short-chain fatty acids (SCFAs) in the gut are associated with obesity and type 2 diabetes, although findings from clinical interventions that can increase SCFAs are inconsistent.
Objective: This systematic review and meta-analysis aimed to assess the effect of SCFA interventions on fasting glucose, fasting insulin, and homeostatic model assessment of insulin resistance (HOMA-IR).
Data sources: Relevant articles published up to July 28, 2022, were extracted from PubMed and Embase using the MeSH (Medical Subject Headings) terms of the defined keywords [(short-chain fatty acids) AND (obesity OR diabetes OR insulin sensitivity)] and their synonyms. Data analyses were performed independently by two researchers who used the Cochrane meta-analysis checklist and the PRISMA guidelines.
Data extraction: Clinical studies and trials that measured SCFAs and reported glucose homeostasis parameters were included in the analysis. Standardized mean differences (SMDs) with 95%CIs were calculated using a random-effects model in the data extraction tool Review Manager version 5.4 (RevMan 5.4). The risk-of-bias assessment was performed following the Cochrane checklist for randomized and crossover studies.
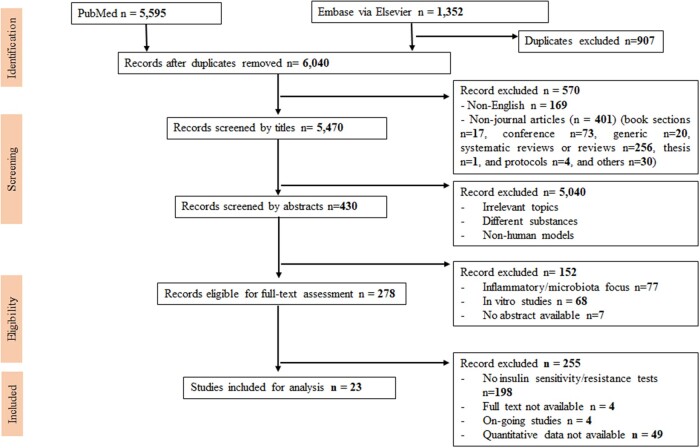
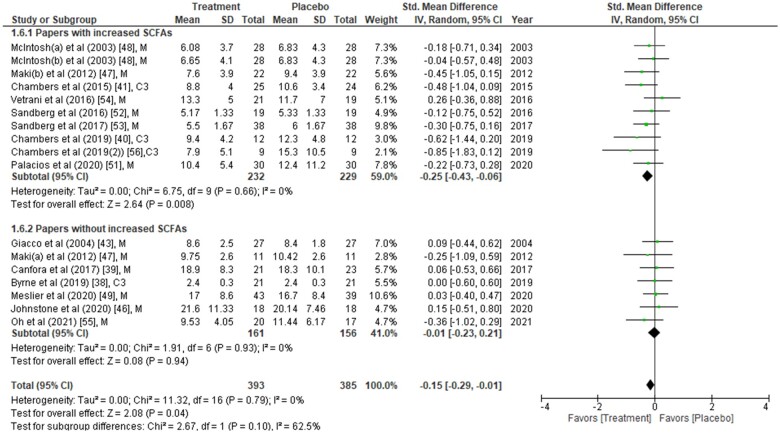
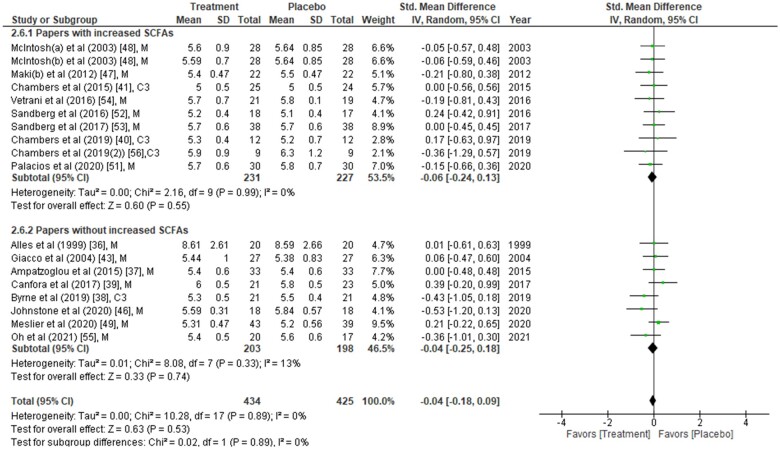
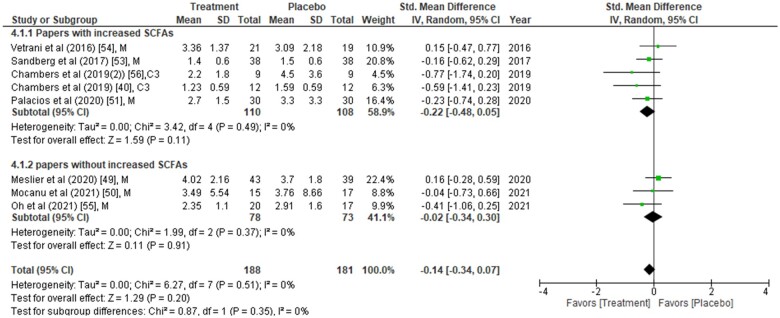
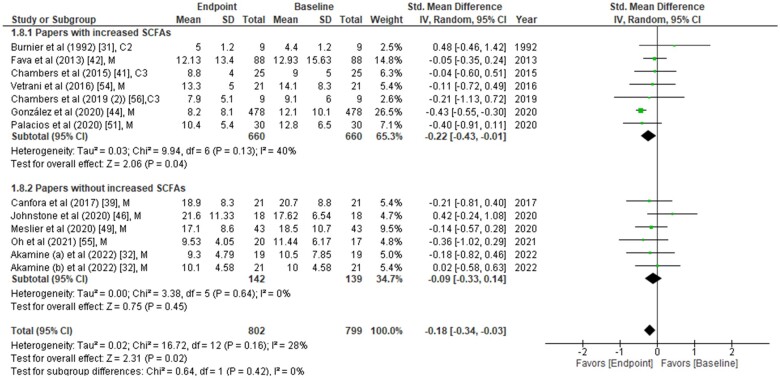
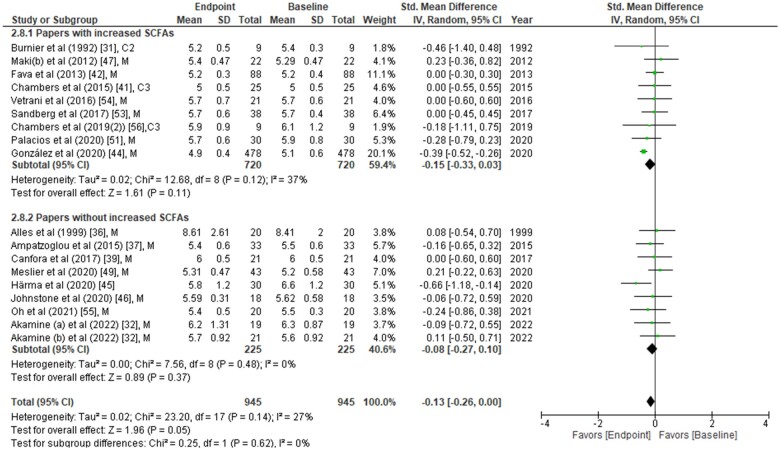
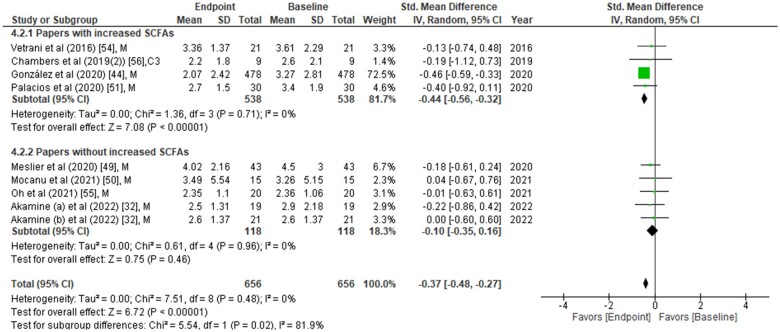
Data analysis: In total, 6040 nonduplicate studies were identified, 23 of which met the defined criteria, reported fasting insulin, fasting glucose, or HOMA-IR values, and reported change in SCFA concentrations post intervention. Meta-analyses of these studies indicated that fasting insulin concentrations were significantly reduced (overall effect: SMD = -0.15; 95%CI = -0.29 to -0.01, P = 0.04) in treatment groups, relative to placebo groups, at the end of the intervention. Studies with a confirmed increase in SCFAs at the end of intervention also had a significant effect on lowering fasting insulin (P = 0.008). Elevated levels of SCFAs, compared with baseline levels, were associated with beneficial effects on HOMA-IR (P < 0.00001). There was no significant change in fasting glucose concentrations.
Conclusion: Increased postintervention levels of SCFAs are associated with lower fasting insulin concentrations, offering a beneficial effect on insulin sensitivity.
Systematic review registration: PROSPERO registration number CRD42021257248.
Keywords: HOMA-IR; acetate; butyrate; insulin sensitivity; propionate; short-chain fatty acids; type 2 diabetes.
© The Author(s) 2023. Published by Oxford University Press on behalf of the International Life Sciences Institute.
Figures
Similar articles
-
The Role of Dietary Fibre in Modulating Gut Microbiota Dysbiosis in Patients with Type 2 Diabetes: A Systematic Review and Meta-Analysis of Randomised Controlled Trials.Nutrients. 2020 Oct 23;12(11):3239. doi: 10.3390/nu12113239. Nutrients. 2020. PMID: 33113929 Free PMC article.
-
The Effects of Almonds on Gut Microbiota, Glycometabolism, and Inflammatory Markers in Patients with Type 2 Diabetes: A Systematic Review and Meta-Analysis of Randomised Controlled Trials.Nutrients. 2021 Sep 26;13(10):3377. doi: 10.3390/nu13103377. Nutrients. 2021. PMID: 34684378 Free PMC article.
-
Omega-3, omega-6, and total dietary polyunsaturated fat for prevention and treatment of type 2 diabetes mellitus: systematic review and meta-analysis of randomised controlled trials.BMJ. 2019 Aug 21;366:l4697. doi: 10.1136/bmj.l4697. BMJ. 2019. PMID: 31434641 Free PMC article.
-
Effect of folate supplementation on insulin sensitivity and type 2 diabetes: a meta-analysis of randomized controlled trials.Am J Clin Nutr. 2019 Jan 1;109(1):29-42. doi: 10.1093/ajcn/nqy234. Am J Clin Nutr. 2019. PMID: 30615110
-
The effects of SCFAs on glycemic control in humans: a systematic review and meta-analysis.Am J Clin Nutr. 2022 Aug 4;116(2):335-361. doi: 10.1093/ajcn/nqac085. Am J Clin Nutr. 2022. PMID: 35388874 Free PMC article.
Cited by
-
Anaerobutyricum soehngenii Reduces Hepatic Lipogenic Pathways and Increases Intestinal Gluconeogenic Gene Expression in Metabolic-Dysfunction-Associated Steatotic Liver Disease (MASLD) Mice.Int J Mol Sci. 2024 Mar 20;25(6):3481. doi: 10.3390/ijms25063481. Int J Mol Sci. 2024. PMID: 38542455 Free PMC article.
-
Faecal (or intestinal) microbiota transplant: a tool for repairing the gut microbiome.Gut Microbes. 2024 Jan-Dec;16(1):2423026. doi: 10.1080/19490976.2024.2423026. Epub 2024 Nov 5. Gut Microbes. 2024. PMID: 39499189 Free PMC article. Review.
-
Network Pharmacology and Serum Nontargeted Metabolomics Reveal the Protective Effects of Propionate Against Liver Damage Induced by a High-Fat and AGE-Rich Diet in Diabetic Mice.J Diabetes Res. 2025 Jul 2;2025:3955893. doi: 10.1155/jdr/3955893. eCollection 2025. J Diabetes Res. 2025. PMID: 40636075 Free PMC article.
-
Berberine as a Bioactive Alkaloid: Multi-Omics Perspectives on Its Role in Obesity Management.Metabolites. 2025 Jul 9;15(7):467. doi: 10.3390/metabo15070467. Metabolites. 2025. PMID: 40710568 Free PMC article. Review.
-
Short-chain fatty acids as a novel intervention for high-fat diet-induced metabolic syndrome.Mol Cell Biochem. 2025 May;480(5):3169-3184. doi: 10.1007/s11010-024-05185-9. Epub 2024 Dec 21. Mol Cell Biochem. 2025. PMID: 39709317
References
-
- Alberti K, Zimmet PZ.. Definition, diagnosis and classification of diabetes mellitus and its complications. Part 1: diagnosis and classification of diabetes mellitus. Provisional report of a WHO consultation. Diabet Med. 1998;15:539–553. - PubMed
-
- International Diabetes Federation. IDF Diabetes Atlas. 9th ed.International Diabetes Federation; 2019. https://diabetesatlas.org/atlas/ninth-edition/
-
- International Diabetes Federation. IDF Diabetes Atlas. 10th ed. International Diabetes Federation; 2021. https://diabetesatlas.org/atlas/tenth-edition/
-
- World Health Organization. Obesity and overweight. Fact sheet no. 311. World Health Organization. Published 2015. Updated 9 June 2021. https://www.who.int/news-room/fact-sheets/detail/obesity-and-overweight
Publication types
MeSH terms
Substances
Grants and funding
LinkOut - more resources
Full Text Sources
Medical
Miscellaneous
