. 2023 Jun 20;4(6):101074.
doi: 10.1016/j.xcrm.2023.101074. Epub 2023 Jun 7.

Elevated cfDNA after exercise is derived primarily from mature polymorphonuclear neutrophils, with a minor contribution of cardiomyocytes

Affiliations

Elevated cfDNA after exercise is derived primarily from mature polymorphonuclear neutrophils, with a minor contribution of cardiomyocytes

Ori Fridlich et al. Cell Rep Med. .

Abstract

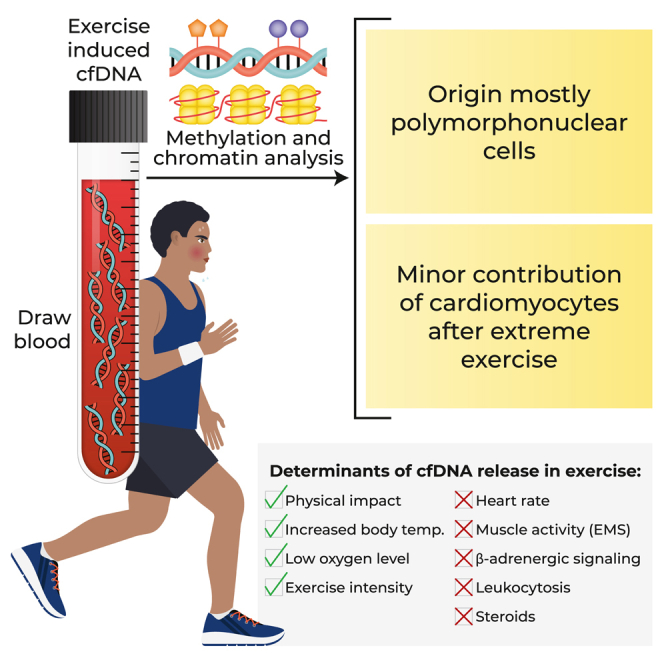
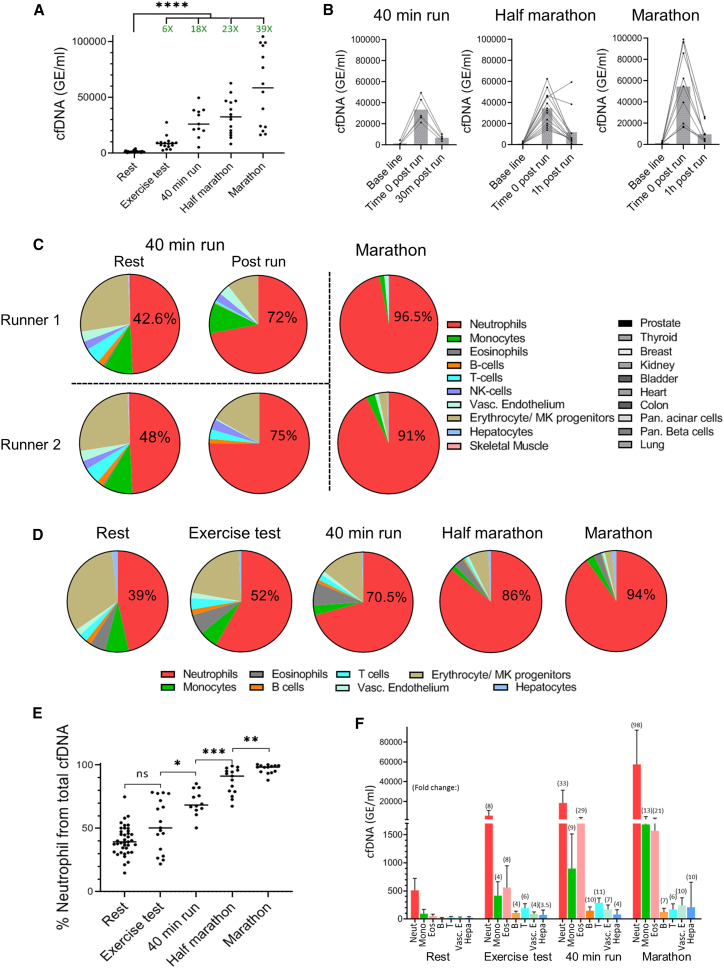
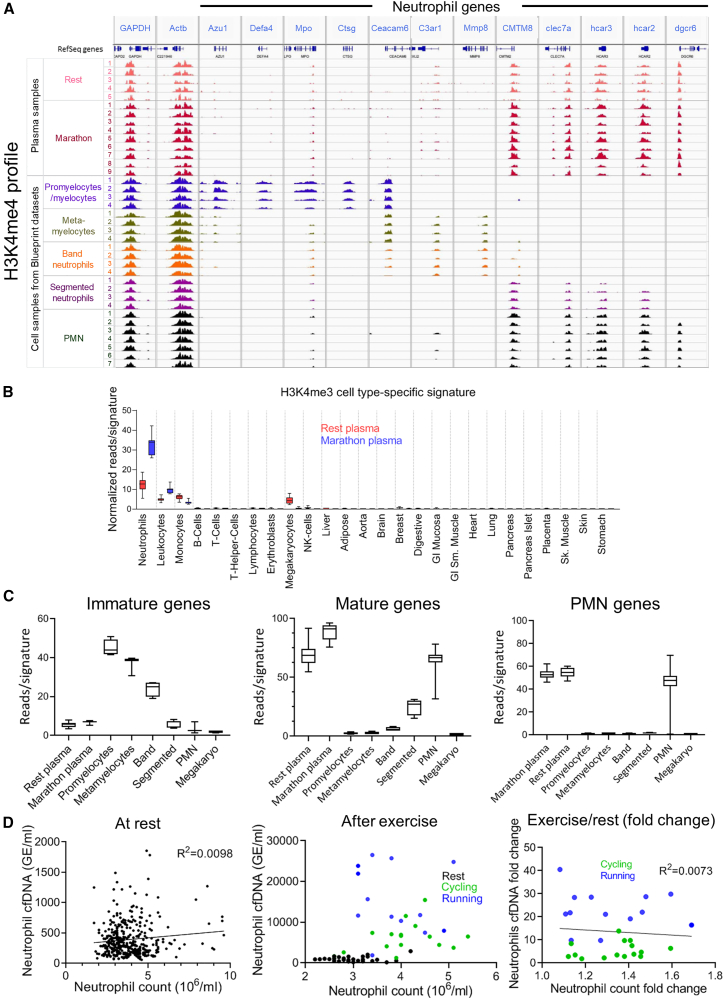
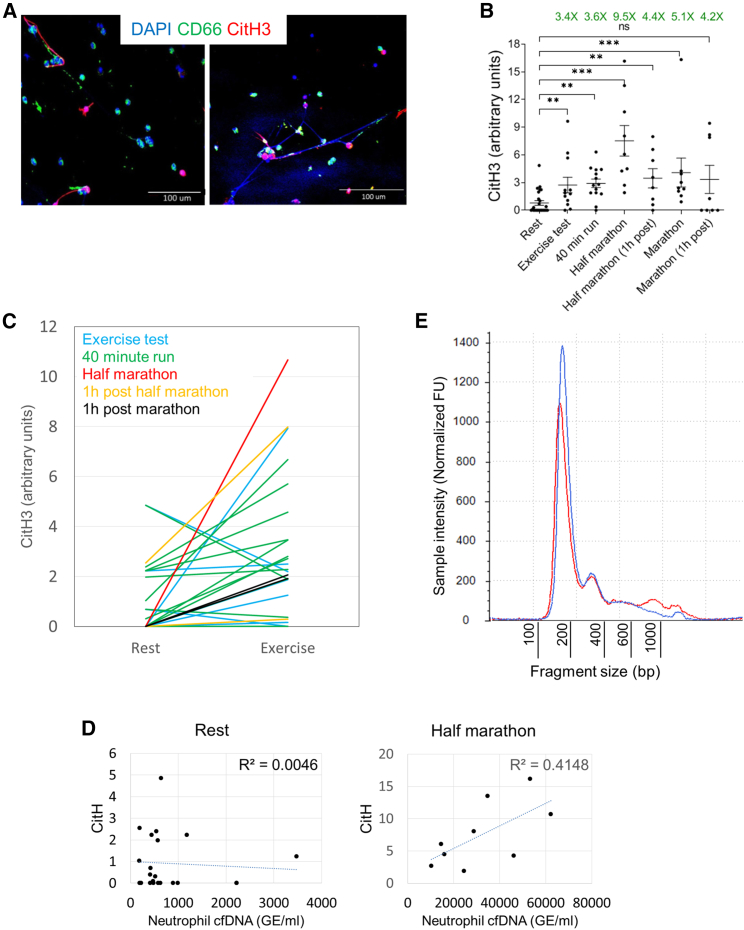
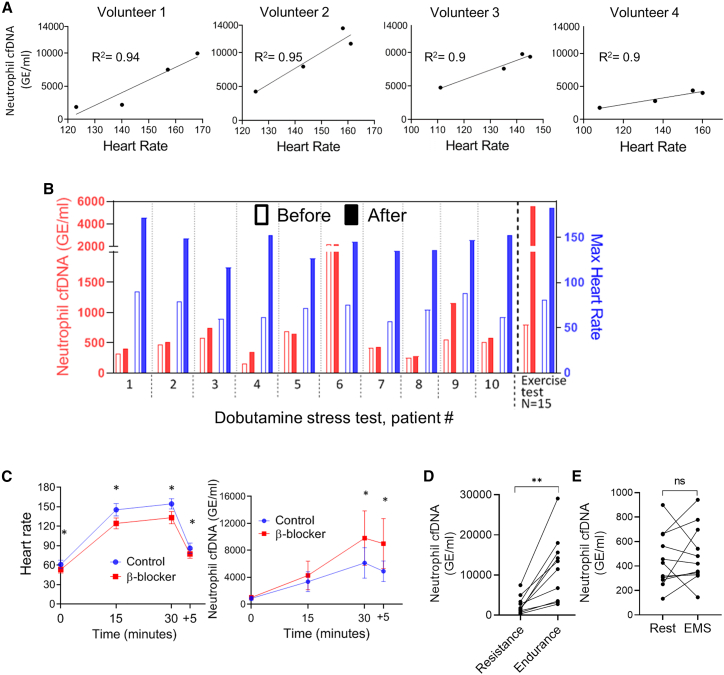
Strenuous physical exercise causes a massive elevation in the concentration of circulating cell-free DNA (cfDNA), which correlates with effort intensity and duration. The cellular sources and physiological drivers of this phenomenon are unknown. Using methylation patterns of cfDNA and associated histones, we show that cfDNA in exercise originates mostly in extramedullary polymorphonuclear neutrophils. Strikingly, cardiomyocyte cfDNA concentration increases after a marathon, consistent with elevated troponin levels and indicating low-level, delayed cardiac cell death. Physical impact, low oxygen levels, and elevated core body temperature contribute to neutrophil cfDNA release, while muscle contraction, increased heart rate, β-adrenergic signaling, or steroid treatment fail to cause elevation of cfDNA. Physical training reduces neutrophil cfDNA release after a standard exercise, revealing an inverse relationship between exercise-induced cfDNA release and training level. We speculate that the release of cfDNA from neutrophils in exercise relates to the activation of neutrophils in the context of exercise-induced muscle damage.

Keywords: ChIP-seq; chromatin; circulating cell-free DNA; exercise biology; fitness; inflammation; methylation; neutrophil extracellular traps; neutrophils; polymorphonuclear cells.


Conflict of interest statement

Declaration of interests R. Sadeh, G.F., I.S., and N.F. are founders and/or employees of Senseera Inc. J.M., B.G., R. Shemer, and Y.D. have filed patents on cfDNA methylation analysis.

Figures

None
Graphical abstract
Figure 1
Figure 1
cfDNA is elevated after physical exercise and originates from neutrophils (A) cfDNA levels increase time dependently after running. Exercise test, 12 min of incremental treadmill running until exhaustion (n = 17); 40-min run, designed to reach the heart rate measured at anaerobic threshold (n = 12); half marathon (n = 15), run time 1:40–2:20 h; full marathon (n = 14), run time 3:31–6:15 h. Dots represent individuals. Vertical lines represent mean. ∗∗∗∗p < 0.0001, two-tailed Mann-Whitney test. Green numbers represent cfDNA fold change from baseline. (B) cfDNA levels decline rapidly at the end of physical effort. Bars represent mean. (C) Deconvolution of the plasma methylome, obtained using Illumina EPIC arrays. Two individuals donated blood at rest and after a 40-min run. Two other individuals donated blood after a marathon. Deconvolution was performed using a reference atlas containing 25 tissue methylomes, as described (Moss et al.8). (D) Targeted methylation analysis of cfDNA using markers for selected tissues. Charts in (B) and (C) show the relative contribution of each cell type to the total. (E) The relative contribution of neutrophils to the total cfDNA pool in different exercise protocols, measured by targeted methylated analysis. Each dot is one individual. Vertical lines represent mean. ∗p < 0.05; ∗∗p < 0.01; ∗∗∗p < 0.001; ns, non-significant. Rest vs. exercise test and exercise test vs. run 40 min: two-tailed Wilcoxon matched-pairs signed rank test. Run 40 min vs. half marathon and half marathon vs. marathon: two-tailed Mann-Whitney test. (F) cfDNA from specific tissues after exercise, in GE per milliliter of plasma. Concentration was derived by multiplying the total concentration of cfDNA in each sample by the fraction contributed by each cell type as shown in (D). Numbers in brackets represent fold change from baseline. Bars represent mean (of data from 12 individuals) and standard deviation.
Figure 2
Figure 2
Cardiomyocyte-derived cfDNA in exercise (A) Cardiac troponin I (cTnI) serum levels immediately and 2 h after completion of half and full marathon (n = 13 and n = 14). Black vertical line represents median. Vertical lines represent mean. ∗p < 0.05, ∗∗p < 0.01. Two-tailed Wilcoxon matched-pairs signed rank test. (B) Analysis of cardiomyocyte-derived cfDNA after half and full marathon using targeted methylation markers. Black vertical line represents median. Shown is the percentage of cardiomyocyte cfDNA of the total (left) and the concentration of cardiomyocyte cfDNA (right). Vertical lines represent the mean. ns, not significant, ∗p < 0.05, ∗∗p < 0.01: two-tailed Wilcoxon matched-pairs signed rank test. (C) Correlation between total cfDNA levels immediately after a run (left), TnI 2 h after a run (middle), and weekly running time in the 2 months prior to running event (right) to the percentage of cardiac cfDNA 2 h post-run. (D) Cardiomyocyte-derived cfDNA after various exercise protocols. Vertical lines represent the mean. ns, not significant, ∗∗p < 0.01: two-tailed Mann-Whitney test.
Figure 3
Figure 3
Analysis of neutrophil-derived cfDNA in exercise (A) cfChIP-seq to identify cfDNA cell of origin in exercise. Representative tracks after chromatin immunoprecipitation sequencing (ChIP-seq) for H3K4me3. Shown are tracks for promoters of house-keeping genes (GAPDH and ActB) and promoters of genes characteristic of neutrophil developmental stages (Azu1, Defa4, Mpo, Ctsg, Ceacam6, markers of promyelocytes/myelocytes; Ceacam6, C3ar1, Mmp8, markers of metamyelocytes and band neutrophils; CMTM2, clec7a, hcar3, hcar2, markers of segmented neutrophils; CMTM2, clec7a, hcar3, hcar2, dgcr6, markers of PMNs). PMN gene promoters are abundantly present in rest and marathon plasma. Blueprint sample IDs are specified in Table S3. (B) cfChIP-seq H3K4me3 signal from indicated cell types (number of sequence reads per cell type signature, normalized as described in STAR Methods). Immunoprecipitation was performed using anti-H3K4me3 antibodies on plasma samples from volunteers at rest (n = 15) and immediately after a marathon (n = 9). Vertical line represents median. Whiskers represent minimum to maximum. (C) H3K4me3 ChIP-seq data on promoters of genes characteristic of neutrophil developmental stages, from sorted cells and from resting and post-marathon plasma samples (this work). PMN, polymorphonuclear neutrophils; Megakaryo, megakaryocytes. Vertical line represents median. Whiskers represent minimum to maximum. (D) The relationship between neutrophil cfDNA concentration and neutrophil counts at rest (black, n = 400) and after exercise (cycling for 30 min, green, n = 16; running for 30 min, blue, n = 13). Each dot represents one plasma sample.
Figure 4
Figure 4
NETs are elevated after exercise (A) Immunofluorescence staining for NETs. NET marker citrullinated histone H3 (CitH3, red), neutrophil marker CD66b (green), and DNA (DAPI, blue) staining on blood taken after a 40-min run. Original magnification, 40×. Scale bar, 100 μm. (B) Quantification of plasma CitH3 via ELISA after running. Each dot represents one plasma sample. Lines represent the mean and standard deviation. ∗∗p < 0.01, ∗∗∗p < 0.001, two-tailed Mann-Whitney test. (C) CitH3 levels in pairs of samples from the same individual at rest and post-activity. In most pairs, exercise leads to Cit3H signal elevation. (D) Correlation between neutrophil cfDNA and CitH3, at rest and after a half marathon. (E) cfDNA fragment size distribution in plasma samples taken at rest (n = 18) and after a marathon (n = 9). DNA was extracted using a cfDNA isolation kit, as well as a kit for whole-tissue DNA, to avoid exclusion of large or small fragments. Fragment sizes were measured using a TapeStation Agilent 4150 instrument.
Figure 5
Figure 5
Heart rate, β-adrenergic signaling, and muscle activity do not cause cfDNA release from neutrophils (A) Correlation between heart rate and cfDNA levels immediately after sessions of 30 min of cycling at different intensities in four healthy volunteers. Each dot represents one cycling session. (B) Neutrophil cfDNA and heart rate in 10 patients before and after a dobutamine stress test. Activation of β1-adrenergic receptors by dobutamine causes elevation of heart rate (blue) but not neutrophil cfDNA (red). For comparison, heart rate and neutrophil cfDNA are shown for exercising volunteers. (C) Effect of the non-selective beta-blocker propranolol (20 mg, administered 1 h prior to exercise) during a 25-min cycling session (n = 7). Left, heart rate. Right, neutrophil cfDNA levels. Dots and vertical lines represent the mean and standard deviation. ∗p < 0.05; for each time point, Wilcoxon matched-pairs signed-rank test was used. (D) Neutrophil cfDNA in volunteers performing resistance training (weightlifting, 75% 1RM) and endurance training (running, 75% VO2 max) for 40 min. Each dot represents an individual value. ∗p < 0.05, Wilcoxon matched-pairs signed rank test. (E) Neutrophil cfDNA in volunteers before and after a 25-min session of EMS. Wilcoxon matched-pairs signed-rank test.
Figure 6
Figure 6
Reduced oxygen, physical impact, and elevated core body temperature cause cfDNA release from neutrophils (A) Different types of exercise yield different levels of neutrophil cfDNA. Rest, n = 20; half marathon, n = 15; swimming 10 km, n = 19; cycling 32 km, n = 15. Numbers in brackets are the approximate mean duration of physical activity. Dots represent individuals. Vertical lines represent the means. ∗∗∗p < 0.001, ∗∗∗∗p < 0.0001, two-tailed Mann-Whitney test. (B) Neutrophil cfDNA concentration (fold change above resting baseline for each individual) after a 30-min session on either a treadmill or elliptical, under similar heart rates. p = 0.03 for the difference between elliptical and treadmill groups, Wilcoxon matched-pairs signed-rank test. (C) Changes in core body temperature (left), heart rate (middle), and neutrophil cfDNA concentration (right) after a 20- to 25-min session at a dry sauna heated to 80°C. ∗p < 0.05, ∗∗p < 0.01, Wilcoxon matched-pairs signed-rank test. (D) Measurements of lactate, heart rate, capillary saturation, and neutrophil cfDNA during 30 min of cycling at the same load under ambient air or 13.5% oxygen, and 5 min after termination of exercise. Lactate was measured only at 30 min. ∗p < 0.05; for each time point, Wilcoxon matched-pairs signed-rank test was used. Heart rate and cfDNA are shown as fold change over individual baseline. Dots and vertical lines represent the mean and standard deviation.
Figure 7
Figure 7
Personalized predictors of neutrophil cfDNA release in exercise (A) Baseline neutrophil cfDNA levels in trained versus untrained individuals (defined according to post-exercise percentage maximal heart rate, or lactate levels) (n = 39). Individuals cycled for 25 min at 100/90 W for men/women. Maximal heart rate was defined as 220 beats/min (BPM) minus individual age. Individuals that showed a peak heart rate greater than 70% of their maximum or serum lactate levels >4 mM 3 min after exercise were defined as trained. ns, non-significant. ∗∗p < 0.01, two-tailed Mann-Whitney test. (B) Neutrophil cfDNA levels post-standardized 100-W, 25-min cycling session in trained and untrained individuals, defined as in (A). Shown is the fold increase in neutrophil cfDNA in each individual between baseline and the end of the test. (C) A correlation matrix describing strength of correlation (colors) and statistical significance (asterisks) between individual physical parameters and cfDNA measurements, after the standardized 100-W, 25-min effort. ∗p < 0.05, ∗∗p < 0.01, ∗∗∗p < 0.001. (D) Neutrophil cfDNA in exercise relative to rest in three sedentary individuals during 4–12 months of physical training. cfDNA was measured before and after 30 min of cycling at 100 W. Exercise-induced levels of neutrophil cfDNA were significantly reduced at the end of the training period compared with pre-training (p value = 0.026, paired t test).

Similar articles

Cited by

References

    1. Warburton D.E.R., Nicol C.W., Bredin S.S.D. Health benefits of physical activity: the evidence. CMAJ. 2006;174:801–809. doi: 10.1503/cmaj.051351. - DOI - PMC - PubMed
    1. Fischer C.P. Interleukin-6 in acute exercise and training: what is the biological relevance? Exerc. Immunol. Rev. 2006;12:6–33. - PubMed
    1. Goodwin M.L., Harris J.E., Hernández A., Gladden L.B. Blood lactate measurements and analysis during exercise: a guide for clinicians. J. Diabetes Sci. Technol. 2007;1:558–569. doi: 10.1177/193229680700100414. - DOI - PMC - PubMed
    1. Contrepois K., Wu S., Moneghetti K.J., Hornburg D., Ahadi S., Tsai M.-S., Metwally A.A., Wei E., Lee-McMullen B., Quijada J.V., et al. Molecular choreography of acute exercise. Cell. 2020;181:1112–1130.e16. doi: 10.1016/j.cell.2020.04.043. - DOI - PMC - PubMed
    1. Donnellan E., Phelan D. Biomarkers of cardiac stress and injury in athletes: what do they mean? Curr. Heart Fail. Rep. 2018;15:116–122. doi: 10.1007/s11897-018-0385-9. - DOI - PubMed

Publication types