

Burden of disease attributable to unsafe drinking water, sanitation, and hygiene in domestic settings: a global analysis for selected adverse health outcomes
- PMID: 37290458
- PMCID: PMC10290941
- DOI: 10.1016/S0140-6736(23)00458-0
Burden of disease attributable to unsafe drinking water, sanitation, and hygiene in domestic settings: a global analysis for selected adverse health outcomes
Abstract
Background: Assessments of disease burden are important to inform national, regional, and global strategies and to guide investment. We aimed to estimate the drinking water, sanitation, and hygiene (WASH)-attributable burden of disease for diarrhoea, acute respiratory infections, undernutrition, and soil-transmitted helminthiasis, using the WASH service levels used to monitor the UN Sustainable Development Goals (SDGs) as counterfactual minimum risk-exposure levels.
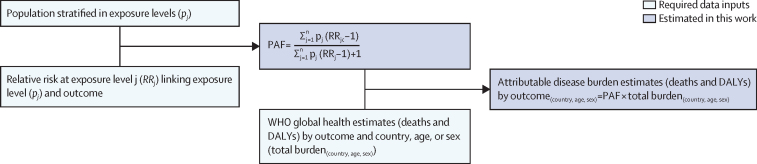
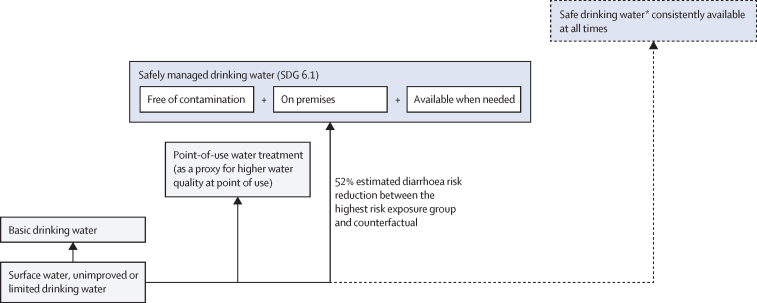
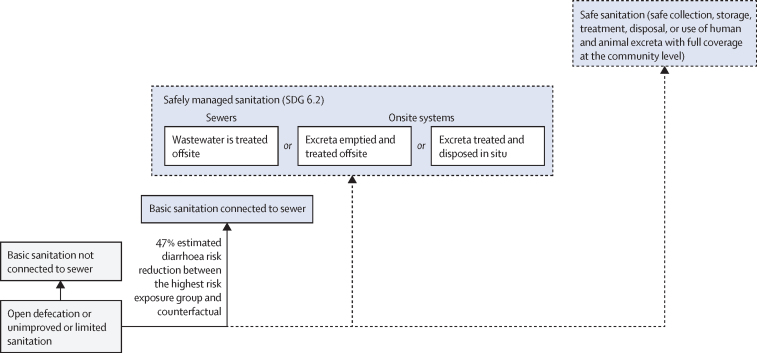
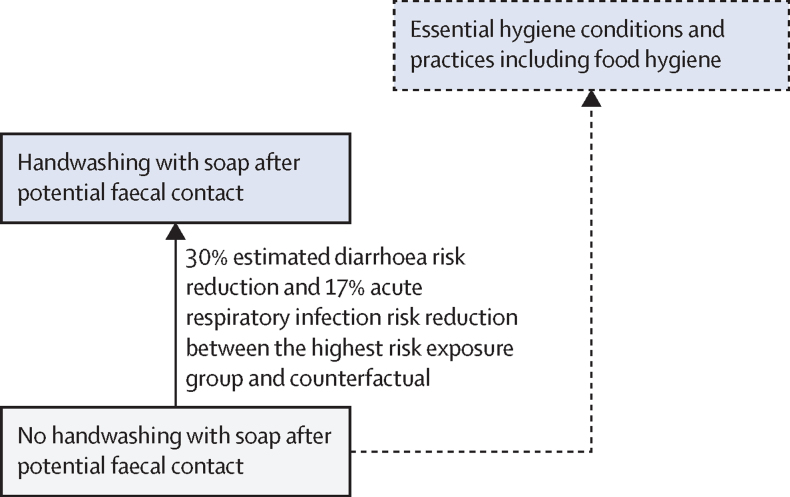
Methods: We assessed the WASH-attributable disease burden of the four health outcomes overall and disaggregated by region, age, and sex for the year 2019. We calculated WASH-attributable fractions of diarrhoea and acute respiratory infections by country using modelled WASH exposures and exposure-response relationships from two updated meta-analyses. We used the WHO and UNICEF Joint Monitoring Programme for Water Supply, Sanitation and Hygiene public database to estimate population exposure to different WASH service levels. WASH-attributable undernutrition was estimated by combining the population attributable fractions (PAF) of diarrhoea caused by unsafe WASH and the PAF of undernutrition caused by diarrhoea. Soil-transmitted helminthiasis was fully attributed to unsafe WASH.
Findings: We estimate that 1·4 (95% CI 1·3-1·5) million deaths and 74 (68-80) million disability-adjusted life-years (DALYs) could have been prevented by safe WASH in 2019 across the four designated outcomes, representing 2·5% of global deaths and 2·9% of global DALYs from all causes. The proportion of diarrhoea that is attributable to unsafe WASH is 0·69 (0·65-0·72), 0·14 (0·13-0·17) for acute respiratory infections, and 0·10 (0·09-0·10) for undernutrition, and we assume that the entire disease burden from soil-transmitted helminthiasis was attributable to unsafe WASH.
Interpretation: WASH-attributable burden of disease estimates based on the levels of service established under the SDG framework show that progress towards the internationally agreed goal of safely managed WASH services for all would yield major public-health returns.
Funding: WHO and Foreign, Commonwealth & Development Office.
Copyright © 2023 World Health Organization. Published by Elsevier Ltd. All rights reserved. This is an Open Access article published under the CC BY 3·0 IGO license which permits unrestricted use, distribution, and reproduction in any medium, provided the original work is properly cited. In any use of this article, there should be no suggestion that WHO endorses any specific organisation, products or services. The use of the WHO logo is not permitted. This notice should be preserved along with the article's original URL.
Conflict of interest statement
Declaration of interests JW reports grants from UK Foreign, Commonwealth & Development Office (FCDO), during this study. MB reports grants from Bill & Melinda Gates Foundation during this study. CFL reports non-financial support from WHO COVID-19 Vaccine Effectiveness Working Group, grants from CureVac AG, grants from PATH, grants from HilleVax, and personal fees from Valneva outside the submitted work. JB reports grants from Bill & Melinda Gates Foundation, grants from US Centers for Disease Control & Prevention, and grants from Columbia World Projects during this study. MCF reports Consulting for Rickett's Global Scientific Advisory Committee. RBJ reports grants from UK FCDO during this study, grants from Agence française de développement, grants from Australian Government Department of Foreign Affairs and Trade, grants from Austrian Development Agency, grants from Bill & Melinda Gates Foundation, grants from German Federal Ministry for Economic Development and Cooperation, grants from The Netherlands Directorate-General for International Cooperation, grants from Swiss Agency for Development and Cooperation, and grants from United States Agency for International Development outside the submitted work. All other authors declare no competing interests.
Figures
References
-
- WHO. UNICEF Progress on household drinking water, sanitation and hygiene 2000–2020: five years into the SDGs. 2021. https://washdata.org/report/jmp-2021-wash-households
