. 2023 Jun 8;14(1):3346.
doi: 10.1038/s41467-023-39027-x.

SERCA2 phosphorylation at serine 663 is a key regulator of Ca2+ homeostasis in heart diseases

Affiliations

SERCA2 phosphorylation at serine 663 is a key regulator of Ca2+ homeostasis in heart diseases

Fabrice Gonnot et al. Nat Commun. .

Abstract

Despite advances in cardioprotection, new therapeutic strategies capable of preventing ischemia-reperfusion injury of patients are still needed. Here, we discover that sarcoplasmic/endoplasmic reticulum Ca2+ ATPase (SERCA2) phosphorylation at serine 663 is a clinical and pathophysiological event of cardiac function. Indeed, the phosphorylation level of SERCA2 at serine 663 is increased in ischemic hearts of patients and mouse. Analyses on different human cell lines indicate that preventing serine 663 phosphorylation significantly increases SERCA2 activity and protects against cell death, by counteracting cytosolic and mitochondrial Ca2+ overload. By identifying the phosphorylation level of SERCA2 at serine 663 as an essential regulator of SERCA2 activity, Ca2+ homeostasis and infarct size, these data contribute to a more comprehensive understanding of the excitation/contraction coupling of cardiomyocytes and establish the pathophysiological role and the therapeutic potential of SERCA2 modulation in acute myocardial infarction, based on the hotspot phosphorylation level of SERCA2 at serine 663 residue.


Conflict of interest statement

The authors declare no competing interests.

Figures

Fig. 1
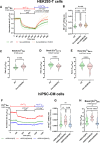
Fig. 1. GSK3β-dependent phosphorylation of SERCA2 at serine 663 in human and mouse hearts.
A Representative curves of normalized [Ca2+]ER ratio signals over time measured with the genetically encoded Ca2+ probe D1ER in HEK293-T cells in Ca2+ free and 1 mM EGTA-containing buffer for three minutes before depleting the ER Ca2+ store by adding 100 µM cyclopiazonic acid (CPA) and 500 µM ATP-Na2+ for seven minutes and prior to ER Ca2+ refilling by switching for six minutes and a half to 2 mM Ca2+, 500 µM ATP-Mg2+ and 1 µM ionomycin-containing buffer (green curve), or supplemented with 10 µM TDZD8 (orange curve), or 1 µM thapsigargin (gray curve) to compare SERCA activity. Ratio signals were normalized as following: [1+ (RRt=600s)/(Rt=180s.Rt=600s)]. B Violin plot of ER Ca2+ refilling slope over two minutes from time 630 s of control (n = 199, on 11 experimental days), TDZD8 (n = 210, on 7 experimental days), thapsigargin (n = 42, on 2 experimental days) and 1 µM SB216763 (N = 212 cells, on 6 experimental days). Median with a 95% confidence interval is shown and one-way ANOVA followed by Tukey’s multiple comparisons test was used to assess significance versus Control condition (****p < 0.0001). C Motif of the GSK3β substrate sequence (from PhosphoSitePlus database). D Listing of in silico analysis of putative GSK3β target sites on SERCA2 determined by NetPhos3.1 and PhosphoSitePlus public databases. E Mass spectrometry analysis of SERCA2 phosphorylation at serine 663 residue (Sp663) in left ventricle of C57BL/6 mice in basal (Control; n = 10) and after 60 min ischemia followed by 30 minutes reoxygenation (IR; n = 10). Median with interquartile range is shown and two-tailed Mann–Whitney test was used to assess significance (*p = 0.027). F Mass spectrometry analysis of SERCA2 phosphorylation at serine 663 in healthy patients (Non-failing; n = 5) and patient with end-stage heart failure (Failing; n = 5 regions). Median with interquartile range is shown and two-tailed Mann–Whitney test was used to assess significance (*p = 0.0159). G 3D structure of SERCA2, with α-helix and β-sheet in different SERCA2 domains. Visualization of the accessibility of the cytosolic phosphorylation site at serine 663 (SER663, yellow) at the periphery of the phosphorylation domain of SERCA2 (brown). Figure adapted from. H Interaction of GSK3β with SERCA2 determined by co-immunoprecipitation on lysates from HEK293-T cells (basal (n = 3) and after 1 h hypoxia followed by 30 min reoxygenation (n = 3)). GAPDH was used as a negative control. I Representative images of FRET between SERCA2-mTurquoise2 donor and GSK3β-sYFP2 acceptor, on living HEK293-T cells, in normoxic condition or after 60 min hypoxia followed by 30 minutes reoxygenation (H/R). Scale bar represents 10μm (left). Dot plot of the FRET efficiency in normoxia (n = 15) and after H/R (n = 24, ***p = 0.0009), on four independent experiments (right). Median with interquartile range is shown and two-tailed Mann–Whitney test was used to assess significance. J Representative confocal microscopy images of the in situ SERCA2-GSK3β proximity depicted as red dots on adult cardiomyocytes, in normoxic or after 45 minutes hypoxia followed by 120 min reoxygenation (H/R). Nuclei appear in blue (top). Quantification of the interactions per cell of normoxia (N = 16) and H/R (N = 32) groups, presented as a fold of Normoxia, on three independent experiments. Scale bar represents 10 μm (bottom). Median with interquartile range is shown and two-tailed Mann–Whitney test was used to assess significance (****p < 0.0001).
Fig. 2
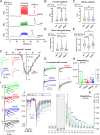
Fig. 2. Phosphorylation of SERCA2 at serine 663 regulates SERCA2 activity.
A Representative curves of normalized [Ca2+]ER ratio signals over time measured with the genetically encoded Ca2+ probe D1ER in HEK293-T wild-type (green curve), Serca2[S663A] phosphoresistant mutant (red curve) and Serca2[S663A] phosphoresistant mutant supplemented with 10 µM TDZD8 for ER Ca2+ refilling (dashed orange curve). Ratio signals were normalized as following: [1 + (RRt=600s)/(Rt=180sec.Rt=600s)]. B Violin plot of the ER Ca2+ refilling slope over two minutes from time 630 s of WT (N = 108 cells on 4 experimental days), Serca2[S663A] (N = 108 cells on 9 experimental days) and Serca2[S663A] + TDZD8 (N = 100 cells on 4 experimental days) respectively. Median with a 95% confidence interval is shown and one-way ANOVA followed by Tukey’s multiple comparisons test was used to assess significance (****p < 0.0001) (ns p = 0.3953, ****p < 0.0001). C Violin plot of basal [Ca2+]ER (endoplasmic reticulum) ratio measured with D1ER probe in HEK293-T wild-type (WT) (N = 117) and Serca2[S663A] phosphoresistant mutant cells (N = 108). Median with distribution is shown and two-tailed unpaired t test with Welch’s correction was used to assess significance (****p < 0.0001). D Violin plot of basal [Ca2+]CYTO (cytosol) ratio measured with D3cpV probe in HEK293-T wild-type (WT) (N = 214) and Serca2[S663A] phosphoresistant mutant cells (N = 124). Median with distribution is shown and two-tailed unpaired t test with Welch’s correction was used to assess significance (****p < 0.0001). E Violin plot of basal [Ca2+]MITO (mitochondria) ratio measured with 4mtD3cpV probe, in HEK293-T wild-type (WT) (N = 219) and Serca2[S663A] phosphoresistant mutant cells (N = 197). Median with distribution is shown and two-tailed unpaired t test with Welch’s correction was used to assess significance (****p < 0.0001). F Representative curves of normalized [Ca2+]ER ratio signals over time measured with the genetically encoded Ca2+ probe D4ER in human induced pluripotent stem-cell-derived cardiomyocytes (hiPSC-CM) infected (6 days, MOI 100 000) with the AAV9-Serca[WT], wild-type (green curve), the AAV9-Serca2[S663A] phosphoresistant mutant (red curve) and the AAV9-Serca2[S663E] phosphomimetic mutant (blue curve). G Violin plot of ER Ca2+ refilling slope over four minutes from time 1119 s in AAV9-Serca[WT] (N = 44 cells on 4 experimental days), AAV9-Serca2[S663A] (N = 19 cells on 4 experimental days) and AAV9-Serca2[S663E] (N = 35 cells on 4 experimental days) infected hiPSC-CM cells. Median with a 95% confidence interval is shown and one-way ANOVA followed by Tukey’s multiple comparisons test was used to assess significance (ns p = 0.2212, *p = 0.0296, ***p = 0.0007). H Violin plot of basal [Ca2+]ER (endoplasmic reticulum) ratio signal measured with D4ER probe (6 days, MOI 100 000) in hiPSC-CM infected with AAV9-Serca2[WT] (N = 57 on 4 experimental days), -Serca2[S663A] (N = 19 on 4 experimental days)or -Serca2[S663E] (N = 64 on 4 experimental days). Median with a 95% confidence interval is shown and one-way ANOVA followed by Tukey’s multiple comparisons test was used to assess significance (*p = 0.0115, ****p < 0.0001).
Fig. 3
Fig. 3. Phosphoresistance of SERCA2 at S663 confers in vitro protection against H/R injury.
A Cell death evaluated by flow cytometry with propidium iodide (PI) in normoxic and hypoxic WT (N = 11) and Serca2[S663A] (N = 12) groups. Cyclosporin A (CsA) (N = 11) was used as a positive control. Median with a 95% confidence interval from 4 independent days is shown and two-way ANOVA followed by Tukey’s multiple comparisons test versus WT condition was used to assess significance (ns p ≥ 0.05, *p = 0.0119, ***p = 0.004. B Kinetic curves of [Ca2+]ER (endoplasmic reticulum) ratio measured with D1ER probe at 0.5 h/1 h/2 h reoxygenation of HEK293-T wild-type (WT) (dotted green curve, N = 103/86/89 for respective reperfusion time, on 4 experimental days) and Serca2[S663A] phosphoresistant mutant (continuous red curve, N = 90/95/95 for respective reperfusion time, on 4 experimental days) cells exposed to 18 h hypoxia (1%). Mean with a 95% confidence interval is shown and two-tailed unpaired t test with Welch’s correction was used to assess significance (****p < 0.0001). C Kinetic curves of [Ca2+]CYTO (cytosol) ratio measured with D3cpV probe at 0.5 h/1 h/2 h reoxygenation of HEK293-T wild-type (WT) (dotted green curve, N = 71/44/36 for respective reperfusion time, on 4 experimental days) and Serca2[S663A] phosphoresistant mutant (continuous red curve, N = 64/73/72 for respective reperfusion time, on 4 experimental days) cells exposed to 18 h hypoxia (1%). Mean with a 95% confidence interval is shown and two-tailed unpaired t test with Welch’s correction was used to assess significance (****p < 0.0001). D Kinetic curves of [Ca2+]MITO (mitochondria) ratio measured with 4mtD3cpV probe at 0.5 h/1 h/2 h reoxygenation of HEK293-T wild-type (WT) (dotted green curve, N = 73/55/47 for respective reperfusion time, on 4 experimental days) and Serca2[S663A] phosphoresistant mutant (continuous red curve, N = 72/70/97 for respective reperfusion time, on 4 experimental days) cells exposed to 18 h hypoxia (1%). Mean with a 95% confidence interval is shown and two-tailed unpaired t test with Welch’s correction was used to assess significance (***p = 0.009, ****p < 0.0001). E Cell death evaluated by flow cytometry with propidium iodide (PI) in hypoxic MEF-T Serca2 KO cell line, rescued with Serca2 wild-type (rWT), [S663A] phosphoresistant mutant (rS663A) and [S663E] phosphomimetic mutant (rS663E). Mean with a 95% confidence interval from n = 9 experiments on 3 independent days is shown and two-way ANOVA followed by Tukey’s multiple comparisons test versus rWT condition was used to assess significance (ns p = 0.8029, ****p < 0.0001). F Representative curves of normalized [Ca2+]CYTO (cytosol) ratio signals over time measured with D3cpV probe in Serca2 null MEF-T cells and rescued with Serca2 wild-type (rWT; green curve), [S663A] phosphoresistant mutant (rS663A; red curve) or [S663E] phosphomimetic mutant (rS663E; blue curve) cells in Ca2+ free and 1 mM EGTA-containing buffer for one minutes prior to add 100 µM ATP-Na2+. G Violin plots of normalized [Ca2+] maximal increase after ATP-Na2+ stimulation of rWT (N = 22 cells on 3 independent days), rS663A (N = 23 cells on 3 independent days) and rS663E (N = 18 cells on 3 independent days). Median with a 95% confidence interval is shown and one-way ANOVA followed by Tukey’s multiple comparisons test was used to assess significance (****p < 0.0001). H Cell death evaluated by flow cytometry with propidium iodide (PI) after H/R in hiPSC-CM cells infected with SERCA2 wild-type [WT] (N = 7) or phosphoresistant [S663A] mutant (N = 7). Median with interquartile range, from n = 7 independent experiments, is shown and two-tailed paired Wilcoxon test was used to assess significance (*p = 0.0313).
Fig. 4
Fig. 4. S663A phosphorylation modulates Ca2+ signaling and function in mouse cardiomyocytes.
A Typical curves of [Ca2+]CYTO (cytosol) F/F0 ratio signals over time measured with Fluo-4, in rWT (green curve), rS663A (red curve) and rS663E (blue curve) rescued cardiomyocytes, in 2 mM Ca2+ electro-stimulation buffer for 30 s, followed by 20 s electro-stimulation at 1.0 Hz and 40 V, and prior to 5 mM caffeine stimulation at time 60 s. B Violin plots of the transient amplitude during electro-stimulation in rWT (N = 184 cells on 5 experimental days), rS663A (N = 253 cells on 5 experimental days) and rS663E (N = 260 cells on 6 experimental days). Median with interquartile range is shown and one-way ANOVA followed by Tukey’s multiple comparisons test was used to assess significance (ns p = 0.0666, **p = 0.0014, ****p < 0.0001). C Violin plots of the [Ca2+] maximal increase in rWT (N = 214 on 5 experimental days), rS663A (N = 164 cells on 5 experimental days) and rS663E (N = 257 cells on 6 experimental days). Median with interquartile range is shown and one-way ANOVA followed by Tukey’s multiple comparisons test was used to assess significance (ns p = 0.9759, *p = 0.0241, **p = 0.0063). D Violin plots of the rate of exponential decay after caffeine stimulation in rWT (N = 94 cells on 5 experimental days), rS663A (N = 118 cells on 5 experimental days) and rS663E (N = 145 cells on 6 experimental days). Median with interquartile range is shown and one-way ANOVA followed by Tukey’s multiple comparisons test was used to assess significance (ns p = 0.0666, **p = 0.0014, ****p < 0.0001). E Violin plot of basal [Ca2+]CYTO (cytosol) ratio signals measured with the ratiometric chemical Ca2+ indicator Fura-2, in rWT (N = 111 cells on 3 independent days), S663A (N = 66 cells on 3 independent days) and rS663E (N = 69 cells on 3 independent days). Median with interquartile range is shown and one-way ANOVA followed by Tukey’s multiple comparisons test was used to assess significance (ns p = 9012, ****p < 0.0001). F Current–voltage relationships of peak ICa,L normalized to membrane capacitance from rWT (green curve; N = 16), rS663A (red curve; N = 15), rS663E (blue curve; N = 15) and non-transgenic control (Ctr; gray curve; N = 17) cells isolated from 3 mice in each group. Data are expressed as mean ± CI 95%. Inserted on the left, representative traces of L-type Ca2+ current in rWT, rS663A, rS663E and Ctr cardiomyocytes during depolarizing steps spaced 10 mV apart and varying between 0 and +40 mV (uppermost traces) from a holding potential of −80 mV. G Average traces (±CI 95%) of INCX measured as the Li+-sensitive slow tail inward current recorded every 10 s when polarizing the cell to −80 mV after it has been depolarized 20 ms to −50 mV (to inactivate the fast sodium current), and then 30 ms to +10 mV (to activate ICa,L), from rWT (N = 24), rS663A (N = 24), rS663E (N = 23) and Ctr (C57Bl6J mice N = 27) cells isolated from 6, 7, 5 and 6 mice, respectively. Box (with median and interquartile range) and whiskers (10-90%) showing INCX densities measured after 20 ms of repolarization to −80 mV have been added on every trace. (***p < 0.001 vs Ctr). H Panel G corresponding boxes (with median and interquartile range) and whiskers (10–90%) with dot plots showing INCX densities measured as the integrated form of inward currents (135 ms integration starting 15 ms after the onset of repolarization). Expressed as mean ± CI 95%, membrane capacitances in pF were: rWT: 141.1 ± 11.9, N = 40; rS663A: 157.9 ± 14.7, N = 39; rS663E: 158.5 ± 15.3, N = 38, Ctr: 156.5 ± 13.6, N = 44. ***p <  0.001 indicates on G and H statistically significant differences compared to Ctr using the Kruskal–Wallis test followed by Dunn’s multiple comparisons test. I Representative records of inward tail current normalized to membrane capacitance recorded at −80 mV from rWT, rS663A, rS663E and Ctr cardiomyocytes in Na+ (P3) and Li+ (P5) external solution and after return in the Na+ external solution (P7, P9 and P11). J Time course of inward tail current densities measured 20 ms after the onset of the repolarization to −80 mV from rWT (N = 19), rS663A (N = 18), rS663E (N = 20) and Ctr (N = 21) cells isolated from same mice as in (F) and (G). First placed in external Na+ (P1–P3), the cells were then exposed to external Li+ (P4–P6), before being returned to external Na+ (from P7 to P16), Data are presented as median with interquartile range. The Kruskal–Wallis test followed by Dunn’s multiple comparisons test was used, and only differences with Ctr were reported as significant. a, p < 0.01 at least for the 3 mutants versus Ctr, b, p < 0.05 at least for the 3 mutants versus Ctr, and c, p < 0.05 only for the rS663A mutant versus Ctr. K Panel J corresponding integrated NCX density currents from rWT, rS663A and rS663E mutant cardiomyocytes displayed in Na+ (P1–P3) and Li+ (P4–P6) external solution and after return in the Na+ external solution (from P7 to P16). Data are presented as box (median with interquartile range) and whiskers (10–90%). The Kruskal–Wallis test followed by Dunn’s multiple comparisons test was used and only differences with rS663A were reported as significant (P1: p = 0,0702, P2: p = 0,1466, P3: p = 0,0573, P4: p = 0,0964, P5: p = 0,4200, P6: p = 0,1806, P7: p = 0,0401, P8: p = 0,0113, P9: p = 0,0054, P10: p = 0,0007, P11: p = 0,0039, P12: p = 0,0033, P13: p = 0,0175, P14: p = 0,0318, P15: p = 0,2819 and P16: p = 0,1083, vs rS663A). Dash lines on F, G and I indicate zero current.
Fig. 5
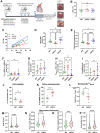
Fig. 5. Phosphorylation state of SERCA2 at S663 regulates in vivo myocardial infarct size.
A Experimental design for in vivo gene therapy experiments with heart transverse section after TTC staining. Scale bar represents 500 μm. B Quantification of the area at risk (AR) expressed as percentage of left ventricle (LV) of SERCA2-KD mice rescued with SERCA2 -WT (N = 13), -S663A (N = 11) or -S663E (N = 14). Mean with a 95% confidence interval is shown and one-way ANOVA followed by Tukey’s multiple comparisons test was used to assess significance (ns p ≥ 0.05). C Scatterplot of AN over the AR of mice rescued with SERCA2 -WT (N = 13), -S663A (N = 11) or -S663E (N = 14). D Quantification of infarct size (AN) expressed as percentage of AR of mice rescued with SERCA2 -WT (N = 13), -S663A (N = 11) or -S663E (N = 14). Mean with a 95% confidence interval is shown and one-way ANOVA followed by Tukey’s multiple comparisons test was used to assess significance (*p = 0.0292 rWT vs rS663A, *p = 0.0144 rWT vs rS663E, ****p < 0.0001). E Dot plot of fitted linear regression slope of AN/AR of rWT (N = 13), rS663A (N = 11) or rS663E (N = 14) SERCA2 rescued mice. Mean with a 95% confidence interval is shown and one-way ANOVA followed by Tukey’s multiple comparisons test was used to assess significance (*p = 0.0272 rWT vs rS663A, *p = 0.0136 rWT vs rS663E, ****p < 0.0001). FI Evaluation of cardioprotective signaling pathways in lysates of cardiac area at risks. F Quantification of western blotting for Phospho-ERK over total ERK1-2 in rWT (N = 11), rS663A (N = 11) and rS663E (N = 11) SERCA2 rescued mice. Mean with a 95% confidence interval, from n = 3 independent experiments, is shown and one-way ANOVA followed by Tukey’s multiple comparisons test was used to assess significance (ns p > 0.05). G Quantification of western blotting for phospho-STAT3 over total STAT3 in rWT (N = 8), rS663A (N = 8) and rS663E (N = 8) SERCA2 rescued mice. Mean with a 95% confidence interval, from n = 3 independent experiments, is shown and one-way ANOVA followed by Tukey’s multiple comparisons test was used to assess significance (ns p > 0.05) H Quantification of western blotting for phospho S16-T17-PLN over total PLN, expressed as fold of rWT. Mean with a 95% confidence interval, from n = 3 independent experiments, is shown and one-way ANOVA followed by Tukey’s multiple comparisons test was used to assess significance (ns p = 0.8195, *p = 0.0102 rS663A vs rS663E, *p = 0.0424 rWT vs rS663E). I Quantification of the interaction of PLN with SERCA2 determined by co-immunoprecipitation on lysates from cardiac area at risks in rWT (N = 6), rS663A (N = 6) and rS663E (N = 6) SERCA2 rescued mice. Mean with a 95% confidence interval, from n = 3 independent experiments, is shown and one-way ANOVA followed by Tukey’s multiple comparisons test was used to assess significance (ns p > 0.05). JL Evaluation of the functions of the mouse cardiomyocytes isolated from the AR after the in vivo ischemia-reperfusion insult. J Cell death evaluated by flow cytometry with propidium iodide (PI) in rWT (N = 7) and rS663A (N = 7) SERCA2 rescued mice. Median with interquartile interval is shown and two-tailed unpaired t test with Welch’s correction was used to assess significance (*p = 0.0104). K Mitochondrial membrane potential evaluated with TMRM in rWT (N = 7) and rS663A (N = 8) SERCA2 rescued mice. Median with interquartile interval is shown and two-tailed unpaired t test with Welch’s correction was used to assess significance (***p = 0.0002). L Resting cytosol Ca2+ evaluated with the ratiometric FuraRed sensor in rWT (N = 6) and rS663A (N = 8) SERCA2 rescued mice. Median with interquartile interval is shown and two-tailed unpaired t test with Welch’s correction was used to assess significance (*p = 0.0105). MP Quantification of sarcomere shortening in mouse cardiomyocytes isolated from the AR after the in vivo ischemia-reperfusion insult measured with the software IonWizard; Ionoptix system. M Evaluation of peak h in µm in rWT (N = 135) and rS663A (N = 245) SERCA2 rescued cardiomyocytes. Median with interquartile interval is shown and two-tailed unpaired t test with Welch’s correction was used to assess significance (****p < 0.0001). N Evaluation of time to peak 50% in rWT (N = 135) and rS663A (N = 245) SERCA2 rescued cardiomyocytes. Median with interquartile interval is shown and two-tailed unpaired t test with Welch’s correction was used to assess significance (****p < 0.0001). O Evaluation of time to baseline 50% in rWT (N = 133) and rS663A (N = 244) SERCA2 rescued cardiomyocytes. Median with interquartile interval is shown and two-tailed unpaired t test with Welch’s correction was used to assess significance (***p = 0.0003). P Evaluation of area under curve in rWT (N = 135) and rS663A (N = 242) SERCA2 rescued cardiomyocytes. Median with interquartile interval is shown and two-tailed unpaired t test with Welch’s correction was used to assess significance (****p < 0.0001).
Fig. 6
Fig. 6. Mechanistic role of SERCA2 phosphorylation at S663 in ischemic and healthy/protected hearts.
In healthy heart, during excitation-contraction coupling (ECC) induced after depolarization of the sarcolemma, a small amount of Ca2+ enters to the sarcoplasm through the voltage sensitive L-type calcium dihydropyridine channels (LTCC) of the T-tubule, targeting a rapid and large amount of Ca2+ release (systolic Ca2+) from inside the sarcoplasmic reticulum (SR/ER) through the Ca2+ ryanodine channels (RyR), which subsequently activates myofilaments (MF) for muscle contraction. Relaxation occurs when SR Ca2+ ATPase (SERCA2) reuptakes Ca2+, which is regulated by the balance of the phosphorylation level of SERCA2 at serine 663 (S663) via the GSK3β, lowering cytosolic Ca2+ concentration in combination with Ca2+ extrusion via Na+–Ca2+ exchanger (NCX) working in reverse mode. Mitochondria (Mito) also participate taking and extruding Ca2+ from the cytosol during Ca2+ cycle. During ischemic heart disease, the level of SERCA2 phosphorylation at S663 is increased, reducing the reuptake of Ca2+ into SR/ER during the relaxation phase, which contributes to the increase of both intracellular (Ca2+ i) and mitochondrial Ca2+ (Ca2+m) overload, driving cells towards death. Conversely, preventing SERCA2 phosphorylation at reperfusion, enhances the Ca2+ reuptake into SR/ER, increasing the SR/ER Ca2+ content, which subsequently (1) reduces the intracellular and mitochondrial Ca2+ content, and (2) improves excitation-contraction coupling of cardiomyocytes, contributing to the protection and recovery of ischemic heart.

Similar articles

Cited by

References

    1. Virani SS, et al. American Heart Association Council on E, Prevention Statistics C and Stroke Statistics S. Heart disease and stroke statistics-2021 update: a report from the American Heart Association. Circulation. 2021;143:e254–e743. doi: 10.1161/CIR.0000000000000950. - DOI - PubMed
    1. Gross GJ, Kersten JR, Warltier DC. Mechanisms of postischemic contractile dysfunction. Ann. Thorac. Surg. 1999;68:1898–1904. doi: 10.1016/S0003-4975(99)01035-8. - DOI - PubMed
    1. Verma S, et al. Fundamentals of reperfusion injury for the clinical cardiologist. Circulation. 2002;105:2332–2336. doi: 10.1161/01.CIR.0000016602.96363.36. - DOI - PubMed
    1. Woo KS, White HD. Factors affecting outcome after recovery from myocardial infarction. Annu. Rev. Med. 1994;45:325–339. doi: 10.1146/annurev.med.45.1.325. - DOI - PubMed
    1. Grech ED. ABC of interventional cardiology: percutaneous coronary intervention. I: history and development. Bmj. 2003;326:1080–1082. doi: 10.1136/bmj.326.7398.1080. - DOI - PMC - PubMed

Publication types

Substances