. 2023 Jun 8;14(1):3345.
doi: 10.1038/s41467-023-38582-7.

Functional gene delivery to and across brain vasculature of systemic AAVs with endothelial-specific tropism in rodents and broad tropism in primates

Affiliations

Functional gene delivery to and across brain vasculature of systemic AAVs with endothelial-specific tropism in rodents and broad tropism in primates

Xinhong Chen et al. Nat Commun. .

Abstract

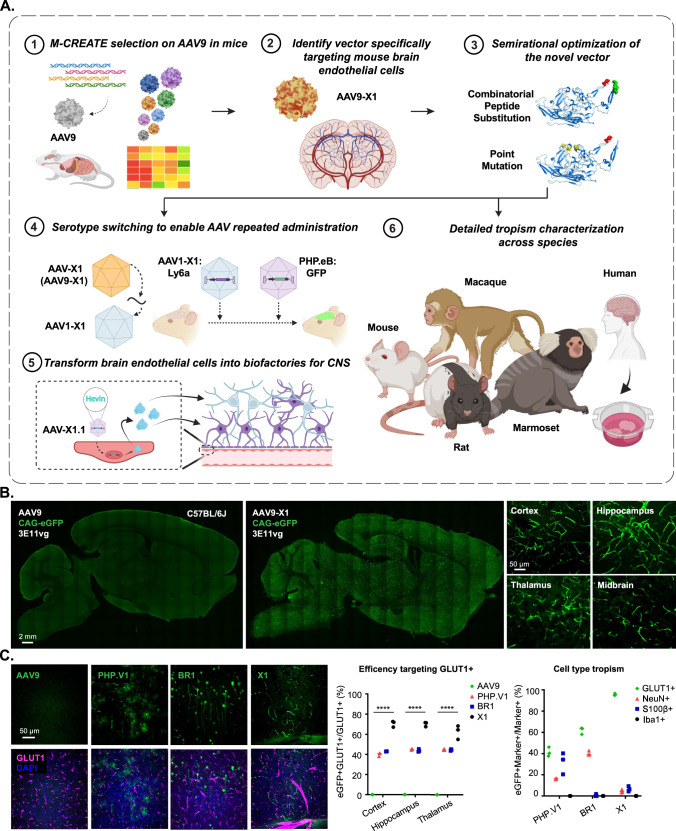
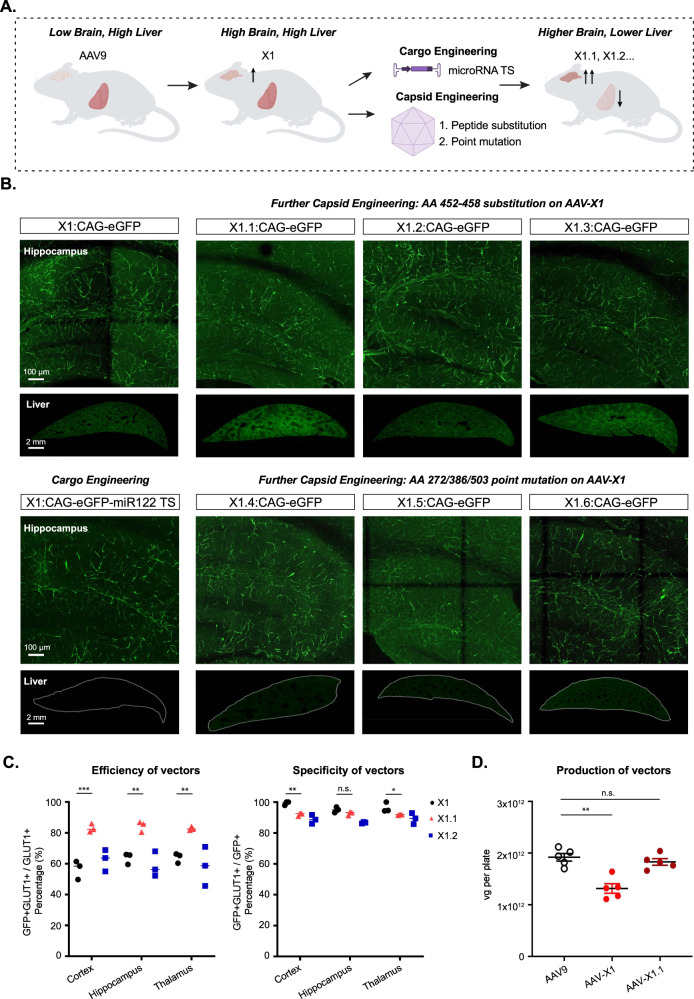
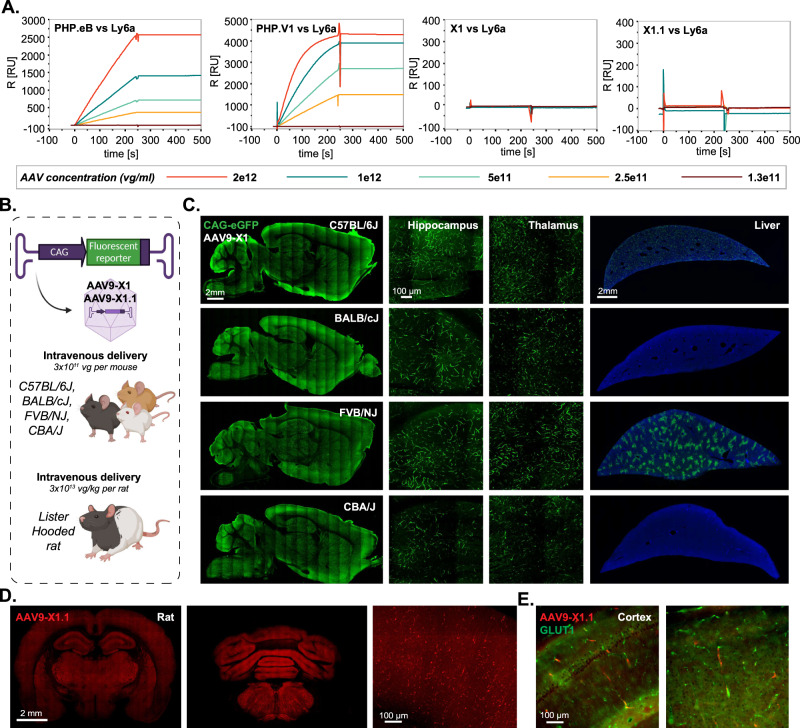
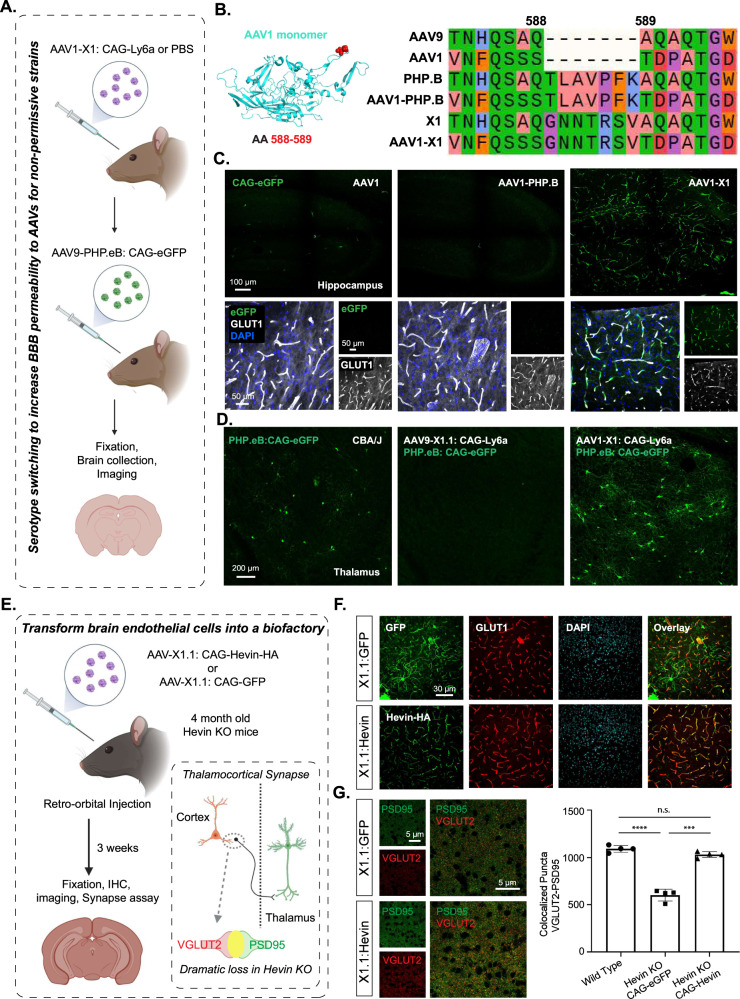
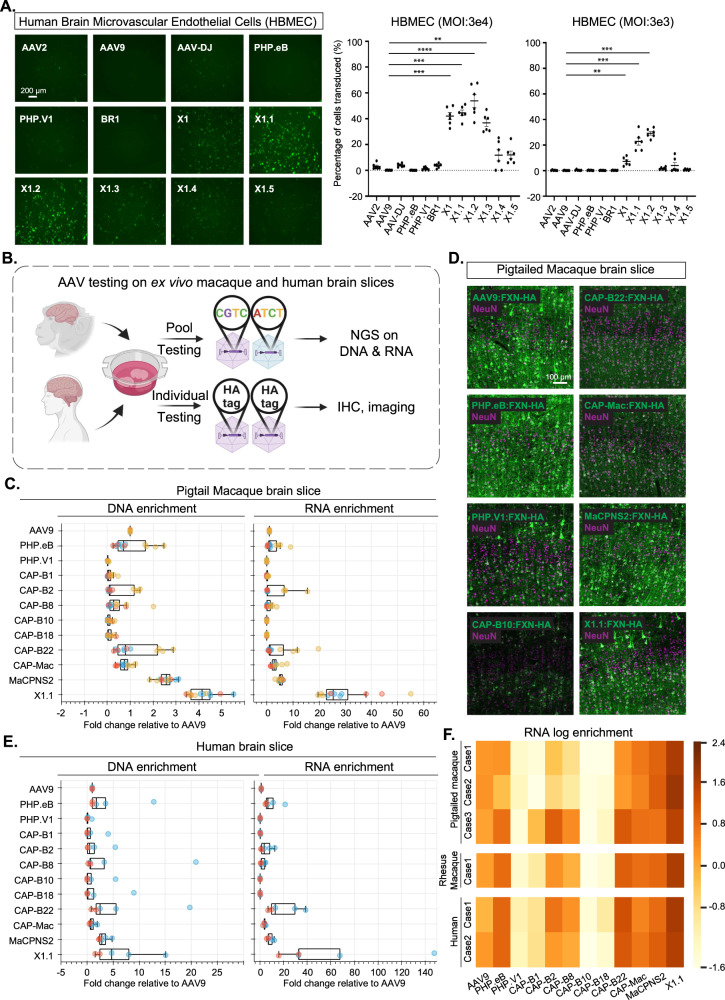
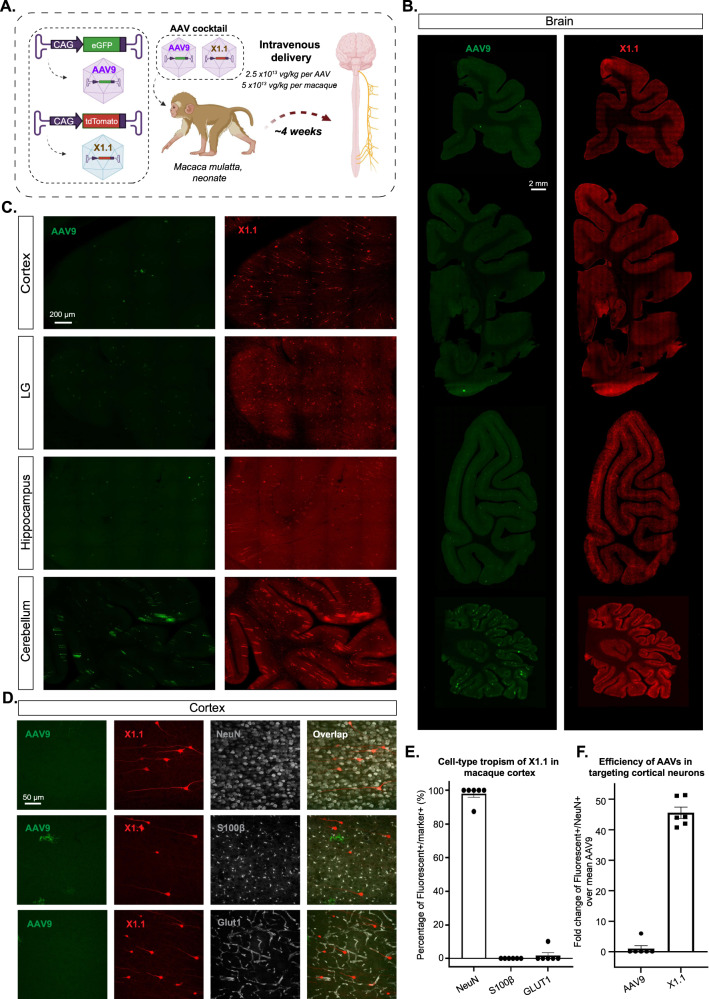
Delivering genes to and across the brain vasculature efficiently and specifically across species remains a critical challenge for addressing neurological diseases. We have evolved adeno-associated virus (AAV9) capsids into vectors that transduce brain endothelial cells specifically and efficiently following systemic administration in wild-type mice with diverse genetic backgrounds, and in rats. These AAVs also exhibit superior transduction of the CNS across non-human primates (marmosets and rhesus macaques), and in ex vivo human brain slices, although the endothelial tropism is not conserved across species. The capsid modifications translate from AAV9 to other serotypes such as AAV1 and AAV-DJ, enabling serotype switching for sequential AAV administration in mice. We demonstrate that the endothelial-specific mouse capsids can be used to genetically engineer the blood-brain barrier by transforming the mouse brain vasculature into a functional biofactory. We apply this approach to Hevin knockout mice, where AAV-X1-mediated ectopic expression of the synaptogenic protein Sparcl1/Hevin in brain endothelial cells rescued synaptic deficits.


Conflict of interest statement

The California Institute of Technology has one patent pending for the sequences described in this manuscript, with X.C. and V.G. listed as inventors (PCT Patent Application No: PCT/US2022/027516). V.G. is a co-founder and board member of Capsida Biotherapeutics, a fully integrated AAV engineering and gene therapy company. The remaining authors declare no competing interests.

Figures

Fig. 1
Fig. 1. Engineered AAVs can specifically target the brain endothelial cells in mouse following systemic delivery.
A An overview of the engineering and characterization of the novel capsids. (1): Evolution of AAV9 using Multiplexed-CREATE and (2): identification of a novel vector, AAV-X1, that transduces brain endothelial cells specifically and efficiently following systemic administration in mice. (3): Combinatorial peptide substitution and point mutation to further refine the novel vector’s tropism, yielding improved vectors. (4): Transferring the X1 peptide to the AAV1 backbone to enable serotype switching for sequential AAV administration. (5): Utilizing AAV-X1 to transform the brain endothelial cells into a biofactory, producing Hevin for the CNS. (6): Validation of the novel AAVs across rodent models (genetically diverse mice strains and rats), NHPs (marmosets and macaques), and ex vivo human brain slices. Created with BioRender.com. B (Left) Representative images of AAV (AAV9, AAV-X1) vector-mediated expression of eGFP (green) in the brain (scale bar: 2 mm). (Right) Zoomed-in images of AAV-X1-mediated expression of eGFP (green) across brain regions, including the cortex, hippocampus, thalamus, and midbrain (scale bar: 50 µm). (C57BL/6J, n = 3 per group, 3E11 vg IV dose per mouse, 3 weeks of expression). C (Left) Representative images of AAV (AAV9, PHP.V1, BR1, and AAV-X1) vector-mediated expression of eGFP (green) in the cortex. Tissues were co-stained with GLUT1 (magenta) (scale bar: 50 µm). (Middle) Percentage of AAV-mediated eGFP-expressing cells that overlap with the GLUT1+ marker across brain regions, representing the efficiency of the vectors’ targeting of GLUT1+ cells. A two-way ANOVA and Tukey’s multiple comparisons tests with adjusted P values are reported (****P < 0.0001. P = 1.8e-15 for AAV9 versus X1.1 in the cortex. P = 1.8e-15 for AAV9 versus X1.1 in the hippocampus. P = 1.8e-15 for AAV9 versus X1.1 in the thalamus). Each data point shows the mean of three slices per mouse. (Right) Percentage of GLUT1+, NeuN+, S100β+ and Iba1+ markers in AAV-mediated eGFP-expressing cells across brain regions, representing the specificity of the vectors’ targeting of GLUT1+ cells. (C57BL/6J, n = 3 per group, 3E11 vg IV dose per mouse, 3 weeks of expression). Source data are provided as a Source Data file.
Fig. 2
Fig. 2. Semi-rational refinement of X1’s tropism by further cargo and capsid engineering.
A Illustration demonstrating cargo and capsid engineering to refine X1’s tropism to increase brain targeting and lower liver targeting. Created with BioRender.com. B Representative images of vector-mediated expression of eGFP (green) in hippocampus and liver. Images are matched in fluorescence intensity to the X1: CAG-eGFP image. Brain scale bar: 100 µm. Liver scale bar: 2 mm. (n = 4 per group, 8-week-old C57BL/6J males, 3 × 1011 vg IV dose per mouse, 3 weeks of expression). (Top left) X1-mediated expression of CAG-eGFP. (Bottom left) X1-mediated eGFP expression with cargo engineering by incorporating MicroRNA-122 target sites (miR122TSS) in the CAG-eGFP genome. (Top right) Further capsid engineering by substitution at AA 452–458 of AAV-X1 yielding X1.1, X1.2, and X1.3. (Bottom right) Further capsid engineering on AAV-X1 by mutating AA272/AA386/AA503 to alanine to yield X1.4, X1.6, and X1.5, respectively. C (Left) Percentage of AAV-mediated eGFP-expressing cells that overlap with GLUT1+ markers across brain regions, representing the efficiency of the vectors’ targeting of GLUT1+ cells. A two-way ANOVA and Tukey’s multiple comparisons tests with adjusted P values are reported (***P = 0.0002 for X1 versus X1.1 in the cortex, **P = 0.0022 for X1 versus X1.1 in the hippocampus, **P = 0.0049 for X1 versus X1.1 in the thalamus). Each data point shows the mean of three slices per mouse. (Right) Percentage of GLUT1+ markers in AAV-mediated eGFP-expressing cells across brain regions, representing the specificity of the vectors’ targeting of GLUT1+ cells. A two-way ANOVA and Tukey’s multiple comparisons tests with adjusted P values are reported (**P = 0.0013 for X1 versus X1.1 in the cortex, n.s. P = 0.3854 for X1 versus X1.1 in the hippocampus, *P = 0.0413 for X1 versus X1.1 in the thalamus). Each data point shows the mean of three slices per mouse. D AAV vector yields. A two-way ANOVA and Tukey’s multiple comparisons tests with adjusted P values are reported (**P = 0.0012 for AAV9 versus AAV-X1, n.s. P > 0.9999 for AAV9 versus AAV-X1.1; n = 5 per group, each data point is the mean of three technical replicates, mean ± SEM is plotted). Source data are provided as a Source Data file.
Fig. 3
Fig. 3. AAV9-X1 and AAV9-X1.1 efficiently transduce brain endothelial cells across diverse mice strains and rats.
A Surface plasmon resonance (SPR) plots of PHP.eB, PHP.V1, AAV-X1, and AAV-X1.1 binding to surface-immobilized Ly6a-Fc protein captured on a protein A chip. Lines show the binding response for each vector across a range of vector concentrations. B Illustration demonstrating the IV administration of AAV-X1 capsid packaged with ssAAV:CAG-eGFP genome in genetically diverse mice strains (~8-week-old young C57BL/6J, BALB/cJ, FVB/NJ, and CBA/J, 3E11 vg per mouse) and IV administration of AAV-X1.1 capsid packaged with ssAAV:CAG-tdTomato genome in Lister Hooded rats (adult, 3E13 vg per rat). Created with BioRender.com. C Representative brain and liver images of AAV-X1-mediated eGFP expression (green) in C57BL/6J, BALB/cJ, FVB/NJ, and CBA/J mice with zoomed-in images of hippocampus and thalamus. N = 4 for each mouse strain, males and females, 3 weeks of expression. Sagittal brain section scale bar: 2 mm. Hippocampus and thalamus scale bar: 100 µm. Liver scale bar: 2 mm. D Representative images of the forebrain and hindbrain of AAV-X1.1-mediated tdTomato expression (red) in female Lister Hooded rat. Scale bar: 2 mm, zoom-in image scale bar: 100 µm. N = 3 rats were tested, 3 weeks of expression. E Representative images of cortex of AAV-X1.1-mediated tdTomato expression (red) in female Lister Hooded rat. Tissues were co-stained with GLUT1 (green). N = 3 rats were tested, 3 weeks of expression.
Fig. 4
Fig. 4. X1 capsids can enable repeated AAV administration with serotype switching and can transform the BBB into a biofactory.
A Illustration of utilizing serotype switching to increase BBB permeability for AAVs in non-permissive strains. Created with BioRender.com. B (Left) Illustration of AAV1 monomer structure with the position of the 7-mer insertion, AA 588/589, highlighted (red). (Right) Sequences of AAVs around the insertion site are shown. The color is based on physicochemical properties (Zappo). C (Top) Representative images of AAV1, AAV1-PHP.B, and AAV1-X1-mediated eGFP expression in the hippocampus (scale bar: 100 µm). (Bottom) Zoomed-in images of tissues co-stained with GLUT1 (white) and DAPI (blue) (scale bars: 50 µm). N = 3 mice were tested for each AAV, 3 weeks of expression. D (Left) Representative image of PHP.eB-mediated eGFP expression in the brain of CBA/J mice (scale bar: 200 μm). (Right) Representative images of the brains of CBA/J mice following sequential administration of either AAV9-X1.1:CAG-Ly6a or AAV1-X1:CAG-Ly6a followed by PHP.eB:CAG-eGFP. N = 4 mice were tested for each condition, 8 weeks old, male, 3e11 vg/mouse. E Illustration of transforming brain endothelial cells into a biofactory. (Bottom right) Illustration of the thalamocortical synapses identified by co-localization of VGLUT2 and PSD95 staining. Thalamocortical synapses are lost in Hevin-KO mice. Created with BioRender.com. F (Top) Representative images of AAV-X1.1 vector-mediated expression of eGFP (green) in the brain, which were co-stained with GLUT1 (red) and DAPI (blue) markers (scale bars: 30 µm). (Bottom) Representative images of AAV-X1.1 vector-mediated expression of Hevin in the brain. The tissues were co-stained with HA (green), GLUT1 (red), and DAPI (blue) markers (scale bar: 30 µm). N = 4 males each group, 3 weeks of expression, 4-month-old Hevin-KO mice, 1e12 vg/mouse. G (Left) Representative images of cortical slices stained for PSD95 (green) and VGLUT2 (red) (scale bar: 5 µm). (Right) Quantification of colocalized puncta of VGLUT2 and PSD95 in mice. One-way ANOVA Brown-Forsythe test (****P = 9e-5 for WT versus Hevin-KO: CAG-eGFP, ***P = 0.0006 for Hevin-KO: CAG-eGFP versus Hevin-KO: CAG-Hevin, n.s. P = 0.1156 for WT versus Hevin-KO: CAG-Hevin; n = 4 per group, each data point is the mean of 15 slices for one animal, mean ± SEM is plotted). Source data are provided as a Source Data file.
Fig. 5
Fig. 5. Engineered AAVs can efficiently transduce cultured human brain microvascular endothelial cells and ex vivo macaque and human brain slices.
A (Left) Representative images of AAV (AAV2, AAV9, AAV-DJ, PHP.eB, PHP.V1, BR1, X1, X1.1, X1.2, X1.3, X1.4, X1.5)-mediated eGFP expression (green) in human brain microvascular endothelial cells (HBMECs). (AAVs packaged with ssAAV:CAG-eGFP, n = 6 per condition, 1-day expression). (Right) Percentage of cells transduced by the AAVs. In the condition of MOI:3E4, one-way ANOVA nonparametric Kruskal–Wallis test and multiple comparisons with uncorrected Dunn’s test are reported (***P = 0.0004 for AAV9 versus AAV-X1, ***P = 0.0002 for AAV9 versus AAV-X1.1, ****P = 3.3e-5 for AAV9 versus AAV-X1.2, **P = 0.002 for AAV9 versus AAV-X1.3). In the condition of MOI:3E3, one-way ANOVA nonparametric Kruskal–Wallis test and multiple comparisons with uncorrected Dunn’s test are reported (**P = 0.0082 for AAV9 versus AAV-X1, ***P = 0.0004 for AAV9 versus AAV-X1.1, ***P = 0.0001 for AAV9 versus AAV-X1.2). n = 6 per group, each data point is the mean of three technical replicates, mean ± SEM is plotted. B Illustration of AAV testing in ex vivo macaque and human brain slices. Created with BioRender.com. C DNA and RNA levels in southern pig-tailed macaque brain slices for AAVs, with DNA and RNA levels normalized to AAV9. N = 12 independent slices were examined over three pig-tailed macaque cases. Box plots represent the median, the first quartiles and third quartiles, with whiskers drawn at the 1.5 IQR value. Points outside the whiskers are outliers. D Representative images of AAV-mediated CAG-FXN-HA expression in ex vivo southern pig-tailed macaque brain slices. N = 12 independent slices were examined over three pig-tailed macaque cases. The tissues were co-stained with antibodies against HA (green) and NeuN (magenta). E DNA and RNA level in human brain slices for AAVs, with DNA and RNA levels normalized to AAV9. N = 5 independent slices were examined over two human cases. Box plots represent the median, the first quartiles and third quartiles, with whiskers drawn at the 1.5 IQR value. Points outside the whiskers are outliers. F RNA log enrichment of AAVs across three pig-tailed macaques, one rhesus macaque, and two human brain cases. Source data are provided as a Source Data file.
Fig. 6
Fig. 6. Engineered AAVs can efficiently transduce the central nervous system in the rhesus macaque.
A Illustration of AAV vector delivery to rhesus macaque to study transduction across the CNS and PNS after 3 weeks of expression. Created with BioRender.com. The capsids (AAV9/X1.1) and their corresponding genomes (ssAAV:CAG-eGFP/tdTomato) are shown on the left. Two AAVs packaged with different fluorescent proteins were mixed and intravenously injected at a dose of 5 × 1013 vg/kg per macaque (Macaca mulatta, injected within 10 days of birth, female, i.e., 2.5 × 1013 vg/kg per AAV). Representative images of macaque B, coronal sections of the forebrain, midbrain, hindbrain, and cerebellum (scale bar: 2 mm), and C, selected brain areas: cortex, lingual gyrus (LG), hippocampus, and cerebellum (scale bar: 200 µm). D Brain tissues were co-stained with NeuN (white) or S100β (white) or GLUT1 (white); representative images of the cortex are shown. E Cell type tropism of X1.1 in the macaque brain, shown by the percentage of Fluorescent+/Marker+. Each data point is an average of three images from a slice, n = 6 slices from one rhesus macaque were examined. Mean ± SEM is plotted. F Quantification of the fold change of Fluorescent+/NeuN+ over mean AAV9 in the macaque brain. Each data point is an average of three images from a slice, n = 6 slices from one rhesus macaque were examined. Mean ± SEM is plotted. Source data are provided as a Source Data file.

Update of

References

    1. Yu X, Ji C, Shao A. Neurovascular unit dysfunction and neurodegenerative disorders. Front. Neurosci. 2020;14:334. doi: 10.3389/fnins.2020.00334. - DOI - PMC - PubMed
    1. Xiao M, Xiao Z, Yang B, Lan Z, Fang F. Blood-brain barrier: more contributor to disruption of central nervous system homeostasis than victim in neurological disorders. Front. Neurosci. 2020;14:764. doi: 10.3389/fnins.2020.00764. - DOI - PMC - PubMed
    1. Profaci CP, Munji RN, Pulido RS, Daneman R. The blood-brain barrier in health and disease: important unanswered questions. J. Exp. Med. 2020;217:e20190062. doi: 10.1084/jem.20190062. - DOI - PMC - PubMed
    1. Yang AC, et al. A human brain vascular atlas reveals diverse mediators of Alzheimer’s risk. Nature. 2022;603:885–892. doi: 10.1038/s41586-021-04369-3. - DOI - PMC - PubMed
    1. Aschauer DF, Kreuz S, Rumpel S. Analysis of transduction efficiency, tropism and axonal transport of AAV serotypes 1, 2, 5, 6, 8 and 9 in the mouse brain. PLoS ONE. 2013;8:e76310. doi: 10.1371/journal.pone.0076310. - DOI - PMC - PubMed

Publication types

Substances