. 2023 Jun 8;14(1):3191.
doi: 10.1038/s41467-023-38670-8.

Fertilization controls tiller numbers via transcriptional regulation of a MAX1-like gene in rice cultivation

Affiliations

Fertilization controls tiller numbers via transcriptional regulation of a MAX1-like gene in rice cultivation

Jinying Cui et al. Nat Commun. .

Abstract

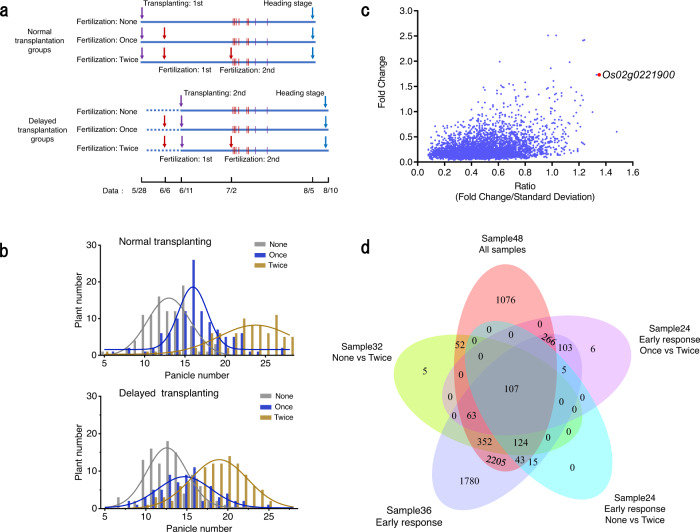
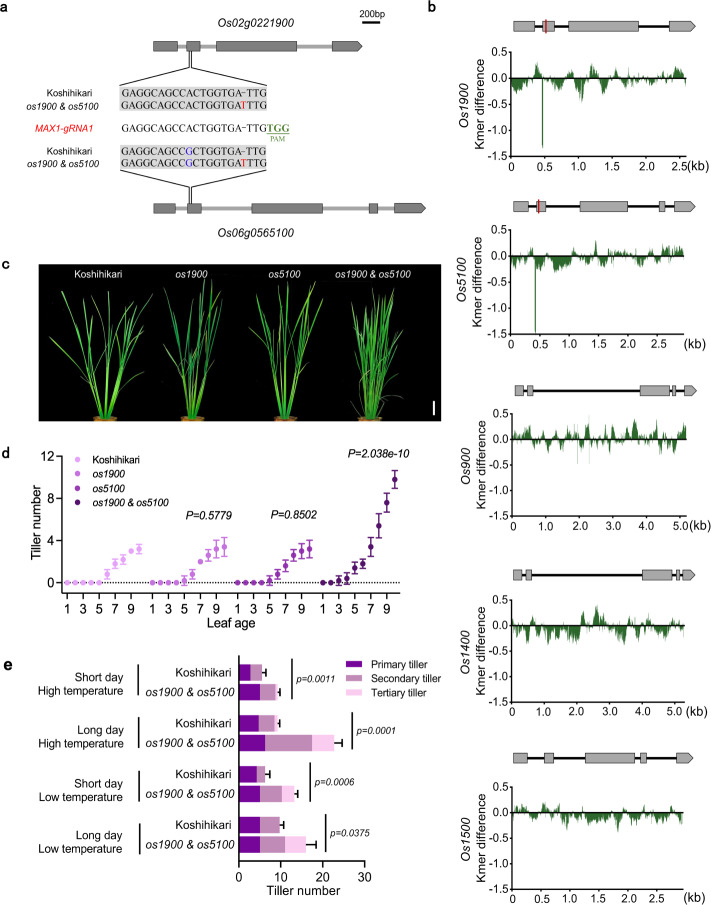
Fertilization controls various aspects of cereal growth such as tiller number, leaf size, and panicle size. However, despite such benefits, global chemical fertilizer use must be reduced to achieve sustainable agriculture. Here, based on field transcriptome data from leaf samples collected during rice cultivation, we identify fertilizer responsive genes and focus on Os1900, a gene orthologous to Arabidopsis thaliana MAX1, which is involved in strigolactone biosynthesis. Elaborate genetic and biochemical analyses using CRISPR/Cas9 mutants reveal that Os1900 together with another MAX1-like gene, Os5100, play a critical role in controlling the conversion of carlactone into carlactonoic acid during strigolactone biosynthesis and tillering in rice. Detailed analyses of a series of Os1900 promoter deletion mutations suggest that fertilization controls tiller number in rice through transcriptional regulation of Os1900, and that a few promoter mutations alone can increase tiller numbers and grain yields even under minor-fertilizer conditions, whereas a single defective os1900 mutation does not increase tillers under normal fertilizer condition. Such Os1900 promoter mutations have potential uses in breeding programs for sustainable rice production.


Conflict of interest statement

The authors declare no competing interests.

Figures

Fig. 1
Fig. 1. Rice gene expression in response to fertilization under natural paddy field conditions.
a Schedule of fertilization and sampling time for transcriptome analysis. Vertical line: Sampling timing, 16:00 7/2, 10:00 7/3, 16:00 7/3, 10:00 7/5, 10:00 7/8, 16:00 7/8, 16:00 7/11, 16:00 7/16. Red ones: early response sampling. Purple ones: late response sampling. See Supplementary Data 1. b Distribution of plants according to panicle numbers per plant under normal and delayed transplanting conditions in the paddy field, Tsukuba, Japan. c Gene expression in response to fertilization under fluctuating environmental conditions according to field transcriptome analysis. Fold change = abs (Mean of log2 (gene expression without fertilization/gene expression with fertilization in a paired sample for each gene)), Ratio = Fold Change/Standard Deviation. This ratio indicates the contribution of fertilization against the entire fluctuation by surrounding environmental factors such as radiation and ambient temperature during cultivation for each gene. d Venn diagram of gene expression under different fertilization combinations such as early responses and late responses according to field transcriptome analysis; FDR (false discovery rate) < 0.01.
Fig. 2
Fig. 2. Phenotypic analysis and genotype identification results for the os1900&os5100 mutant.
a MAX1-gRNA1 and its target sequence and mutation sites. The single MAX1-gRNA1 caused mutations in both Os1900 and Os5100. b k-mer coverage differences among the Os1900, Os5100, Os900, Os1400, and Os1500 genes in wild-type (WT, cv. Koshihikari) and os1900&os5100 mutant in rice. Vertical red lines indicate the locations of gRNA used in this experiment. y-axis: log10 (k-mer for os1900&os5100/k-mer for WT). The k value was 20. c Photographs of tiller phenotypes including WT and os1900, os1500, and os1900&os5100 mutants. Bar = 5 cm. d Tiller numbers from the 1-leaf to 10-leaf stages. The P-values for different pairs (Koshihikari vs. os1900; Koshihikari vs. os5100; Koshihikari vs. os1900&os5100) were obtained based on making generalized linear mixed models (GLMMs) and ANOVA analysis. Error bars indicate SD, n = 5 biologically independent plants. e Comparison of tiller number between WT and the os1900&os5100 mutant under four cultivation conditions, n = 4 biologically independent plants. Significance values are from Student’s t-test (two-tailed). Error bars: SD.
Fig. 3
Fig. 3. Analyses of strigolactone (SL) biosynthesis in WT and os1900&os5100 mutant plants.
a Proposed SL biosynthesis pathway in rice. Genes name marked in black are previous works,, that in red is this work. b, c Endogenous levels of carlactone (CL) and carlactone acid (CLA) in shoot extracts (b) and root extracts c, n = 5 biologically independent samples. d, e Gene expression analysis of Os900, Os1400, Os1900 and Os5100 in shoot d and root e of Koshihikari and os1900&os5100 mutants sampled in the same manner as plant used for LC-MS/MS, n = 3 biologically independent samples. Error bar is SD, Significance values are from Student’s t-test (two-tailed) be. fh Tiller length in WT and os1900&os5100 mutants under different concentrations of a synthetic SL analog ((+)-GR24), unit: μM. White arrows indicate the second tiller. Bar in f represents 0.5 cm. In g, h, the error bar indicates SD, n = 6 biologically independent plants, multiple comparisons, turkey (P < 0.05), P-value see Supplementary Data 4. i Gene expression of Os1900 and Os5100 in plants produced by in situ hybridization. Bar = 100 μm. Two times the experiment was repeated with similar results. For histone H4 as a positive control of this experiment, see Supplementary Fig. 5e.
Fig. 4
Fig. 4. Detailed gene expression of Os1900 to fertilization and regulation of tiller number under minor- and trace- fertilization conditions.
a Schematic diagram of fertilization conditions for Os1900 expression analysis in leaves. After germination, plants were cultivated without fertilizer for 7 days, and then ½ Kimura’s B solution fertilizer was applied. From the 9th day, group i was sampled daily, and groups ii-iv were fertilized again when fertilizer concentration (total dissolved solids, TDS) dropped to 90, 50, and 30 ppm, respectively. Sampling (triangles) was conducted at 0, 1, 3, 6, and 24 h after fertilization. b Analysis of Os1900 expression under different fertilizer conditions. The error bar is SD, n = 3, 4 biologically independent samples. c, d Tiller numbers of os1900, os5100 single mutant and os1900&os5100 double mutant under minor- c and trace- d fertilization condition from 4- to 9-leaf age, n = 5 biologically independent plants. Cultivation condition: see methods. The P-values for different pairs (Koshihikari vs. os1900; Koshihikari vs. os5100; Koshihikari vs. os1900&os5100) are obtained by making a GLM model and subsequent ANOVA test. Error bars: SD.
Fig. 5
Fig. 5. Engineering of the Os1900 promoter provided a continuum of alleles with different fertilization responses.
a Profile of three double-strand break sites and three expected deletion mutations. b Schematic view of the Os1900 promoter target for 19 guide RNAs (gRNAs), where three gRNAs represent one construction. The target promoter region was 5 kb upstream of the translation start position (ATG). c Sequencing of Os1900 promoter deletion mutants (M1M9) among T1 plants. (–) indicates deletions; (+) indicates insertions. d Potential fertilizer-related cis-regulatory elements (CREs) related to combinations of N, P-fertilizer in the Os1900 promoter were scanned using the PlantPAN3.0 program at a relative profile score threshold of 99%. Black triangles: CREs related to P; Pink triangles: CREs related to N; Red star marks: P1BSs. e Overlapping evolutionally conserved CREs of Os1900 (showed in d) with other MAX1-like genes (Os900, Os1400, Os5100). f Os1900 gene expression of various Os1900 promoter mutants to different fertilizer concentrations, n = 3,4 biologically independent samples. Means of M1–M9 were compared with the corresponding gene expression in WT in four conditions, respectively. 50 ppm 0 h and 1 h: TDS is 50 ppm and 245 ppm, respectively; 30 ppm 0 h and 1 h: TDS is 30 ppm and 245 ppm, respectively. Cultivation conditions and sampling time were the same with Fig. 5b. (*FDR < 0.05; **FDR < 0.01. FDR values, see Supplementary Data 4). Error bars indicate SD, Significance value is from Student’s t-test (two-tailed).
Fig. 6
Fig. 6. Tiller numbers in a series of Os1900 promoter mutant under minor-(a) and trace-(b) fertilization conditions.
Horizontal axis: leaf age. Fertilization condition: see methods. Data showed average values, n = 8 biologically independent plants. Purple a and green b shadows were error bands. The P-values for different pairs (Koshihikari vs. promoter deletion mutants) are obtained by making a GLMM and subsequent ANOVA test.

References

    1. Wang B, Smith SM, Li J. Genetic regulation of shoot architecture. Annu. Rev. plant Biol. 2018;69:437–468. doi: 10.1146/annurev-arplant-042817-040422. - DOI - PubMed
    1. Evenson RE, Gollin D. Assessing the impact of the green revolution, 1960 to 2000. science. 2003;300:758–762. doi: 10.1126/science.1078710. - DOI - PubMed
    1. Hedden P. The genes of the green revolution. TRENDS Genet. 2003;19:5–9. doi: 10.1016/S0168-9525(02)00009-4. - DOI - PubMed
    1. Khush GS. Green revolution: preparing for the 21st century. Genome. 1999;42:646–655. doi: 10.1139/g99-044. - DOI - PubMed
    1. Pingali PL. Green revolution: impacts, limits, and the path ahead. Proc. Natl Acad. Sci. USA. 2012;109:12302–12308. doi: 10.1073/pnas.0912953109. - DOI - PMC - PubMed

Publication types