. 2023 Jun 8;14(1):3377.
doi: 10.1038/s41467-023-38766-1.

South Asian medical cohorts reveal strong founder effects and high rates of homozygosity

Jeffrey D Wall #  1   2 J Fah Sathirapongsasuti #  3   4 Ravi Gupta #  5 Asif Rasheed #  6 Radha Venkatesan #  7 Saurabh Belsare  8 Ramesh Menon  5 Sameer Phalke  5 Anuradha Mittal  9 John Fang  9 Deepak Tanneeru  5 Manjari Deshmukh  5 Akshi Bassi  5 Jacqueline Robinson  8 Ruchi Chaudhary  3 Sakthivel Murugan  5 Zameer Ul-Asar  6 Imran Saleem  6 Unzila Ishtiaq  6 Areej Fatima  6 Saqib Shafi Sheikh  10 Shahid Hameed  10 Mohammad Ishaq  11 Syed Zahed Rasheed  11 Fazal-Ur-Rehman Memon  12 Anjum Jalal  13 Shahid Abbas  13 Philippe Frossard  6 Christian Fuchsberger  14   15   16 Lukas Forer  16 Sebastian Schoenherr  16 Qixin Bei  17 Tushar Bhangale  18 Jennifer Tom  19 Santosh Gopi Krishna Gadde  20 Priya B V  20 Naveen Kumar Naik  20 Minxian Wang  21 Pui-Yan Kwok  8   22   23 Amit V Khera  24   25   26 B R Lakshmi  27 Adam S Butterworth  28   29   30   31 Rajiv Chowdhury  28 John Danesh  28   29   30   31   32 Emanuele di Angelantonio  28   29   30   31 Aliya Naheed  33 Vinay Goyal  34   35   36 Rukmini M Kandadai  37 Hrishikesh Kumar  38 Rupam Borgohain  37 Adreesh Mukherjee  39 Pettarusp M Wadia  40 Ravi Yadav  41 Soaham Desai  42 Niraj Kumar  43 Atanu Biswas  39 Pramod Kumar Pal  41 Uday B Muthane  44 Shymal K Das  39 Vedam L Ramprasad  5 Prashanth L Kukkle  43   45   46 Somasekar Seshagiri  4   17 Sekar Kathiresan  21   26   47 Arkasubhra Ghosh  20 V Mohan  7 Danish Saleheen  6   48 Eric W Stawiski  3   4   17   49 Andrew S Peterson  50   51   52   53
Affiliations

South Asian medical cohorts reveal strong founder effects and high rates of homozygosity

Jeffrey D Wall et al. Nat Commun. .

Abstract

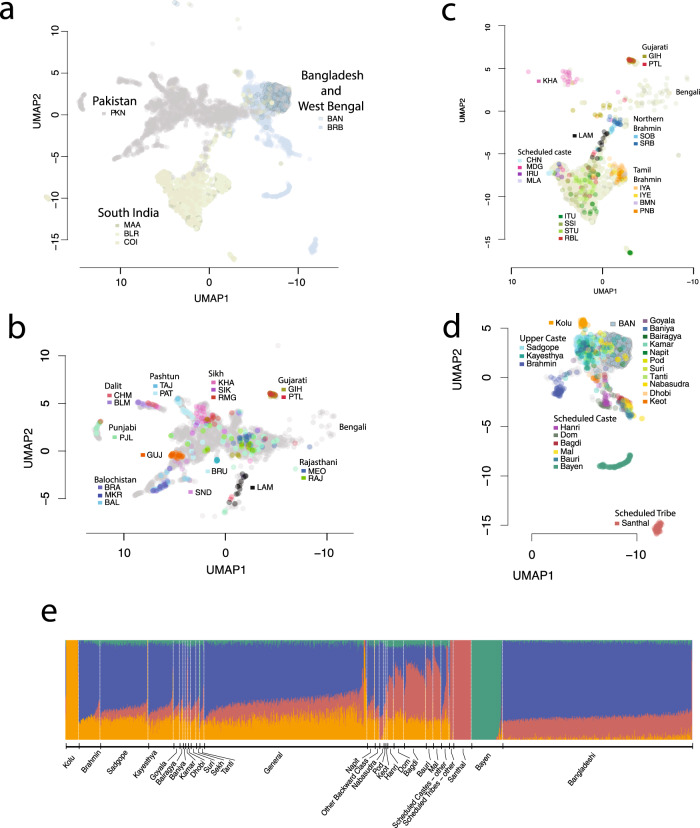
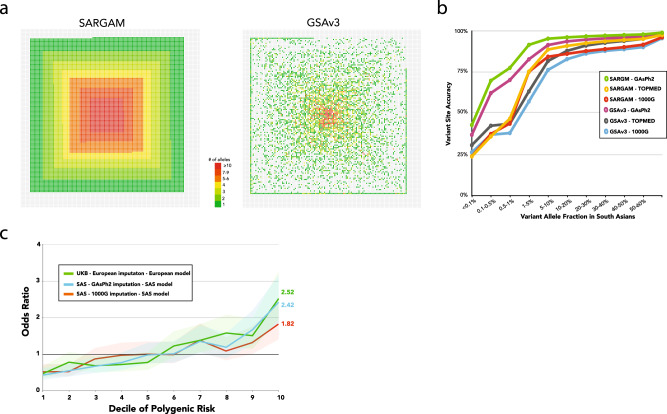
The benefits of large-scale genetic studies for healthcare of the populations studied are well documented, but these genetic studies have traditionally ignored people from some parts of the world, such as South Asia. Here we describe whole genome sequence (WGS) data from 4806 individuals recruited from the healthcare delivery systems of Pakistan, India and Bangladesh, combined with WGS from 927 individuals from isolated South Asian populations. We characterize population structure in South Asia and describe a genotyping array (SARGAM) and imputation reference panel that are optimized for South Asian genomes. We find evidence for high rates of reproductive isolation, endogamy and consanguinity that vary across the subcontinent and that lead to levels of rare homozygotes that reach 100 times that seen in outbred populations. Founder effects increase the power to associate functional variants with disease processes and make South Asia a uniquely powerful place for population-scale genetic studies.


Conflict of interest statement

J.D.W. has worked as a consultant for Genentech, MedGenome, and Maze Therapeutics, and has received research funding from Genentech. J.F.S. is a former employee and shareholder of 23andMe. A.V.K. is an employee of Verve Therapeutics; has served as a scientific advisor for Sanofi, Amgen, Maze Therapeutics, Novartis, Silence Therapeutics, Veritas International, Color Health, and Third Rock Ventures; holds equity in Verve Therapeutics, Marea Therapeutics, Color Health and Foresite Labs; and received a sponsored research agreement from IBM Research. The remaining authors declare no competing interests.

Figures

Fig. 1
Fig. 1. Fine-scale population structure in the healthcare delivery system reflects the geographical locations of the sample sources.
UMAP was run on all samples using the first 15 principal components. a In the South Asian subset, samples cluster into three major groups by sample origins: Pakistan, South India, and West Bengal and Bangladesh. The X-axis (UMAP1) was flipped so that the similarity between the graphical position of the three populations and the map of South Asia was apparent. b, c Samples with detailed locations or self-reported group memberships are shown to segregate within Pakistan and South India clusters. Among the samples from Pakistan and South India, some segregate with recent immigrants (e.g., Bengalis and Gujaratis) and historical immigrants (e.g., Lambadas), reflecting the metropolitan nature of the recruitment centers. d Samples from Birbhum District, West Bengal, have detailed self-reported group membership information. Upper castes, scheduled castes, and scheduled tribes clearly segregate, reflecting the historical reproductive isolation between these groups. Bayen and Santhal are two notable population isolates. e ADMIXTURE analysis of samples from the Birbhum District shows four major components. Labels are self-reported group identities with “general” denoting a lack of specified identity. PKN Pakistan, BLR Bangalore, MAA Chennai, COI Coimbatore, BAN Bangladesh, BRB Birbhum District, West Bengal, LAM Lambada. For other 3-letter codes, see Supplementary Data 1.
Fig. 2
Fig. 2. Homozygosity and inbreeding across different cohorts.
a Observed/expected proportions of rare homozygotes, stratified by minor allele frequency and population. The expected values assume random mating. b Stacked bar chart showing the estimated degree of inbreeding for individuals in the South Asian medical cohorts. c Same as in panel a but for “inbred” individuals (whose parents are estimated to be third-degree relatives or more closely related) only. d Same as in panel a but for “outbred” individuals (whose parents are estimated to be sixth-degree relatives or more distantly related) only. e Ridgeplots showing the distribution across individuals of the total (genetic) length of the genome contained in ROHs that are at least 1 cM in length. f Ridgeplots showing the stratification of panel e’s PKN plot into groups with different estimated degrees of inbreeding.
Fig. 3
Fig. 3. Loss of function mutations.
a Number of high confidence loss of function genes found at a minimum of 0.1% MAF in their relative population for overall non-Finnish European (NFE), NFE and not in SAS (NFE Unique), NFE and SAS (NFE and SAS), SAS and not NFE (SAS Unique) and overall for SAS. b Loss of function gene space by population. Each square represents a distinct gene and is colored by its maximum AF within the relative group. Genes are separated by groups in which they are found (from top to bottom and then left to right): NFE unique, NFE and SAS, PKN unique, PKN and SOI, PKN and BNG, all of SAS (PKN and SOI and BNG), SOI unique, BNG unique, and BNG and SAS. c Effects of pLoF variants on blood lipid markers replicated the known biology: PCSK9 pLoFs associated with decreased LDL, ANGPTL3 pLoFs associated with decreased triglycerides, and CETP pLoF associated with increased HDL. Only samples from South India (Bangalore and Chennai) were included. P values were calculated using the Wilcoxon rank-sum test. Box shows median and middle 50% of the distribution; whiskers show values within 1.5 times the interquartile range from the first and third quartiles. d Mean number of homozygous pLoF variants per individual, stratified by population and estimated degree of inbreeding. e APOC3 p.Arg19Ter alleles are found at a high frequency among Balochi and Sindhi individuals from Southern Pakistan. Three of the self-reported Balochis and Sindhis were heterozygous carriers, but a larger number of carriers without self-reported identity were mapped to the same region on the UMAP plot.
Fig. 4
Fig. 4. Improved genotyping of South Asian genomes.
a Gene space plot of all protein-altering alleles that are directly genotyped using either the SARGAM or the Illumina GSA3 arrays. Protein-coding genes of the human genome are depicted as an array of 19,600 squares. Genes whose variants are genotyped are colored to indicate the number of gene-specific variants that are genotyped. b Accuracy of non-reference allele imputation expressed as the concordance rate and plotted versus South Asian minor allele frequency. Array genotypes were modeled by down-sampling from an independent dataset of 30× WGS data. Missing genotypes were imputed using the indicated reference panels and the variant site accuracy of non-reference alleles was calculated and graphed for variants imputed from the two indicated model array datasets. c Impact of imputation on polygenic risk score (PRS) calculation. PRS were calculated using imputed genotypes from a CAD case–control cohort of 2963 South Asian individuals genotyped using the Illumina GSA3 array and using a SAS PRS model. The individuals were divided into 10 groups based on deciles of PRS and odds ratios were calculated from the case–control status of the individuals in each group. For comparison, a case–control cohort of white Britons, matched for age and gender with the SAS cohort, was selected from the UK Biobank dataset. PRS was calculated using a European model; point estimates of the odds ratios are displayed as solid lines for each PRS, and the corresponding 95% confidence intervals (using the empirical variance based on the case/control counts in each decile) are shown as a shaded area.

References

    1. Norio R. Finnish Disease Heritage I: characteristics, causes, background. Hum. Genet. 2003;112:441–456. doi: 10.1007/s00439-002-0875-3. - DOI - PubMed
    1. Gross SJ, Pletcher BA, Monaghan KG, Professional Practice and Guidelines Committee Carrier screening in individuals of Ashkenazi Jewish descent. Genet. Med. 2008;10:54–56. doi: 10.1097/GIM.0b013e31815f247c. - DOI - PMC - PubMed
    1. Payne M, Rupar CA, Siu GM, Siu VM. Amish, mennonite, and hutterite genetic disorder database. Paediatr. Child Health. 2011;16:e23–e24. doi: 10.1093/pch/16.3.e23. - DOI - PMC - PubMed
    1. Gudbjartsson DF, et al. Large-scale whole-genome sequencing of the Icelandic population. Nat. Genet. 2015;47:435–444. doi: 10.1038/ng.3247. - DOI - PubMed
    1. Reich D, Thangaraj K, Patterson N, Price AL, Singh L. Reconstructing Indian population history. Nature. 2009;461:489–494. doi: 10.1038/nature08365. - DOI - PMC - PubMed

Publication types