. 2023 Jun 8;14(1):3362.
doi: 10.1038/s41467-023-38967-8.

Quantitative constraints on flood variability in the rock record

Affiliations

Quantitative constraints on flood variability in the rock record

Jonah S McLeod et al. Nat Commun. .

Abstract

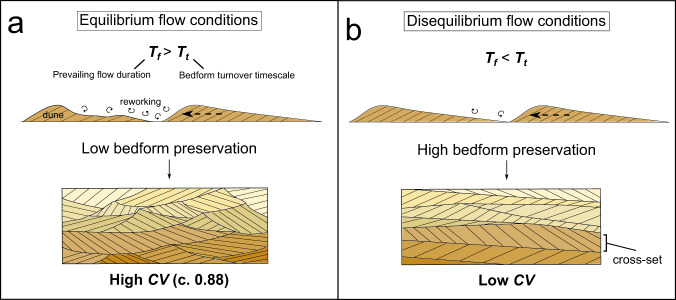
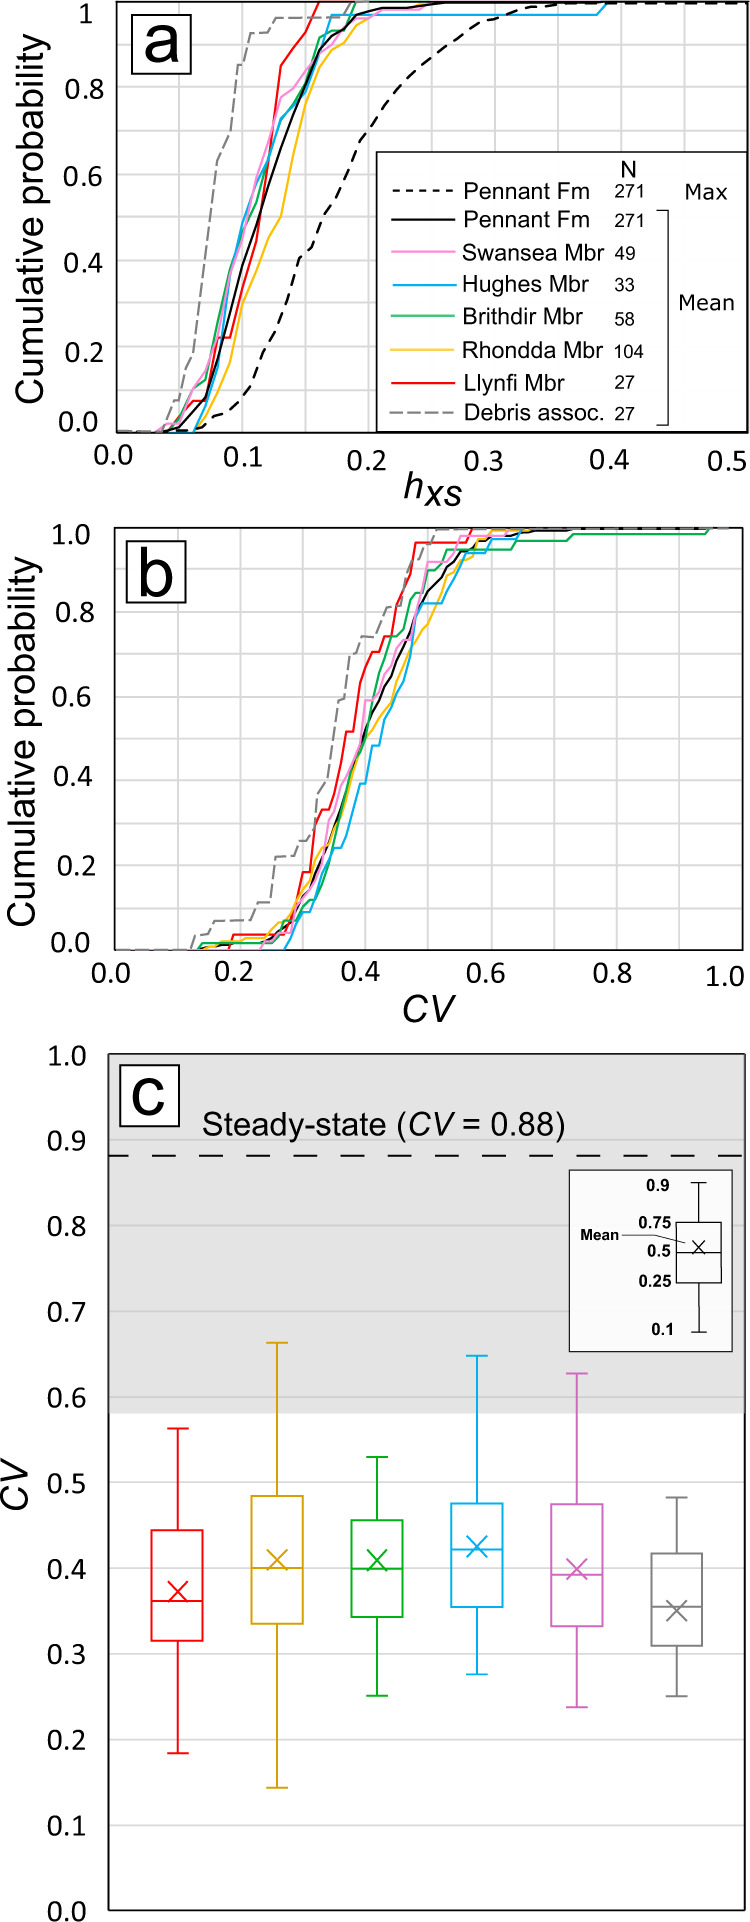
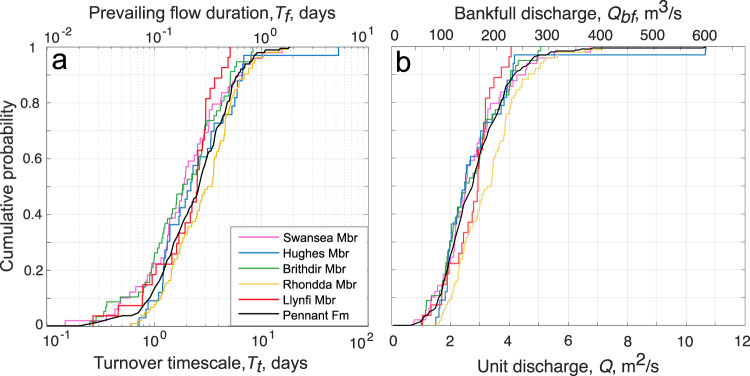
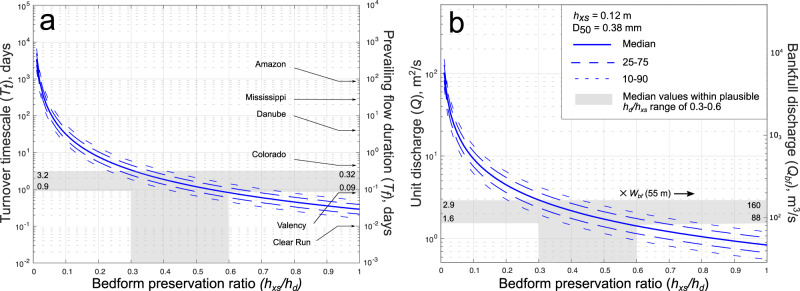
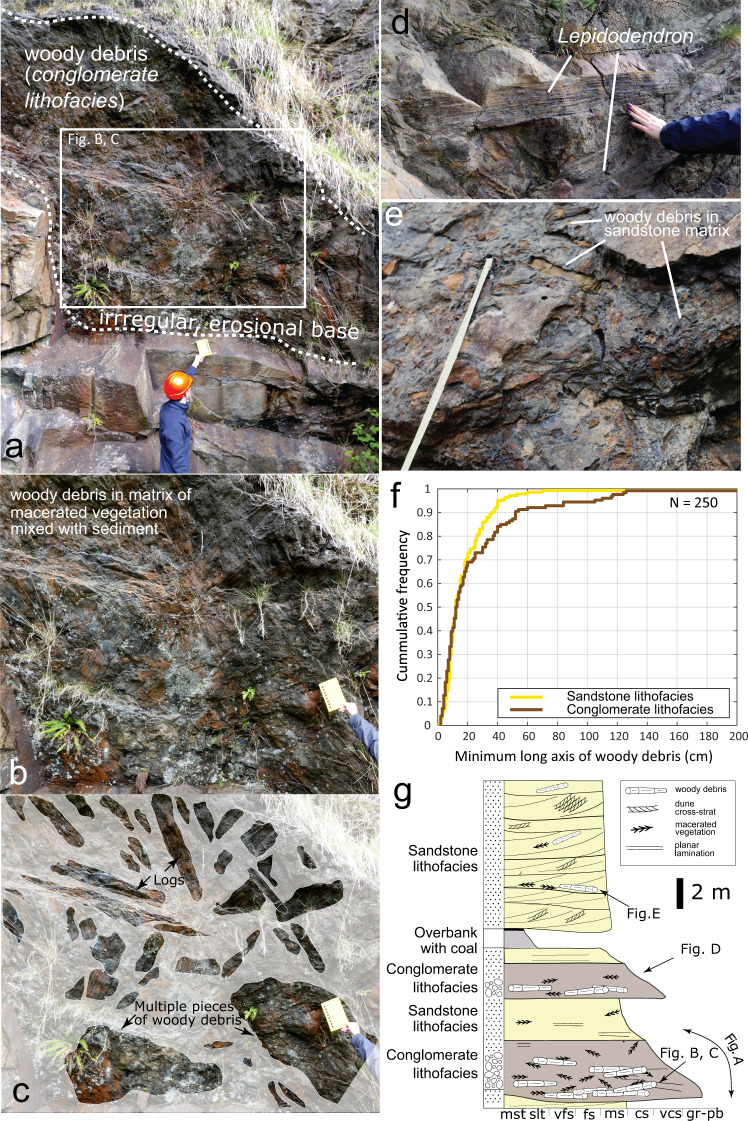
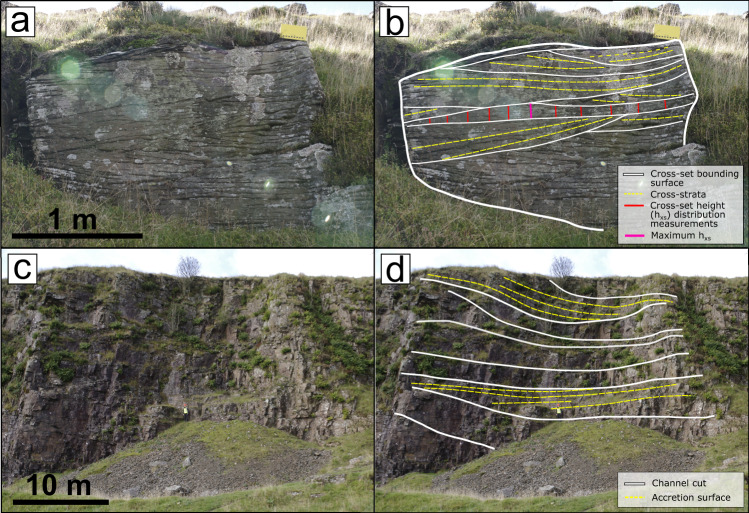
Floods determine river behaviour in time and space. Yet quantitative measures of discharge variability from geological stratigraphy are sparse, even though they are critical to understand landscape sensitivity to past and future environmental change. Here we show how storm-driven river floods in the geologic past can be quantified, using Carboniferous stratigraphy as an exemplar. The geometries of dune cross-sets demonstrate that discharge-driven disequilibrium dynamics dominated fluvial deposition in the Pennant Formation of South Wales. Based on bedform preservation theory, we quantify dune turnover timescales and hence the magnitude and duration of flow variability, showing that rivers were perennial but prone to flashy floods lasting 4-16 h. This disequilibrium bedform preservation is consistent across 4 Ma of stratigraphy, and coincides with facies-based markers of flooding, such as mass-preservation of woody debris. We suggest that it is now possible to quantify climate-driven sedimentation events in the geologic past, and reconstruct discharge variability from the rock record on a uniquely short (daily) timescale, revealing a formation dominated by flashy floods in perennial rivers.


Conflict of interest statement

The authors declare no competing interests.

Figures

Fig. 1
Fig. 1. The hydrodynamic conditions that lead to differences in coefficient of variation of cross-set height, CV, recorded in cross-strata.
a Dune migration and evolution in steady-state (equilibrium) flow conditions, and the resultant geometries of preserved cross-sets; b dune evolution and preservation in disequilibrium with prevailing flow, resulting in low CV.
Fig. 2
Fig. 2. The South Wales and Pembrokeshire Coalfields, and the localities used for primary data collection.
Pennant Formation geology is outlined after Jones and Hartley. The stratigraphic column shows the five Members of the Pennant Formation, modified from Waters et al., and Barclay with age data from the British Geological Survey Geological Timechart. The localities are colour-coded by Member.
Fig. 3
Fig. 3. Cross-set data demonstrating disequilibrium bedform preservation.
a Cumulative probability distributions of mean cross-set height for each member of the Pennant Formation, with distributions of the mean, 84th percentile, maximum for the Pennant Formation overall, and cross-sets associated with woody debris; b similar to (a), but with distributions of CV; c the CV of cross-set height for each member of the Pennant Formation. The dashed line and grey shaded region indicate the theoretical and empirical range of CV at steady state of 0.88 ± 0.3,, and the grey box represents cross-sets associated with woody debris.
Fig. 4
Fig. 4. Cumulative probability distribution graphs showing key palaeohydrological variables.
a The primary x-axis represents bedform turnover timescale, Tt, in each member of the Pennant Formation, and the secondary x-axis indicates prevailing flow duration, Tf, which we set as 0.1Tt, following Leary and Ganti; b the primary x-axis represents the unit discharge, Q, and the secondary x-axis represents the bankfull discharge, Qbf, calculated by multiplying Q by the average width of the channel, 55 m.
Fig. 5
Fig. 5. The effect of increased bedform preservation ratios on key palaeohydrologic parameters.
a The primary y-axis indicates bedform turnover timescale, Tt, and the secondary y-axis indicates prevailing flow duration, Tf, when bedform disequilibrium number, T, is set as 0.1, and Tf of 6 modern rivers are given for comparison (references in Supplementary Information); b the primary y-axis indicates unit discharge, Q, and the secondary y-axis indicates bankfull discharge, Qbf, when channel width is set as 55 m, the average for the Pennant Formation.
Fig. 6
Fig. 6. Examples of woody debris in the Pennant Formation, specifically in the Llynfi Member, at Kilvey Hill, Loc3.3.
a The underside of the erosional base of a log-jam deposit in the conglomerate lithofacies, in which clasts comprise plant debris as opposed to rock fragments, overlying channel sandstone; b, c a closer view of this outcrop, with the largest woody debris fossils highlighted, noting that the matrix is composed of a mixture of sediment and macerated vegetation; d an example of well-preserved Lepidodendron fossils; e a debris bed in the sandstone lithofacies; f the cumulative frequency distribution of the minimum long axis of debris fossil found in the sandstone and conglomerate lithofacies; and g a schematic log displaying the typical features of the conglomerate and sandstone lithofacies in the Pennant Formation, using Kilvey Hill as an exemplar.
Fig. 7
Fig. 7. Field measurements at outcrop.
a, b Methods of collecting cross-set height measurements, where the vertical bars make one cross-set height distribution, Locality 6.2; c, d architectural elements observed at outcrop scale, including accretion surfaces for use in Equation 7, Locality 2.1.

References

    1. Milliman JD, Meade RH. Worldwide delivery of river sediment to the oceans. Geology. 1983;91:1–21.
    1. Baker, V. R., Kochel, R. C. & Patton, P. C. Flood Geomorphology (Wiley-Interscience, 1988).
    1. Parsons M, McLoughlin CA, Kotschy KA, Rogers KH, Rountree MW. The effects of extreme floods on the biophysical heterogeneity of river landscapes. Front. Ecol. Environ. 2009;3:487–494. doi: 10.1890/1540-9295(2005)003[0487:TEOEFO]2.0.CO;2. - DOI
    1. Trümper S, et al. Late Palaeozoic red beds elucidate fluvial architectures preserving large woody debris in the seasonal tropics of central Pangaea. Sedimentology. 2020;67:1973–2012. doi: 10.1111/sed.12692. - DOI
    1. Palik B, et al. Geomorphic variation in riparian tree mortality and stream coarse woody debris recruitment from record flooding in a coastal plain stream. Écoscience. 2016;5:551–560. doi: 10.1080/11956860.1998.11682487. - DOI