. 2023 Jun 8;14(1):3372.
doi: 10.1038/s41467-023-39046-8.

Astrocyte-oligodendrocyte interaction regulates central nervous system regeneration

Affiliations

Astrocyte-oligodendrocyte interaction regulates central nervous system regeneration

Irene Molina-Gonzalez et al. Nat Commun. .

Abstract

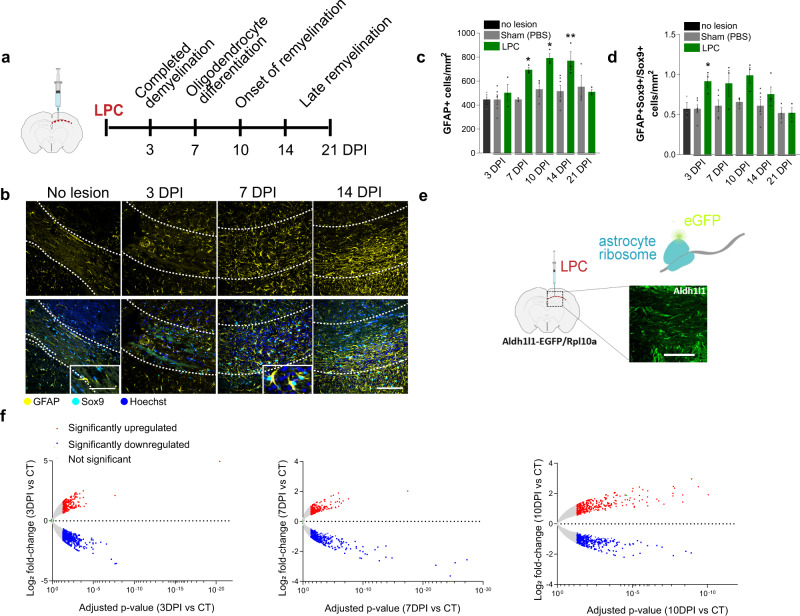
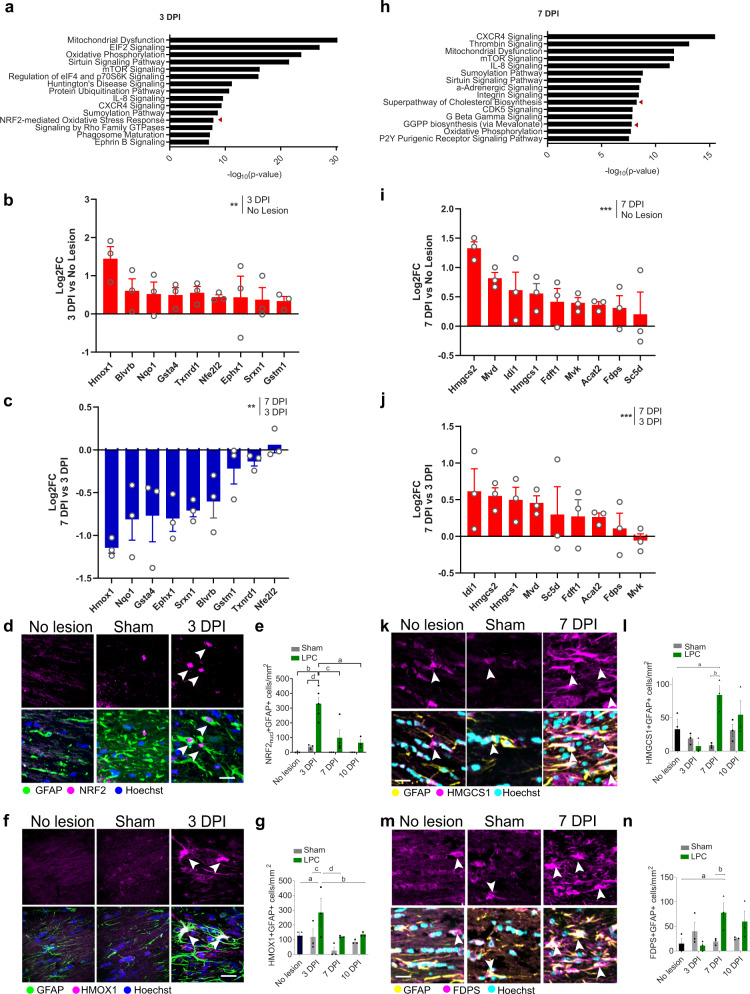
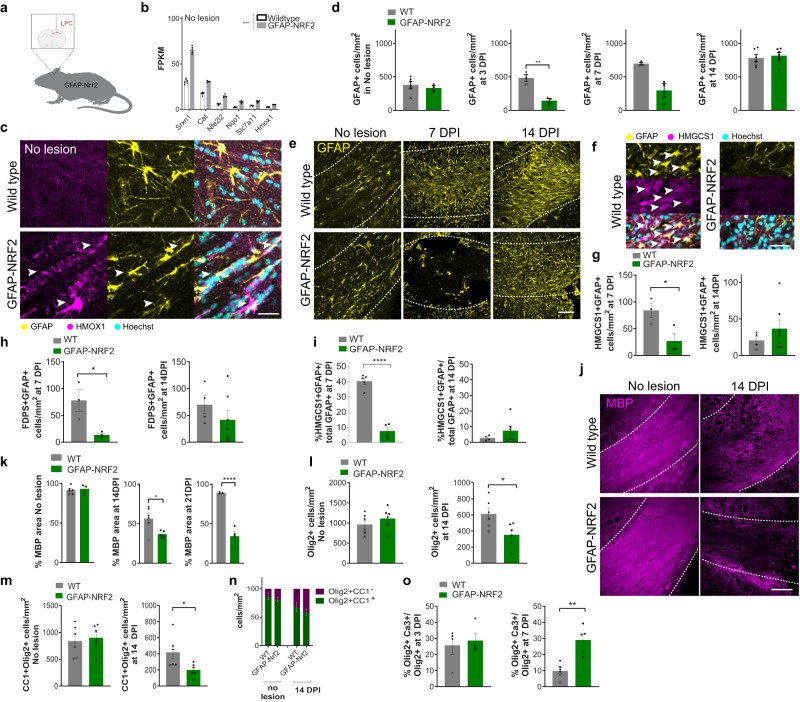
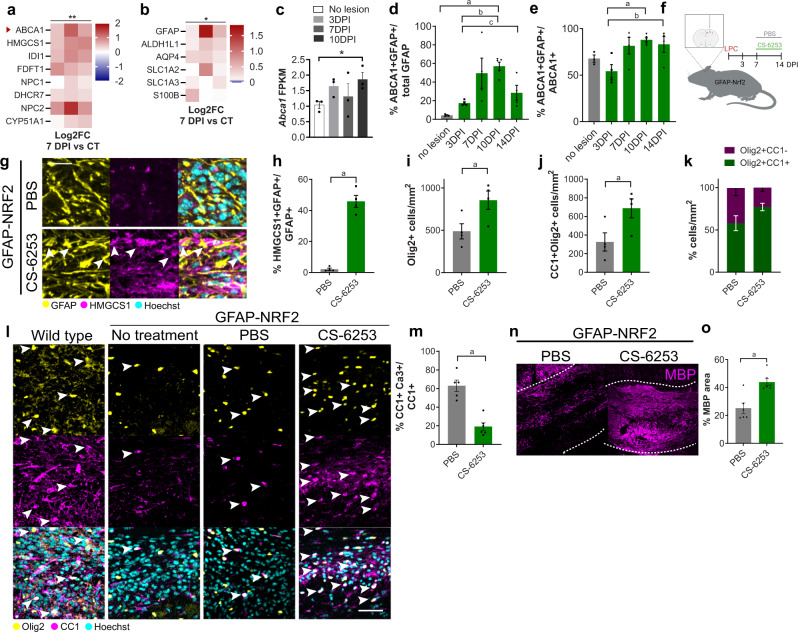
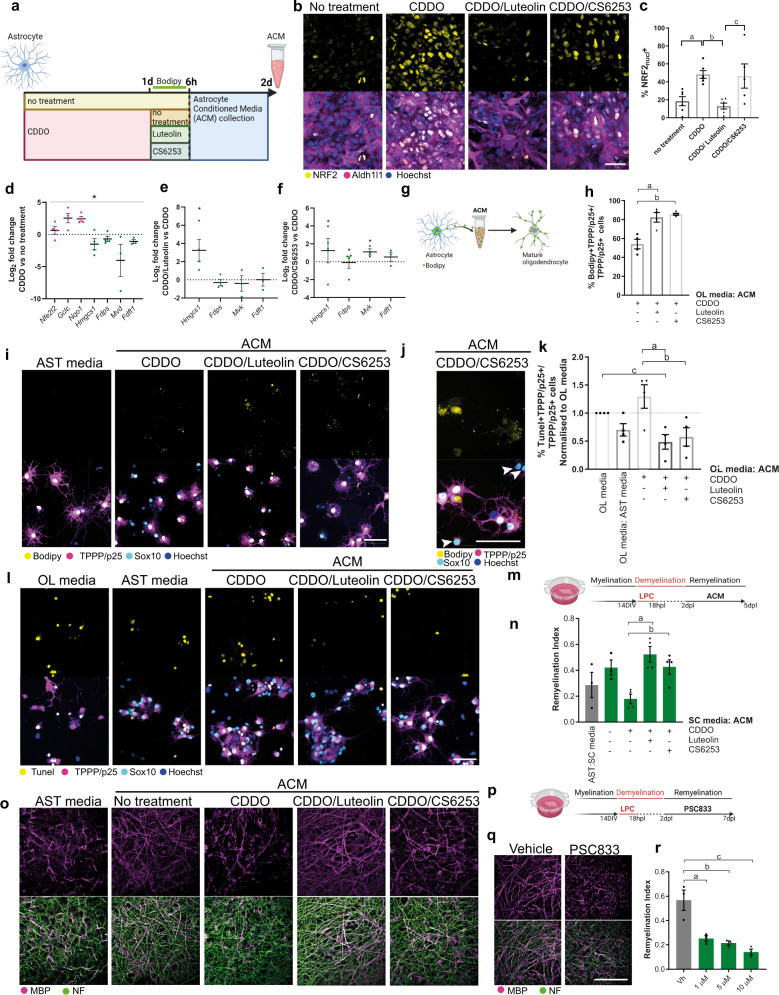
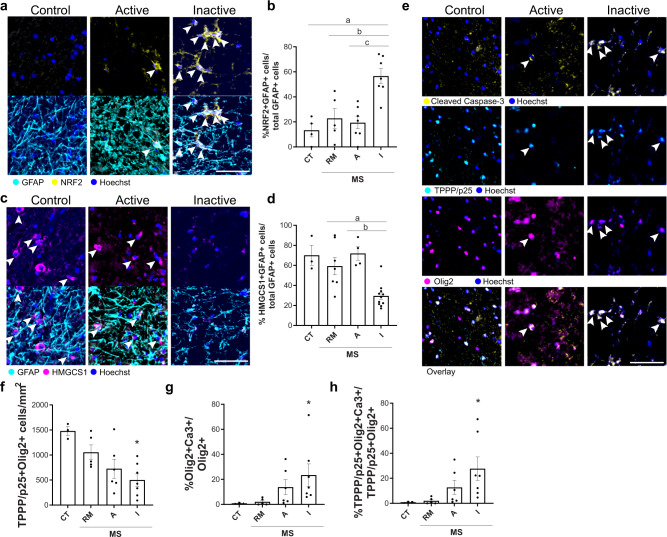
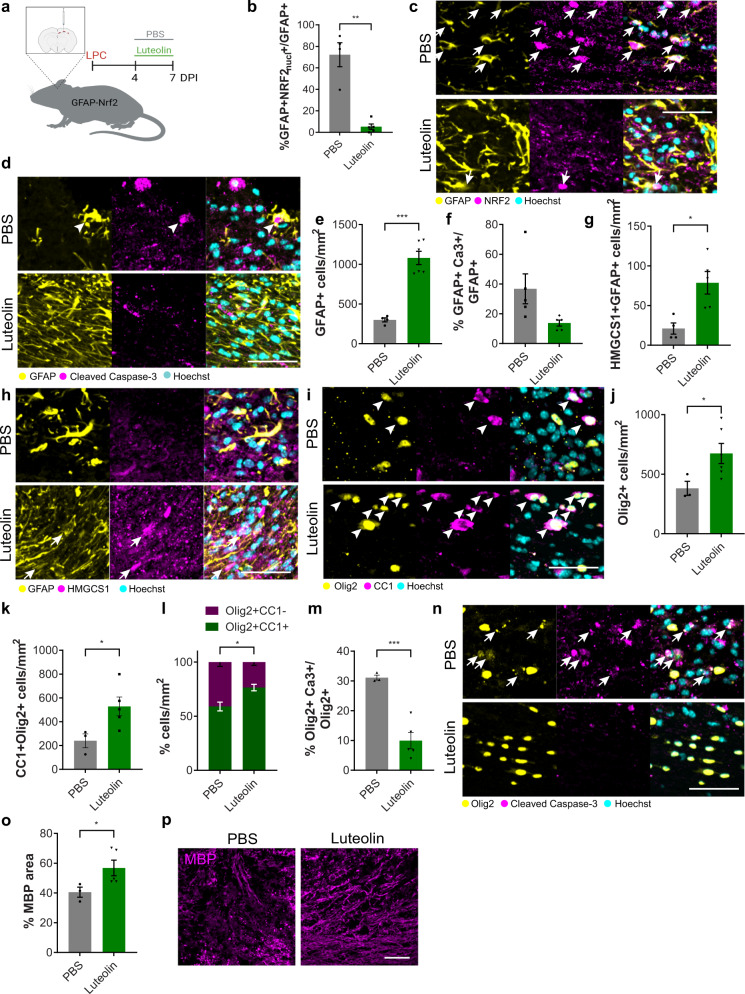
Failed regeneration of myelin around neuronal axons following central nervous system damage contributes to nerve dysfunction and clinical decline in various neurological conditions, for which there is an unmet therapeutic demand. Here, we show that interaction between glial cells - astrocytes and mature myelin-forming oligodendrocytes - is a determinant of remyelination. Using in vivo/ ex vivo/ in vitro rodent models, unbiased RNA sequencing, functional manipulation, and human brain lesion analyses, we discover that astrocytes support the survival of regenerating oligodendrocytes, via downregulation of the Nrf2 pathway associated with increased astrocytic cholesterol biosynthesis pathway activation. Remyelination fails following sustained astrocytic Nrf2 activation in focally-lesioned male mice yet is restored by either cholesterol biosynthesis/efflux stimulation, or Nrf2 inhibition using the existing therapeutic Luteolin. We identify that astrocyte-oligodendrocyte interaction regulates remyelination, and reveal a drug strategy for central nervous system regeneration centred on targeting this interaction.


Conflict of interest statement

The authors declare no competing interests.

Figures

Fig. 1
Fig. 1. Astrocyte reactivity and translatomes dynamically change during remyelination.
a LPC-demyelinated lesions of adult mouse corpus callosum analysed at demyelination (3 DPI; days post-injection), oligodendrocyte differentiation/survival (7 DPI), the onset of remyelination (10 DPI) and late remyelination (14–21 DPI). b Reactive (GFAP+; yellow) astrocytes (SOX9+; cyan) in the corpus callosum (outlined) in no-lesion control and at 3, 7 and 14 DPI. Hoechst indicates nuclei in blue. Scale bar, 100 μm. Inset: increased astrocyte hypertrophy over time. Scale bar, 50 μm. c Mean GFAP+ cells/mm2 ± s.e.m. Two-way ANOVA with Sidak’s post hoc test versus sham, adjusted P values 0.0142 7 DPI, 0.0164 10 DPI and 0.0057 14 DPI. ANOVA summary (Interaction P = 0.0158, F = 3.338, Time P = 0.0011, F = 5.393, Condition P = 0.0002, F = 17.44). n = 3 mice/group (no lesion, 3, 7, 10, 14, 21 DPI LPC), n = 4 mice/group (7 DPI sham), n = 6 mice/group (3 and 14 DPI sham). d Mean proportion of GFAP + SOX9+ cells/mm2 ± s.e.m normalised to total SOX9+ cells. Two-way ANOVA with Sidak’s post hoc test versus sham, adjusted P value 0.0280 3 DPI. ANOVA summary (Interaction P = 0.2851, F = 1.322, Condition P = 0.0004, F = 16.35, Time P value = 0.0331, F = 3.036). n = 3 mice/group (no lesion, 3, 7, 10, 21 DPI LPC), n = 4 mice/group (14 DPI LPC), n = 5 mice/group (7 DPI sham), n = 6 mice/group (3 and 14 DPI sham). e TRAP of lesions in Aldh1l1-EGFP/Rpl10a mice by purification of eGFP-labelled ribosomes from astrocytes. Scale bar, 50 μm. f Volcano plots of adjusted P values against Log2 fold change at 3 DPI, 7 DPI and 10 DPI compared to control (CT), using a threshold of 1.3-fold and adjusted P value of <0.05. Red indicates upregulated genes, blue represents downregulated genes, and grey indicates genes which were not significantly changed. DESeq2 Benjamini–Hochberg test, adjusted P values <0.05. n = 3 mice/group. Source data is provided with this paper. The images in 1a and 1e were created with Biorender.com.
Fig. 2
Fig. 2. Astrocytes transiently engage the Nrf2 pathway followed by the cholesterol biosynthesis pathway during remyelination.
a Top significantly engaged pathways at 3 days post-injection (DPI). Fisher’s exact test, P < 0.05. b Log2 fold change (FC) of Nrf2-target genes at 3 DPI vs no-lesion control. n = 3 mice/condition. **P value = 0.0017, t = 4.616, two-tailed ratio paired t-test on expression (FPKM). c Log2FC of Nrf2 genes at 7 DPI vs 3 DPI. n = 3 mice/condition. **P value = 0.0068, t = 3.621, two-tailed ratio paired t-test on expression. d NRF2+ (magenta) GFAP+ astrocytes (green) (arrows) at 3 DPI, Hoechst in blue. Scale bar, 25 μm. e Nrf2 (nuclear)+ GFAP+ cells/mm2 ± s.e.m.. Two-way ANOVA with Tukey’s multiple comparisons test, aP = 0.0002, bP < 0.0001, cP = 0.0004, dP < 0.0001. ANOVA summary (Interaction F(4,12) = 5.897, P value = 0.0024; Time-point factor F(2,21) = 8.062, P value = 0.0025; Condition factor F(2,21) = 22.63, P value <0.0001). n = 3 mice/condition (no lesion, all sham, 10 DPI LPC), n = 4 mice/group (7 DPI LPC), n = 5 mice/group (3 DPI LPC). f. HMOX1+ (magenta) GFAP+ astrocytes (green) (arrows) at 3 DPI. Hoechst in blue. Scale bar, 25 μm. g HMOX1 + GFAP+ cells/mm2 ± s.e.m.. Two-way ANOVA with Tukey´s multiple comparisons test, aP = 0.0377, bP = 0.0292, cP = 0.0280, dP = 0.0166. ANOVA summary (Interaction F(4,12) = 1.838, P value = 0.1864; Time F(2,12) = 4.66, P value = 0.0318; Condition F(2,6) = 3.08, P value = 0.1202). n = 3 mice/condition. h Top significantly engaged pathways at 7 DPI. Fisher’s exact test, P < 0.05. i Log2FC of cholesterol pathway genes at 7 DPI vs control. n = 3 mice/condition. ***P value = 0.0009, t = 5.098, two-tailed ratio paired t-test on expression. j Log2FC of cholesterol pathway genes at 7 DPI vs 3 DPI. n = 3 mice/condition.**P value = 0.0003, t = 6.164, two-tailed ratio paired t-test on expression. k HMGCS1+ (magenta) GFAP+ astrocytes (yellow)(arrows). Hoechst in cyan. Scale bar, 25 μm. l Mean HMGCS1 + GFAP+ cells/mm2 ± s.e.m.. Two-way ANOVA with Tukey´s multiple comparisons test, aP = 0.0276, bP = 0.0015. ANOVA summary (Interaction F(4,12) = 4.9575, P value = 0.0134; Time F(2,12) = 3.75, P value = 0.0543; Condition F(2,6) = 2.546, P value = 0.1582). n = 3 mice/condition. m FDPS+ (magenta) GFAP+ astrocytes (yellow)(arrows). Hoechst in cyan. Scale bar, 25 μm. n Mean FDPS + GFAP+ cells/mm2 ± s.e.m.. Two-way ANOVA with Tukey´s multiple comparisons test, aP = 0.0094, bP = 0.0155. ANOVA summary (Interaction F(4,12) = 1.838, P value = 0.1864; Time F(2,12) = 4.66, P value = 0.0318; Condition factor F(2,6) = 3.08, P value = 0.1202). n = 3 mice/condition. Source data is provided with this paper.
Fig. 3
Fig. 3. Astrocytic Nrf2 activation regulates oligodendrocyte survival and remyelination.
a GFAP-Nrf2 maintain Nrf2 pathway activation in astrocytes. b Mean FPKM values ± s.e.m. of Nrf2-target genes. two-tailed ratio paired t-test between wildtype and GFAP-Nrf2 mice in no-lesion conditions, P value = 0.0003, t = 8.809. n = 6 mice/condition (WT), n = 5 mice/condition (GFAP-Nrf2). c HMOX1+ (magenta) astrocytes (GFAP+) (arrows) in the non-lesioned corpus callosum. Hoechst in cyan. Scale bar, 25 μm. d Mean GFAP+ cells/mm2 ± s.e.m. Two-tailed Mann–Whitney test, wildtype (WT) vs GFAP-Nrf2 in no lesion P = 0.3810, two-tailed unpaired Student’s t-test with Welch’s correction, WT vs GFAP-Nrf2, 3 DPI P = 0.0089 t = 53.371, 7 DPI P = 0.0591 t = 3.711, 10 DPI P = 0.5754 t = 0.5791. n = 3 mice/group (GFAP-Nrf2 no lesion, Wildtype and GFAP-Nrf2 3 and 7 DPI LPC), n = 6 mice/group (Wildtype no lesion, Wildtype and GFAP-Nrf2 14 DPI). e GFAP+ astrocytes (yellow) in the lesioned corpus callosum (outlined). Scale bar, 100 μm. f HMGCS1+ (magenta) GFAP+ astrocytes (yellow)(arrows) in lesioned corpus callosum. Hoechst in cyan. Scale bar, 50 μm. g Mean HMGCS1 + GFAP+ cells/mm2 ± s.e.m.. Two-tailed unpaired Student’s t-test with Welch’s correction WT vs GFAP-Nrf2, 7 DPI P = 0.0482 t = 2.823, 14 DPI P = 0.3112 t = 1.1. n = 3 mice/condition (7 DPI), n = 4 mice/condition (14 DPI wildtype), n = 7 mice/condition (14 DPI GFAP-Nrf2). h Mean FDPS + GFAP+ cells/mm2 ± s.e.m. Two-tailed unpaired Student’s t-test with Welch’s correction WT vs GFAP-Nrf2, 7 DPI P = 0.0398 t = 3.179, 14 DPI P = 0.2842 t = 1.148. n = 3 mice/condition (7 DPI), n = 4 mice/condition (wildtype 14 DPI), n = 7 mice/condition (GFAP-Nrf2 14 DPI). i Mean percentage of GFAP+ cells positive for HMGCS1 ± s.e.m. Two-tailed unpaired Student’s t-test with Welch’s correction WT vs GFAP-Nrf2, 7 DPI P < 0.0001 t = 10.11, 14 DPI P = 0.1952 t = 1.469. n = 5 mice/condition (wildtype 7 DPI), n = 4 mice/condition (GFAP-Nrf2 7 DPI, wildtype 14 DPI), n = 6 mice/condition (GFAP-Nrf2 14 DPI). j MBP (magenta) in the corpus callosum (outlined). Scale bar; 100 μm. k Percentage MBP area ± s.e.m. Two-tailed unpaired Student’s t-test with Welch’s correction WT vs GFAP-Nrf2, no lesion P = 0.6985 t = 0.4244, 14 DPI P = 0.0225 t = 3.047, 21 DPI P = 0.0024 t = 9.212. n = 3 mice/condition (GFAP-Nrf2 no lesion, Wildtype 21 DPI LPC), n = 4 mice/condition (GFAP-Nrf2 21 DPI LPC), n = 5 mice/condition (GFAP-Nrf2 14 DPI LPC) n = 6 mice/condition (Wildtype no lesion, 14 DPI LPC). l Mean Olig2+ cells/mm2 ± s.e.m. Two-tailed unpaired Student’s t-test with Welch’s correction WT vs GFAP-Nrf2, no lesion P = 0.3603 t = 0.9591, 14 DPI P = 0.0204 t = 2.777. n = 6 mice/condition. m Mean CC1+Olig2+ cells/mm2 ± s.e.m. Two-tailed unpaired Student’s t-test with Welch’s correction WT vs GFAP-Nrf2, no lesion P = 0.4435 t = 0.865, 14 DPI P = 0.0425 t = 2.508. n = 6 mice/condition. n Proportion of Olig2+ cells that are CC1+ (green) or negative (magenta) ± s.e.m. n = 6 mice/condition. Two-way ANOVA with Bonferroni correction, WT vs GFAP-Nrf2; no lesion, CC1+Olig2+ P = 0.8323 CC1-Olig2+ P = 0.8322, two-way ANOVA summary (Interaction F(1,20) = 1.379, P value = 0.2541; Genotype F(1,20) = 3.171 × 10−9, P value >0.9999; Cell type F(1,20) = 242.9, P value <0.0001). 14 DPI, CC1+Olig2+ P = 0.6945 CC1-Olig2+ P = 0.6945, ANOVA summary (Interaction F(1,20) = 1.853, P value = 0.1885; Genotype F(1,20) = 0, P value >0.9999; Cell type F(1,20) = 14.81, P value = 0.0010). o Mean percentage of Olig2+ cells which are cleaved Caspase-3+ ± s.e.m., at 3 DPI, two-tailed Mann–Whitney test, P = 0.8857; at 7 DPI, two-tailed unpaired Student’s t-test with Welch’s correction P = 0.0044, t = 4.49. n = 4 mice/condition (3 DPI), n = 5 mice/condition (GFAP-Nrf2 7 DPI), n = 6 mice/condition (wildtype 7 DPI). Source data is provided with this paper. The image in 3a was created with Biorender.com.
Fig. 4
Fig. 4. Stimulating the cholesterol biosynthesis pathway rescues oligodendrocyte survival and remyelination when astrocytic Nrf2 activation is sustained.
a Proteomics of wildtype lesions at 7 DPI vs no lesion control (CT), represented as Log2FC of 7 DPI/CT. The two-tailed paired t-test between normalised intensities, P value = 0.0012, t = 5.228. n = 3 mice/condition. b Astrocyte-associated proteins in lesions at 7 DPI vs CT, represented as Log2FC. The two-tailed paired t-test between normalised intensities, P value = 0.0217, t = 3.291. n = 3 mice/condition. c Mean FPKM value ± s.e.m. of Abca1. DESeq2 Benjamini–Hochberg test, adjusted P value aP = 0.042. n = 3 mice/condition. d Percentage of GFAP+ cells expressing ABCA1 ± s.e.m. One-way ANOVA with Tukey´s multiple comparisons test; aP = 0.0237, bP = 0.0054, cP = 0.0245. ANOVA summary (F = 6.456 and P value = 0.0031). n = 3 mice/condition (no lesion), n = 4 mice/condition (3, 7, 14 DPI), n = 5 mice/condition (10 DPI). e Percentage of ABCA1+ cells expressing GFAP ± s.e.m. One-way ANOVA with Tukey´s multiple comparisons test; aP = 0.0126, bP = 0.0496. ANOVA summary (F = 9.985 and P value = 0.0004). n = 3 mice/condition (no lesion), n = 4 mice/condition (3, 7, 14 DPI), n = 5 mice/condition (10 DPI). f CS-6253 or PBS was administered daily to LPC-lesioned GFAP-Nrf2 mice from 7–14 DPI. g HMGCS1+ (magenta) astrocytes (GFAP+; yellow) (arrows). Hoechst in cyan. Scale bar, 25 μm. h Percentage of GFAP+ cells expressing HMGCS1 ± s.e.m., two-tailed Mann–Whitney test, aP = 0.0286. n = 4 mice/condition. i Mean Olig2+ cells/mm2 ± s.e.m., two-tailed unpaired Student’s t-test with Welch’s correction, aP = 0.0413, t = 2.61. n = 4 mice/condition. j Mean CC1+Olig2+ cells/mm2 ± s.e.m., two-tailed unpaired Student’s t-test with Welch’s correction, aP = 0.0432, t = 2.555. n = 4 mice/condition. k Proportion of Olig2+ cells which were CC1+ (green) or CC1- (magenta) ± s.e.m. Two-way ANOVA with Bonferroni correction PBS vs CS-6253, CC1+Olig2+ P value = 0.1597, CC1-Olig2+ P value = 0.1734. ANOVA summary (Interaction F(1,12) = 7.141, P value = 0.0203; Condition F(1,12) = 0.001127, P value = 0.9738; Cell type F(1,12) = 24.77, P value = 0.0003). n = 4 mice/group. l Oligodendrocyte lineage cells (Olig2+; yellow) which are mature (CC1+; magenta)(arrows). Hoechst in cyan. Scale bar, 50 μm. m Percentage of CC1+ cells expressing active caspase-3 (Ca3+) ± s.e.m., two-tailed unpaired Student’s t-test with Welch’s correction, aP = 0.0005, t = 6.007. n = 5 mice/condition (PBS) and n = 6 mice/condition (CS-6253). n Myelin basic protein (MBP; magenta) in corpus callosum lesions (outlined). Scale bar, 100 µm. o Percentage MBP area ± s.e.m., two2-tailed Mann–Whitney test, aP = 0.0260, n = 6 mice/condition. Source data is provided with this paper. The image in 4f was created with Biorender.com.
Fig. 5
Fig. 5. Astrocytes export cholesterol to oligodendrocytes to regulate their survival and remyelination.
a Primary astrocytes treatment plan and collection of astrocyte-conditioned media (ACM). b Nrf2+ (yellow) astrocytes (Aldh1l1+; magenta), with Hoechst in blue, following treatment with CDDOTFEA or CDDOTFEA, then Luteolin, or CDDOTFEA then CS-6253. Scale bar, 50 µm. c Mean percentage of astrocytes expressing nuclear Nrf2 ± s.e.m. One-way ANOVA and Tukey’s multiple comparisons test; aP = 0.0286, bP = 0.0085, cP = 0.0178. ANOVA summary P = 0.0023, F = 6.994. n = 6 independent litters (no treatment, CDDO, CDDO/Luteolin, CDDO/CS-6253). d Astrocyte expression of genes involved in cholesterol and Nrf2 signalling following CDDOTFEA treatment, represented as Log2FC over no treatment condition ± s.e.m. One-tailed Wilcoxon test for 2−ΔΔCt, P value = 0.0156. n = 4 independent litters (Nfe2l2, Gclc, Nqo1, Hmgcs1, Fdps) and n = 3 independent litters (Mvk, Fdft1). e Astrocyte expression of genes after CDDOTFEA treatment followed by Luteolin treatment, represented as Log2FC over CDDOTFEA condition ± s.e.m. Kolmogorov–Smirnov tests on 2−ΔΔCt, Hmgcs1 P = 0.0286. n = 4 independent litters (Hmgcs1, Fdps) and n = 3 independent litters (Mvk, Fdft1). f Astrocyte expression of genes after CDDOTFEA treatment followed by CS-6253 treatment, represented as Log2FC over CDDOTFEA condition ± s.e.m. Kolmogorov–Smirnov tests on 2−ΔΔCt, Hmgcs1 P = 0.0476, Fdps P = 0.0476, Mvk P = 0.0286. n = 4 independent litters (Hmgcs1, Fdps) and n = 3 independent litters (Mvk, Fdft1). g ACM applied to oligodendrocytes to track the uptake of Bodipy-FL-C12 exported from astrocytes. h Percentage of TPPP/p25+ cells cholesterol which are Bodipy+ ± s.e.m. Kruskal–Wallis test and Dunn’s multiple comparisons test, aP = 0.0561, bP = 0.0360. n = 4 independent litters. i Oligodendrocytes (TPPP/p25+ Sox10+; magenta/cyan) in unconditioned astrocyte media (AST) or following exposure to ACM, and uptake of Bodipy-FL-C12 (yellow). Hoechst in blue. Scale bar, 50 µm. j Immature oligodendrocyte lineage cells (Sox10+ TPPP/p25-) were Bodipy negative (arrows). Scale bar, 50 µm. k Mean percentage of TPPP/p25+ cells which are Tunel+ ± s.e.m., normalised to oligodendrocyte (OL) media control. Kruskal–Wallis test and Dunn’s multiple comparisons test, P value = 0.0349, aP = 0.0083, bP = 0.0265, cP = 0.0265. n = 4 independent litters. l Apoptotic (Tunel+; yellow) TPPP/p25+ Sox10+ oligodendrocytes (magenta/cyan), in OL media or AST control, or following exposure to ACM. Scale bar, 50 µm. m Brain explants myelinated for 14 days in vitro (DIV), were demyelinated with LPC, then fixed at 5 days post-LPC (dpl) when remyelination is initiated. n Remyelination index ± s.e.m. for AST: slice culture media (SC) control, or following exposure to ACM. Two-tailed unpaired Student’s t-test with Welch’s correction, aP = 0.0048, t = 4.842; bP = 0.0125, t = 3.723. n = 3 mice/condition (AST:SC media, SC media: ACM), n = 4 mice/condition (CDDO, CDDO+Luteolin, CDDO + CS-6253), n = 3 mice/condition (AST:SC media, ACM no treatment). o Explants exposed to AST or ACM from astrocytes following no treatment or exposure to CDDOTFEA, CDDOTFEA then Luteolin, and CDDOTFEA then CS-6253 stained for myelin basic protein (MBP; magenta) and neurofilament (NF; green). Scale bar, 50 µm. p Explants myelinated for 14 DIV, were demyelinated with LPC, then treated with the ABCA1 inhibitor PSC833 or vehicle control from 2 to 7 dpl when remyelination is underway. q Explants treated with vehicle control or PSC833 (5 µM) and stained for MBP (magenta) and neurofilament (NF; green). Scale bar, 50 µm. r Remyelination index ± s.e.m. for vehicle or PSC833-treated brain explants. One-way ANOVA with Tukey´s multiple comparisons test, aP = 0.0052, bP = 0.0026, cP = 0.0007. ANOVA summary (F = 17.11 and P value = 0.0008). n = 3 mice/condition. Source data is provided with this paper. The images in 5a, g, m, p were created with Biorender.com.
Fig. 6
Fig. 6. Astrocytic Nrf2 and cholesterol pathways are altered in chronic human brain lesions with poor remyelination potential and oligodendrocyte death.
a Nrf2+ (yellow) astrocytes (GFAP+; cyan) (arrows) with Hoechst in blue. Scale bar, 100 μm. b Mean percentage of GFAP+ cells which are NRF2+ ± s.e.m. in control (CT; n = 4), remyelinated (RM; n = 5), active (A; n = 7) and inactive lesions (I; n = 7) from multiple sclerosis (MS) cases. One-way ANOVA with Tukey’s multiple comparisons test; aP = 0.0008, bP = 0.0043, cP = 0.0007. ANOVA summary (F = 11.10, P value = 0.0002). c HMGCS1+ (magenta) astrocytes (GFAP+; cyan) (arrows) with Hoechst in blue. Scale bar, 100 μm. d Mean percentage of GFAP+ cells which are HMGCS1+ ± s.e.m. in CT (n = 3), RM (n = 7), A (n = 4) and I lesions (n = 11) from MS cases. Kruskal–Wallis and Dunn’s multiple comparisons test, aP = 0.0429, bP = 0.0113. KW summary (P value = 0.0009). e Active caspase-3+ (yellow) oligodendrocytes (TPPP/p25+; cyan, and Olig2+; magenta) (arrows) with Hoechst in blue. Scale bar, 100 µm. f Mean TPPP/p25+ Olig2+ cells/mm2 ± s.e.m. in CT (n = 3), remyelinated (RM; n = 5), active (A; n = 6) and inactive lesions (I; n = 7) from MS cases. Kruskal–Wallis with Dunn’s multiple comparisons test, P = 0.0284 I vs CT. KW summary (P = 0.0253). g Mean percentage of Olig2+ cells expressing active caspase-3 (Ca3+)/mm2 ± s.e.m. in CT (n = 3), RM (n = 5), A (n = 6) and I lesions (n = 7) from MS cases. Kruskal–Wallis test and Dunn’s multiple comparisons test, P = 0.0251 I vs R. KW summary (P = 0.0090). h Mean percentage of TPPP/p25+ Olig2+ cells expressing Ca3/mm2 ± s.e.m. in CT (n = 3), RM (n = 5), A (n = 6) and I lesions (n = 7) from MS cases. Kruskal–Wallis with Dunn’s multiple comparison test, P = 0.0264 I vs R. KW summary (P = 0.0097). Source data is provided with this paper.
Fig. 7
Fig. 7. Luteolin restores oligodendrocyte survival and remyelination when astrocytic Nrf2 is sustained.
a Luteolin or PBS was administered to LPC-lesioned GFAP-Nrf2 mice from 4–7 DPI. b Mean percentage of GFAP+ cells with nuclear NRF2 (NRF2nucl) ± s.e.m. Two-tailed unpaired Student’s t-test with Welch’s correction, P = 0.0075, t = 5.851. n = 4 mice/condition (PBS), n = 5 mice/condition (Luteolin). c Nrf2+ (magenta) astrocytes (GFAP+; yellow) (arrows) at 7 DPI. Hoechst in cyan. Scale bar, 50 μm. d Active caspase-3+ (magenta) astrocytes (GFAP+; yellow) (arrows) with Hoechst in cyan at 7 DPI. Scale bar, 50 µm. e Mean GFAP+ cells/mm2 ± s.e.m. Two-tailed unpaired Student’s t-test with Welch’s correction, P = 0.0001, t = 8.925. n = 4 mice/condition (PBS), n = 6 mice/condition (Luteolin). f Percentage of GFAP+ cells positive for active caspase-3 (Ca3)/mm2 ± s.e.m. Two-tailed unpaired Student’s t-test with Welch’s correction, P = 0.0831, t = 2.245. n = 5 mice/condition. g Mean HMGCS1 + GFAP+ cells/mm2 ± s.e.m. Two-tailed unpaired Student’s t-test with Welch’s correction, P = 0.0116, t = 3.642. n = 4 mice/condition (PBS), n = 5 mice/condition (Luteolin). h HMGCS1+ (magenta) GFAP+ astrocytes (yellow)(arrows) at 7 DPI. Hoechst in cyan. Scale bar, 50 μm. i Oligodendrocyte lineage cells (Olig2+; yellow) which are mature (CC1+; magenta)(arrows) at 7 DPI. Hoechst in cyan. Scale bar, 50 μm. j Mean Olig2+ cells/mm2 ± s.e.m., two-tailed unpaired Student’s t-test with Welch’s correction, P = 0.0253, t = 2.841. n = 3 mice/condition (PBS) and n = 6 mice/condition (Luteolin). k Mean CC1+Olig2+ cells/mm2 ± s.e.m., two-tailed unpaired Student’s t-test with Welch’s correction, P = 0.0260, t = 2.938. n = 3 mice/condition (PBS) and n = 5 mice/condition (Luteolin). l Proportion of Olig2+ cells which are CC1+ (green) or CC1− (magenta) ± s.e.m. Two-way ANOVA with Bonferroni correction, PBS vs Luteolin CC1+Olig2+ P = 0.0088, CC1-Olig2+ P = 0.0086. ANOVA summary (Interaction F(1,14) = 23.04, P = 0.0003; Condition F(1,14) = 4.67 × 10−5, P value = 0.9946; Cell type F(1,14) = 93.77, P < 0.0001). n = 3 mice/condition (PBS) and n = 6 mice/condition (Luteolin). m Mean percentage of Olig2+ cells which are active Ca3+ ± s.e.m, two-tailed unpaired Student’s t-test with Welch’s correction, P = 0.0009, t = 7.326. n = 3 mice/condition (PBS) and n = 5 mice/condition (Luteolin). n Active Caspase-3+ (magenta) oligodendrocyte lineage (Olig2+; yellow)(arrows). Hoechst in cyan. Scale bar, 50 μm. o Percentage MBP area ± s.e.m. Mann–Whitney test, P = 0.0357. n = 3 mice/condition (PBS) and n = 5 mice/condition (Luteolin). p MBP (magenta) at 7 DPI. Scale bar, 50 μm. Source data is provided with this paper. The image in 7a was created with Biorender.com.

References

    1. Franklin RJ, Ffrench-Constant C. Regenerating CNS myelin — from mechanisms to experimental medicines. Nat. Rev. Neurosci. 2017;18:17. doi: 10.1038/nrn.2017.136. - DOI - PubMed
    1. Heß K, et al. Lesion stage-dependent causes for impaired remyelination in MS. Acta Neuropathol. 2020;140:359–375. doi: 10.1007/s00401-020-02189-9. - DOI - PMC - PubMed
    1. Lubetzki C, Zalc B, Williams A, Stadelmann C, Stankoff B. Remyelination in multiple sclerosis: from basic science to clinical translation. Lancet Neurol. 2020;19:678–688. doi: 10.1016/S1474-4422(20)30140-X. - DOI - PubMed
    1. Wlodarczyk A, et al. A novel microglial subset plays a key role in myelinogenesis in developing brain. EMBO J. 2017;36:3292–3308. doi: 10.15252/embj.201696056. - DOI - PMC - PubMed
    1. Hagemeyer N, et al. Microglia contribute to normal myelinogenesis and to oligodendrocyte progenitor maintenance during adulthood. Acta Neuropathol. 2017;134:441–458. doi: 10.1007/s00401-017-1747-1. - DOI - PMC - PubMed

Publication types

LinkOut - more resources