Primary mouse myoblast metabotropic purinoceptor profiles and calcium signalling differ with their muscle origin and are altered in mdx dystrophinopathy
- PMID: 37291185
- PMCID: PMC10250391
- DOI: 10.1038/s41598-023-36545-y
Primary mouse myoblast metabotropic purinoceptor profiles and calcium signalling differ with their muscle origin and are altered in mdx dystrophinopathy
Abstract
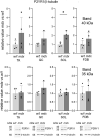
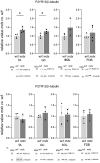
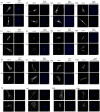
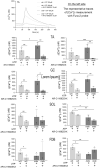
Mortality of Duchenne Muscular Dystrophy (DMD) is a consequence of progressive wasting of skeletal and cardiac muscle, where dystrophinopathy affects not only muscle fibres but also myogenic cells. Elevated activity of P2X7 receptors and increased store-operated calcium entry have been identified in myoblasts from the mdx mouse model of DMD. Moreover, in immortalized mdx myoblasts, increased metabotropic purinergic receptor response was found. Here, to exclude any potential effects of cell immortalization, we investigated the metabotropic response in primary mdx and wild-type myoblasts. Overall, analyses of receptor transcript and protein levels, antagonist sensitivity, and cellular localization in these primary myoblasts confirmed the previous data from immortalised cells. However, we identified significant differences in the pattern of expression and activity of P2Y receptors and the levels of the "calcium signalling toolkit" proteins between mdx and wild-type myoblasts isolated from different muscles. These results not only extend the earlier findings on the phenotypic effects of dystrophinopathy in undifferentiated muscle but, importantly, also reveal that these changes are muscle type-dependent and endure in isolated cells. This muscle-specific cellular impact of DMD may not be limited to the purinergic abnormality in mice and needs to be taken into consideration in human studies.
© 2023. The Author(s).
Conflict of interest statement
The authors declare no competing interests.
Figures




Similar articles
-
Dystrophic mdx mouse myoblasts exhibit elevated ATP/UTP-evoked metabotropic purinergic responses and alterations in calcium signalling.Biochim Biophys Acta Mol Basis Dis. 2019 Jun 1;1865(6):1138-1151. doi: 10.1016/j.bbadis.2019.01.002. Epub 2019 Jan 24. Biochim Biophys Acta Mol Basis Dis. 2019. PMID: 30684640
-
Store-operated calcium entry contributes to abnormal Ca²⁺ signalling in dystrophic mdx mouse myoblasts.Arch Biochem Biophys. 2015 Mar 1;569:1-9. doi: 10.1016/j.abb.2015.01.025. Epub 2015 Feb 4. Arch Biochem Biophys. 2015. PMID: 25659883
-
Investigating the Involvement of C-X-C Motif Chemokine 5 and P2X7 Purinoceptor in Ectopic Calcification in Mouse Models of Duchenne Muscular Dystrophy.J Cell Biochem. 2024 Aug;125(8):e30617. doi: 10.1002/jcb.30617. Epub 2024 Jun 25. J Cell Biochem. 2024. PMID: 38924558
-
Calcium and the damage pathways in muscular dystrophy.Can J Physiol Pharmacol. 2010 Feb;88(2):83-91. doi: 10.1139/Y09-058. Can J Physiol Pharmacol. 2010. PMID: 20237582 Review.
-
The Role of P2X7 Purinoceptors in the Pathogenesis and Treatment of Muscular Dystrophies.Int J Mol Sci. 2023 May 29;24(11):9434. doi: 10.3390/ijms24119434. Int J Mol Sci. 2023. PMID: 37298386 Free PMC article. Review.
Cited by
-
Cellular pathogenesis of Duchenne muscular dystrophy: progressive myofibre degeneration, chronic inflammation, reactive myofibrosis and satellite cell dysfunction.Eur J Transl Myol. 2023 Oct 16;33(4):11856. doi: 10.4081/ejtm.2023.11856. Eur J Transl Myol. 2023. PMID: 37846661 Free PMC article.
References
-
- Massouridès E, Polentes J, Mangeot P-E, Mournetas V, Nectoux J, Deburgrave N, Nusbaum P, Leturcq F, Popplewell L, Dickson G, Wein N, Flanigan KM, Peschanski M, Chelly J, Pinset, Dp412e: A novel human embryonic dystrophin isoform induced by BMP4 in early differentiated cells. Skelet. Muscle. 2015;5:40. doi: 10.1186/s13395-015-0062-6. - DOI - PMC - PubMed
Publication types
MeSH terms
Substances
LinkOut - more resources
Full Text Sources

