. 2023 Jun 8;14(1):3359.
doi: 10.1038/s41467-023-39104-1.

Pluripotency-independent induction of human trophoblast stem cells from fibroblasts

Affiliations

Pluripotency-independent induction of human trophoblast stem cells from fibroblasts

Moriyah Naama et al. Nat Commun. .

Abstract

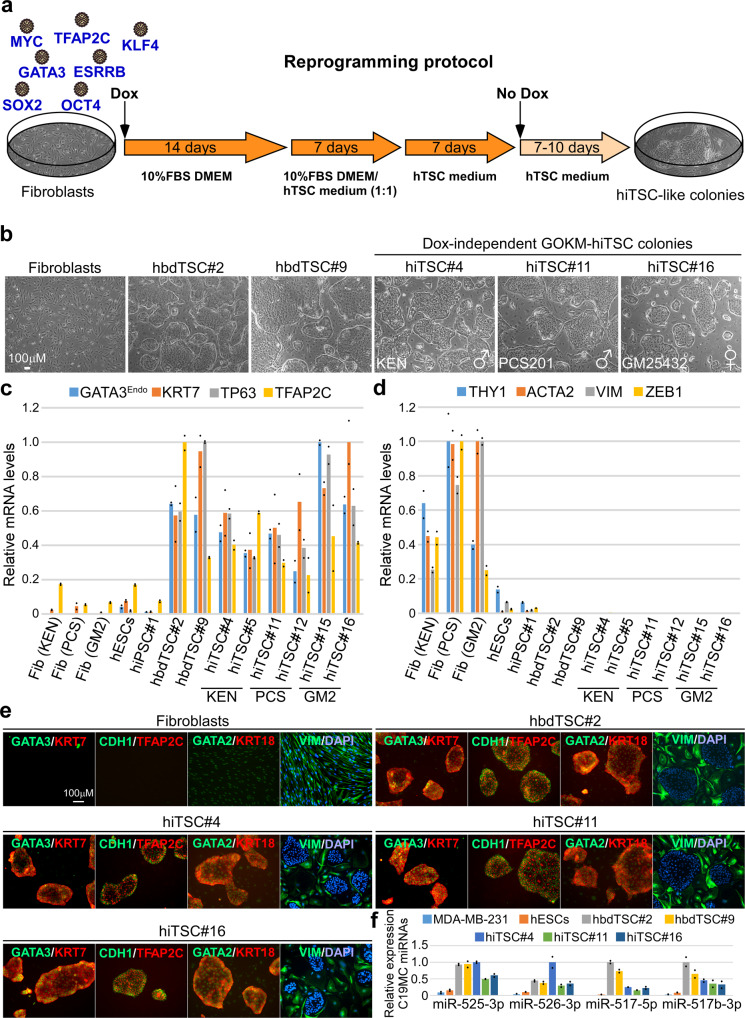
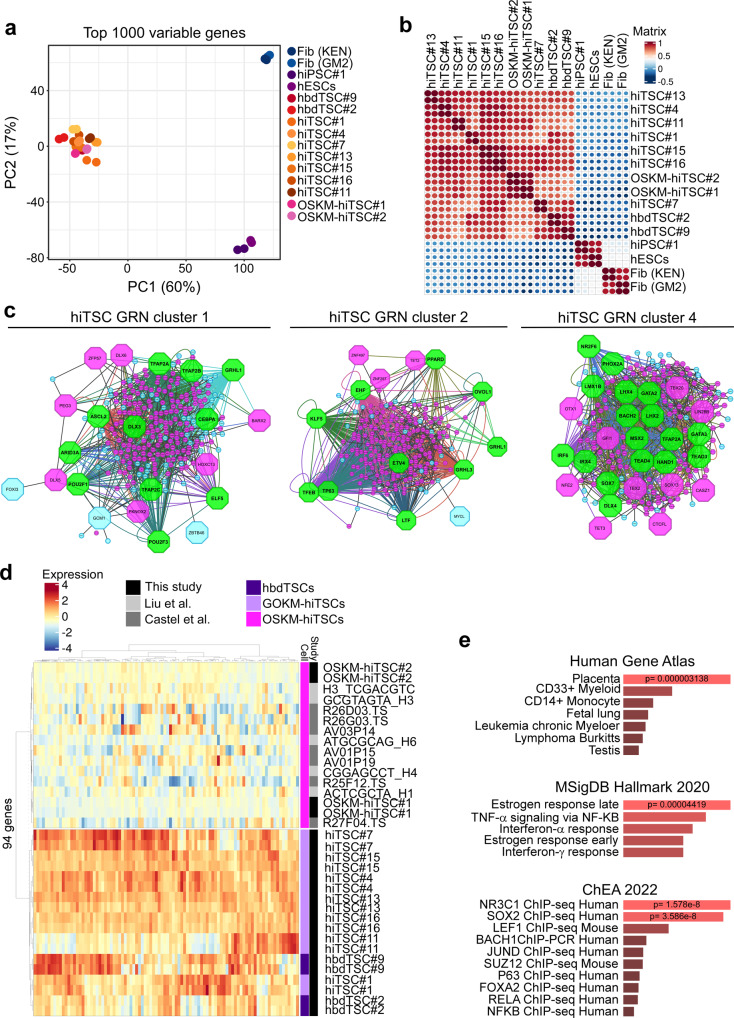
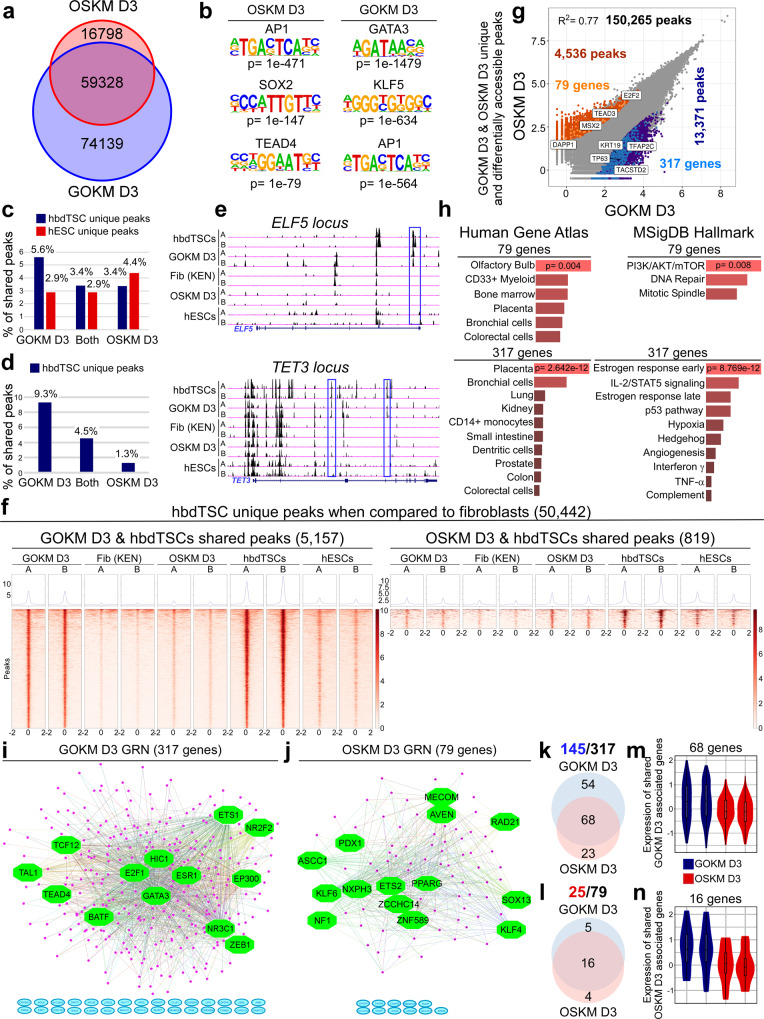
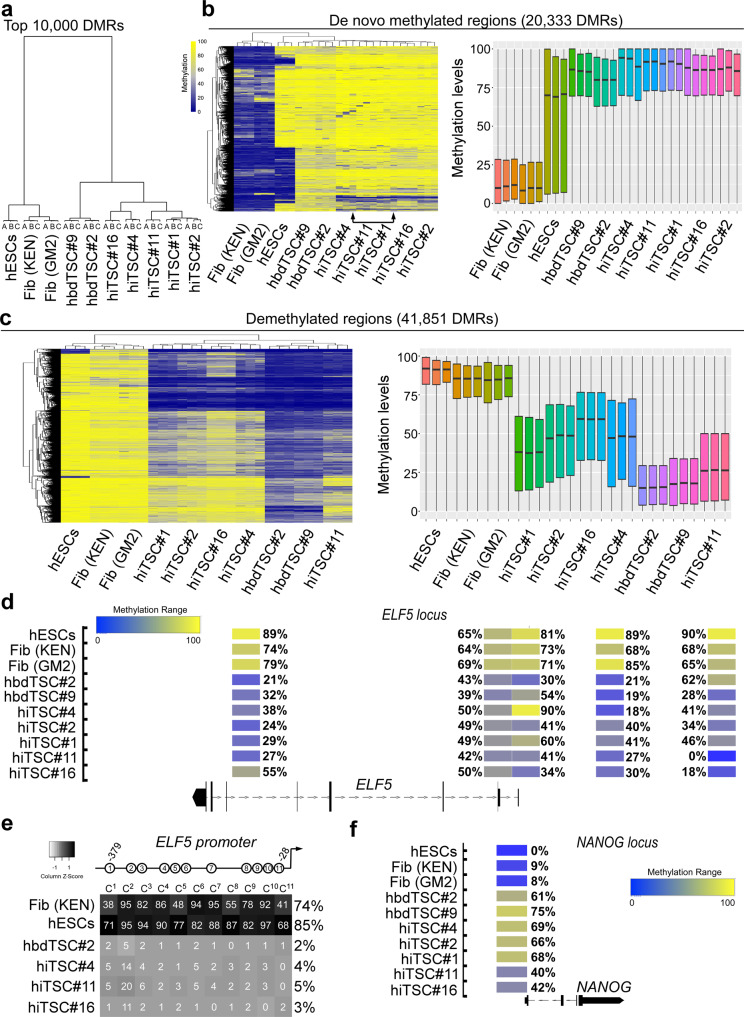
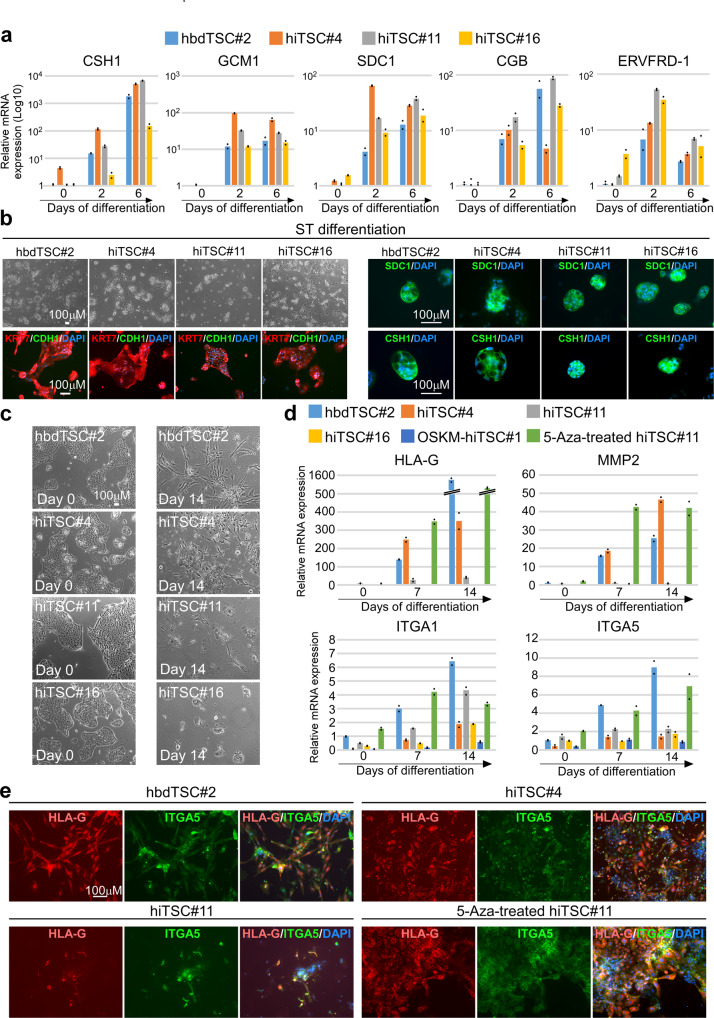
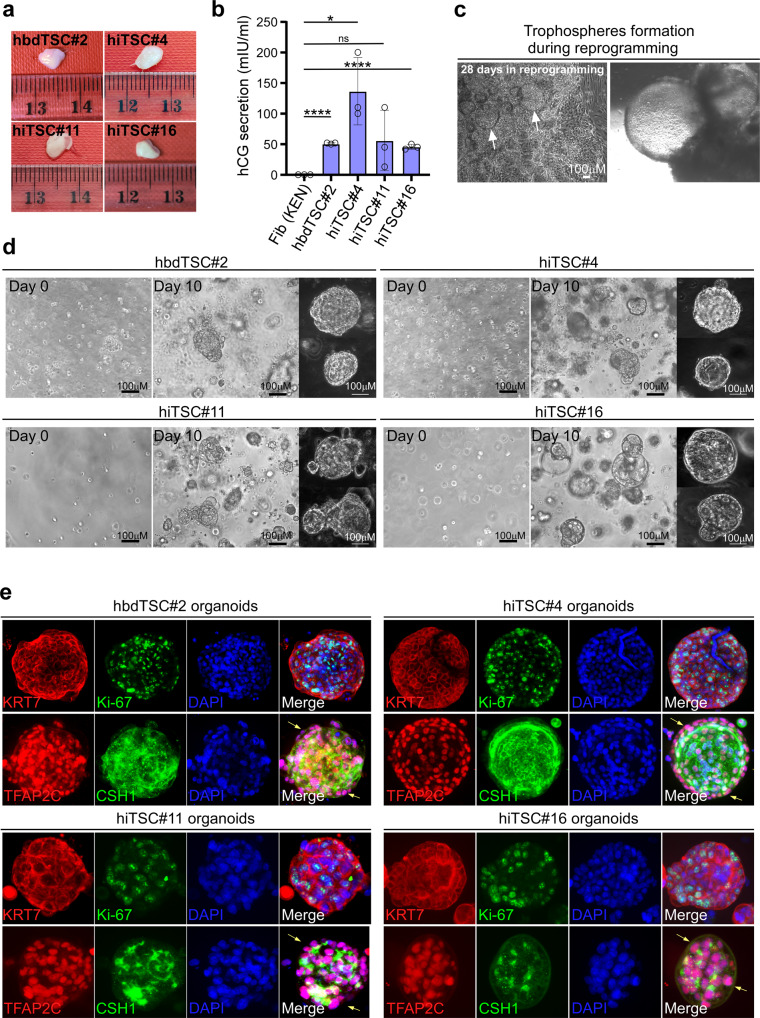
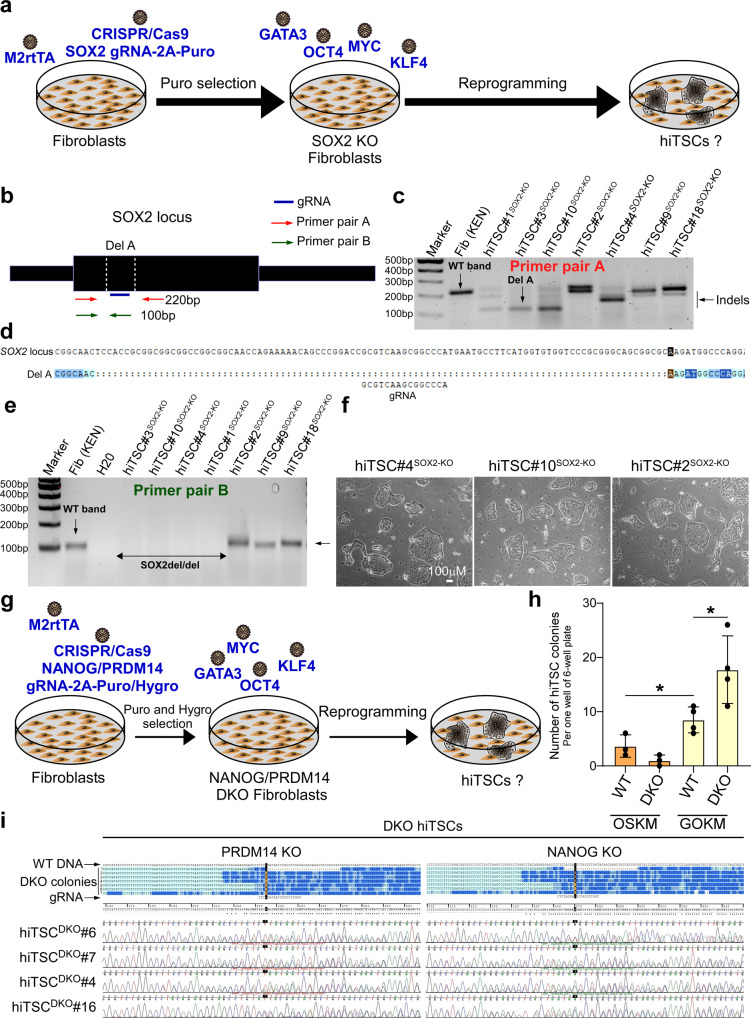
Human trophoblast stem cells (hTSCs) can be derived from embryonic stem cells (hESCs) or be induced from somatic cells by OCT4, SOX2, KLF4 and MYC (OSKM). Here we explore whether the hTSC state can be induced independently of pluripotency, and what are the mechanisms underlying its acquisition. We identify GATA3, OCT4, KLF4 and MYC (GOKM) as a combination of factors that can generate functional hiTSCs from fibroblasts. Transcriptomic analysis of stable GOKM- and OSKM-hiTSCs reveals 94 hTSC-specific genes that are aberrant specifically in OSKM-derived hiTSCs. Through time-course-RNA-seq analysis, H3K4me2 deposition and chromatin accessibility, we demonstrate that GOKM exert greater chromatin opening activity than OSKM. While GOKM primarily target hTSC-specific loci, OSKM mainly induce the hTSC state via targeting hESC and hTSC shared loci. Finally, we show that GOKM efficiently generate hiTSCs from fibroblasts that harbor knockout for pluripotency genes, further emphasizing that pluripotency is dispensable for hTSC state acquisition.


Conflict of interest statement

The authors declare no competing interests.

Figures

Fig. 1
Fig. 1. Ectopic expression of GATA3, OCT4, KLF4 and MYC (GOKM) convert human fibroblasts into trophoblast stem-like cells.
a Schematic representation of the protocol for reprogramming human fibroblasts into human induced trophoblast stem cells (hiTSCs). b Bright field images of human primary fibroblasts, two human blastocyst-derived TSC lines, hbdTSC#2 and hbdTSC#9, and three representative GOKM-derived hiTSC colonies (passage #8–11) originating either from KEN (foreskin fibroblasts, hiTSC#4), PCS201 (foreskin fibroblasts, hiTSC#11) or GM25432 (female adult fibroblasts, hiTSC#16) from three independent reprogramming experiments (n = 3). c, d qPCR analysis of mRNA levels for TSC-specific markers GATA3 (endogenous 5’ UTR expression), KRT7, TP63 and TFAP2C (c) and mesenchymal-specific markers THY1, ACTA2, VIM and ZEB1 (d) in six hiTSC colonies, two hbdTSC lines, three fibroblast lines, hESCs and iPSCs. The indicated hiTSC colonies were derived from three independent reprogramming experiments (n = 3). The highest sample for each gene was set to 1. Results were normalized to the mRNA levels of the housekeeping control gene GAPDH and are shown as fold change. For each sample two replicates were used (n = 2). e Immunofluorescence staining for TSC-specific markers GATA3, KRT7, TFAP2C, GATA2, epithelial markers CDH1 and KRT18, and the mesenchymal marker VIM in parental fibroblasts (KEN) and hbdTSC (hbdTSC#2) controls and in three independent (n = 3) hiTSC clones, hiTSC#4, hiTSC#11 and hiTSC#16. f qPCR analysis for the expression of C19MC miRNA cluster in the indicated samples. hiTSC colonies were derived from three independent reprogramming experiments (n = 3). The highest sample for each miR was set to 1. Results were normalized to the expression levels of the control miR 103a and are shown as fold change. For each sample two replicates were used (n = 2). See also Supplementary Fig. 1. Source data are provided as a Source Data file.
Fig. 2
Fig. 2. RNA-seq analysis indicates that GOKM-derived hiTSCs exhibit a transcriptome that is highly similar to that of hbdTSCs.
a, b Plots based on RNA-seq data portraying comparisons of whole transcriptome of two biological duplicates of two lines of parental fibroblasts (KEN and GM2), two pluripotent stem cell clones, hESCs and hiPSCs, two hbdTSC lines, hbdTSC#2 and hbdTSC#9, seven independent (n = 7) GOKM-derived hiTSC clones, hiTSC#1, hiTSC#4, hiTSC#7, hiTSC#11, hiTSC#13, hiTSC#15 and hiTSC#16, and two OSKM-derived hiTSC clones, OSKM-hiTSC#1 and OSKM-hiTSC#2. Principal component analysis (PCA) plot (a) constructed using the top 1000 variable genes, and correlation heatmap (b) of bulk RNA displaying the transcriptional similarity between hbdTSCs and hiTSCs and their dissimilarity from PSCs (ESCs and iPSCs) and fibroblasts (KEN and GM2). c Network analysis for top 2000 upregulated genes in hiTSCs vs. fibroblasts. Protein-protein interaction network was analyzed with STRING (http://www.string-db.org). The MCODE plugin tool in Cytoscape was used for further analysis of densely connected genes. For each subnetwork we used iRegulon plugin tool in Cytoscape to systematically analyze the composition of the gene promoters in transcription factor binding sites. d Heatmap and hierarchical clustering for 94 genes that were found to be differentially expressed in OSKM-derived hiTSCs (in our study and in other studies,) when compared to hbdTSCs and GOKM-derived hiTSC clones. Importantly, a reciprocal analysis searching for differentially expressed genes in GOKM-hiTSCs identified only one gene (SYK) that is aberrantly expressed in GOKM-hiTSCs. e Bar graphs showing the most enriched GO terms, and their p value, for the 94 genes from (d) using different GO term categories within EnrichR. p value was calculated using Fisher exact test. See also Supplementary Fig. 2. Source data are provided as a Source Data file.
Fig. 3
Fig. 3. GOKM and OSKM exhibit different chromatin accessibility.
a Venn diagram of day 3 GOKM and OSKM-unique peaks after subtracting “fibroblasts” peaks (FDR < 0.05). b HOMER motif analysis on “GOKM D3” and “OSKM D3”-differentially accessible peaks. p value was calculated using binomial distributions. c Graph summarizing the overlapping GOKM/OSKM-unique peaks with either hbdTSC/hESC-unique peaks as a percentage from the total GOKM/OSKM-unique peaks. d Graph summarizing the overlapping GOKM/OSKM-unique peaks with hbdTSC-unique peaks as a percentage from the total hbdTSC-unique peaks. e ATAC-seq signal at the ELF5 and TET3 loci. Blue rectangles mark “GOKM D3” and “hbdTSCs” shared peaks. f Heatmap of 5157 GOKM and the 819 OSKM-unique peaks that overlap with the 50,442 hbdTSC-unique peaks (FDR < 0.05). g Scatter plot of differentially accessible peaks between “GOKM D3” and “OSKM D3” (FDR < 0.05). Peaks that are exclusive to GOKM/OSKM are labeled with dark blue and dark orange, respectively. Peaks associated with hbdTSC-expressed genes are labeled with light blue (GOKM) and light orange (OSKM). h Bar graphs showing the most enriched GO terms, and their p value, for the 317 or 79 genes from (g) using EnrichR. p value was calculated using Fisher exact test. i, j Gene regulatory networks of 317 genes (i), and 79 genes (j) from (g) constructed by iRegulon plugin tool in Cytoscape. Transcription factor (FDR < 0.05), Network Enrichment Score (NES) > 2. Green represents key regulators, pink marks regulated genes and turquoise depicts genes with no association. k, i Venn diagrams showing the number of genes that are expressed in GOKM, OSKM or in both at day 3 among the 317 (k) or 79 genes (l). m, n Violin plots showing the expression level of the 66-shared genes (m) from the 145 genes (k) and the 16-shared genes (n) from the 25 genes (l) in day 3 GOKM and OSKM. Two biological replicates (n = 2) are used for each condition. The center line denotes the median (50th percentile), and box limits contain the dataset’s 25th to 75th percentiles. Black whiskers mark the 5th and 95th percentiles. See also Supplementary Figs. 3–5. Source data are provided as a Source Data file.
Fig. 4
Fig. 4. RRBS analysis demonstrates TSC-specific changes in methylation within hiTSCs.
DNA methylation analysis of three biological replicates (n = 3) of fibroblasts (KEN and GM2), hESCs, two hbdTSCs lines, and five hiTSC clones as assessed by RRBS. Analysis of CpG methylation ratio with sequencing depth of at least 10 reads per CpG was computed, based on 100 bp tiles. a Dendogram for top 10,000 differentially methylated regions (DMRs) across all samples. b (Left) Heatmap showing 20,333 DMRs that are hypomethylated in fibroblasts and hypermethylated in hbdTSCs with a methylation difference above 50%. b (right) Boxplot of DNA methylation level across 20,333 DMRs (n = 20,333) from (b, left) in the indicated bulk samples. For each sample three biologically independent replicates (n = 3) were analyzed. Boxes indicate 50% (25–75%) and whiskers (5–95%) of all measurements, with black lines depicting the medians. c (left) Heatmap showing 41,851 DMRs that are hypermethylated in fibroblasts and hypomethylated in hbdTSCs with a methylation difference above 50%. c (right) Boxplot of DNA methylation level across 41,851 DMRs (n = 41,851) from (c, left) in the indicated bulk samples. For each sample three biologically independent replicates (n = 3) were analyzed. Boxes indicate 50% (25–75%) and whiskers (5–95%) of all measurements, with black lines depicting the medians. d Integrated genome browser capture of the methylation levels of five tiles that reside within the ELF5 locus in hESCs, fibroblast (KEN and GM2), hbdTSCs (hbdTSC#2 and hbdTSC#9), and five hiTSC clones, as assessed by RRBS. e Heatmap depicting the average methylation levels of 11 CG within the proximal ELF5 promoter, in the indicated samples, as assessed by targeted bisulfite sequencing using MiSeq 2 × 150 bp paired end run. f Integrated genome browser capture of the methylation levels of one tile within the NANOG locus, in the indicated samples, as assessed by RRBS.
Fig. 5
Fig. 5. hiTSCs differentiate into multinucleated ST and EVT cells.
hbdTSC#2, hiTSC#4, hiTSC#11 and hiTSC#16 were induced to differentiate into STs using previously established protocol. a qPCR analysis of relative mRNA levels of ST-specific markers CSH1, GCM1, SDC1, CGB and ERVFRD-1, for the indicated samples, at days 0, 2 and 6 in medium for directed differentiation into STs (STM). Results were normalized to the mRNA levels of the housekeeping control gene GAPDH and are shown as Log base 10-fold change relative to day 0 control cells (hbdTSCs). For each sample two replicates were used (n = 2). hiTSC colonies were derived from three independent reprogramming experiments (n = 3). b Bright field images (left top) and fluorescent images for the pan-trophoblast marker KRT7 and the epithelial marker CDH1 (left bottom), or for the ST-specific markers SDC1 and CSH1 (right panel) following 6 days of directed differentiation to STs. DAPI staining was included to mark nuclei. Two and three dimensional multinucleated-positive cells are shown for three independent hiTSC clones (n = 3). c Bright field images of the indicated hbdTSC and three independent hiTSC clones (n = 3) at day 0 and following 14 days of EVT differentiation. d qPCR analysis of relative mRNA levels of EVT-specific markers HLA-G, MMP2, ITGA5 and ITGA1 at days 0, 7 and 14 of directed differentiation into EVTs. Results were normalized to the mRNA levels of the housekeeping control gene GAPDH and are shown as fold change relative to day 0 control cells (hbdTSCs). For each sample two replicates (n = 2) were used. Three independent hiTSC clones (n = 3) were assayed. e Immunofluorescence staining for the EVT-specific markers HLA-G and ITGA5 and DAPI in PFA-fixated hbdTSC#2, hiTSC#4, hiTSC#11, and 5-Aza-treated hiTSC#11 (n = 3) following 14 days of EVT differentiation. See also Supplementary Fig. 6. Source data are provided as a Source Data file.
Fig. 6
Fig. 6. hiTSCs form trophoblastic lesions in NOD/SCID mice and functional organoids in matrigel.
a Representative images of the lesions that were extracted from NOD/SCID mice following ~9 days of subcutaneous injection of ~4 × 106 cells from hbdTSC#2, hiTSC#4, hiTSC#11 and hiTSC#16 lines. Each line was injected into three NOD/SCID mice (n = 3). b Graph showing the concentration of hCG secretion in the serum of injected NOD/SCID male mice with the indicated cells. Approximately 500 μl of serum was collected from each mouse and used for hCG detection, using hCG ELISA kit (Alpco). Error bars indicate standard deviation between 3–4 independent experiments/replicates (n = 3 for hiTSCs and Fib (KEN), and n = 4 for hbdTSC#2). **** indicates p value < 0.0001 (95% confidence interval 47.59–53.41 for Fib (KEN) vs. hbdTSC#2 and 39.19–52.15 for Fib (KEN) vs. hiTSC#16), * indicates p value of 0.0127 (95% confidence interval 48.38–225.0), ns indicates not statistically significant, using two-tailed unpaired t-test calculated by GraphPad Prism (8.3.0). Mean values (from left to right) are: 0.000, 50.50, 136.7, 56.00, 45.67. c Bright field images of trophospheres within a reprogramming plate at day 28 of dox treatment following GOKM infection. d Bright field images of hbdTSC#2 and 3 independent hiTSC clones (hiTSC#4, hiTSC#11 and hiTSC#16, n = 3) at day 0 and 10 of organoid formation protocol. Note that by day 10 of the protocol, large and 3-dimantional organoid structures were generated in each clone. e Spinning disk confocal images of organoids from (d), following immunofluorescence staining for pan-trophoblast marker KRT7, proliferative cell marker Ki-67, TFAP2C and CSH1, with DAPI nuclear staining. Yellow arrows indicate areas of undifferentiated cells. See also Supplementary Fig. 7. Source data are provided as a Source Data file.
Fig. 7
Fig. 7. GOKM produce hiTSCs independently to SOX2 or PRDM14 and NANOG expression.
a Schematic representation for the strategy to generate and reprogram knockout (KO) SOX2 fibroblasts into hiTSCs. b Schematic representation of the SOX2 gene locus, displaying the location of the gRNA used, as well as the primer pairs designed to examine indels. c DNA gel showing a WT band of 219 bp within the SOX2 coding region in WT fibroblasts and the same PCR reaction in seven independent hiTSC clones (n = 7) from SOX2 KO fibroblasts. d Sequence alignment image of one indel event (i.e., Del A) within the SOX2 locus in hiTSC#3SOX2-KO using Sequencher software (demo version). e DNA gel showing a WT band of 100 bp within the SOX2 coding region in WT fibroblasts and the same PCR reaction in seven independent hiTSC clones (n = 7) from SOX2 KO fibroblasts. Note, 4 out of 7 colonies show a bi-allelic deletion within SOX2 coding region (SOX2del/del). f Bright field images of three SOX2 KO hiTSC colonies (n = 3). g Schematic representation for the strategy to double knockout (DKO) NANOG and PRDM14 in fibroblasts and reprogramming into hiTSCs. h Graph depicting the number of hiTSC colonies that emerged either in DKO fibroblasts or in WT controls following reprogramming with GOKM or OSKM. Error bars indicate standard deviation between 3–4 experiments/replicates (for OSKM n = 3 and for GOKM n = 4). * indicates p value of 0.0383 for OSKM WT vs. GOKM WT and 0.0324 for OSKM WT vs. GOKM WT (95% confidence interval of 0.3851–9.282 and 1.081–17.42, respectively), using two-tailed unpaired t-test calculated by GraphPad Prism (8.3.0). Mean values (from left to right) are: 3.667, 1.000, 8.500, 17.75. i Sequences alignment image of various indel events within the NANOG and PRDM14 loci in seven independent hiTSCDKO clones (n = 7) using Sequencher (Demo version). gRNA sequences and Sanger chromatograms are shown for 4 hiTSCDKO clones. Note that a significant enrichment for double KO events is evident in hiTSC clones that were derived from DKO fibroblasts. See also Supplementary Figs. 7–10. Source data are provided as a Source Data file.

References

    1. Okae H, et al. Derivation of human trophoblast stem cells. Cell Stem Cell. 2018;22:50–63.e6. doi: 10.1016/j.stem.2017.11.004. - DOI - PubMed
    1. Xu J, Du Y, Deng H. Direct lineage reprogramming: strategies, mechanisms, and applications. Cell Stem Cell. 2015;16:119–134. doi: 10.1016/j.stem.2015.01.013. - DOI - PubMed
    1. Castel G, et al. Induction of human trophoblast stem cells from somatic cells and pluripotent stem cells. Cell Rep. 2020;33:108419. doi: 10.1016/j.celrep.2020.108419. - DOI - PubMed
    1. Dong, C. et al. Derivation of trophoblast stem cells from naive human pluripotent stem cells. Elife910.7554/eLife.52504 (2020). - PMC - PubMed
    1. Cinkornpumin JK, et al. Naive human embryonic stem cells can give rise to cells with a trophoblast-like transcriptome and methylome. Stem Cell Rep. 2020;15:198–213. doi: 10.1016/j.stemcr.2020.06.003. - DOI - PMC - PubMed

Publication types