. 2023 Jun;55(6):1009-1021.
doi: 10.1038/s41588-023-01403-0. Epub 2023 Jun 8.

Somatic mutations of CADM1 in aldosterone-producing adenomas and gap junction-dependent regulation of aldosterone production

Affiliations

Somatic mutations of CADM1 in aldosterone-producing adenomas and gap junction-dependent regulation of aldosterone production

Xilin Wu et al. Nat Genet. 2023 Jun.

Abstract

Aldosterone-producing adenomas (APAs) are the commonest curable cause of hypertension. Most have gain-of-function somatic mutations of ion channels or transporters. Herein we report the discovery, replication and phenotype of mutations in the neuronal cell adhesion gene CADM1. Independent whole exome sequencing of 40 and 81 APAs found intramembranous p.Val380Asp or p.Gly379Asp variants in two patients whose hypertension and periodic primary aldosteronism were cured by adrenalectomy. Replication identified two more APAs with each variant (total, n = 6). The most upregulated gene (10- to 25-fold) in human adrenocortical H295R cells transduced with the mutations (compared to wildtype) was CYP11B2 (aldosterone synthase), and biological rhythms were the most differentially expressed process. CADM1 knockdown or mutation inhibited gap junction (GJ)-permeable dye transfer. GJ blockade by Gap27 increased CYP11B2 similarly to CADM1 mutation. Human adrenal zona glomerulosa (ZG) expression of GJA1 (the main GJ protein) was patchy, and annular GJs (sequelae of GJ communication) were less prominent in CYP11B2-positive micronodules than adjacent ZG. Somatic mutations of CADM1 cause reversible hypertension and reveal a role for GJ communication in suppressing physiological aldosterone production.


Conflict of interest statement

The authors declare no competing interests.

Figures

Fig. 1
Fig. 1. Discovery of CADM1 somatic mutations in APAs.
a, APA of patient P1 as seen on CT scan (yellow arrowhead) and in adrenal tissue (black arrowhead). The axial CT image of patient P1’s adrenal identified a 13 × 7 mm right adrenal nodule. Macroscopic view of 5-mm adrenal slices reveals the solitary adenoma. IHC imaging of CADM1-mutant APAs from patients P1–P5 are shown in Extended Data Figs. 1 and 2. b, Affected protein residues in the TM domain of CADM1. Protein sequence showing the mutations in adjacent amino acids. c, Sanger sequencing chromatograms of the two CADM1 somatic mutations found in APAs (P1–P5). The two somatic mutations in CADM1 translate to a p.Val380Asp (V380D) and p.Gly379Asp (G379D) mutant CADM1. The somatic mutations were found in neither the blood (of P2) nor the adjacent adrenal gland gDNA (of P1). cDNA sequence of APA from patient P1 suggests expression of both WT and mutant CADM1 protein in the adenoma.
Fig. 2
Fig. 2. CADM1 variants increase CYP11B2 expression and aldosterone production.
a, Transfection of EV, WT, G379D and V380D CADM1. Fluorescent images of HEK293 cells transfected with pLOC EV, WT or mutant CADM1 during the production of lentiviruses for transduction of CADM1 into H295R cells. Transfected cells expressed tGFP (green) present in the pLOC vector. Cells overexpressing WT CADM1 appeared in clusters, whereas a more uniform, monolayer distribution of cells was observed in cells overexpressing mutant CADM1 or EV. Scale bar, 400 μm. b, Silencing of CADM1 by shRNA. Western blot of H295R cells transduced with EGFP-tagged shRNA either nontargeting or targeting CADM1 (shCADM1). Immunoblotting was performed with anti-CADM1 (Sigma-Aldrich, S4945) and anti-GAPDH antibodies on the same blot. Immunoblots showed a reduction in CADM1 protein in shCADM1 transduced cells compared to nontargeting transduced cells with similar total protein (estimated by GAPDH expression). The experiment was repeated once independently with similar results. Full-length blots are provided as Source Data Fig. 2. ce, CADM1 mRNA expression (c), CYP11B2 mRNA expression (d) and aldosterone production (e), each in human adrenal cells overexpressing WT or mutant CADM1 or silenced for CADM1. Transduction of CADM1 (G379D or V380D) as its short (442 amino acids) or long (453 amino acids) isoform increased CYP11B2 (encoding aldosterone synthase) and aldosterone production. No effect was seen with overexpression of WT CADM1, whereas a decrease in CYP11B2 expression and aldosterone production was seen with silencing CADM1 (shCADM1). All values are expressed as fold change relative to EV or nontargeting control cells. Data are presented as mean values ±s.e.m. n = 3 independent wells. Statistical analysis was performed using one-way ANOVA followed by Dunnett’s multiple comparisons test for overexpression experiments. For CADM1 mRNA expression, F = 49.00, P < 0.0001; for CYP11B2, F = 158.4, P < 0.0001; for aldosterone, F = 149.0, P < 0.0001. Two-sided Student’s t-test was performed on silencing experiments. When compared to WT or shCADM1, *P = 0.0130, **P = 0.0029, ***P = 0.0003, ****P < 0.0001. NS, not significantly different between WT and mutant CADM1. The statistics used to produce these plots are provided as Source Data Fig. 2. UT, untransduced cells. Source data
Fig. 3
Fig. 3. Mutant CADM1 affects protein structure leading to changes in intercellular distance.
a, CADM1 variants have shorter α-CTF. Western blot of H295R cell lysates transfected with WT or mutant CADM1 (G379D or V380D) in a pCX4bsr vector using a custom-made anti-CADM1 C-terminal antibody. Shown are the protein bands for glycosylated full-length CADM1 (~100 kDa) and α-CTF CADM1 (15–20 kDa). Complete immunoblot for CADM1 is shown in Supplementary Fig. 2b. Total protein was estimated by immunoblotting β-actin. The experiment was repeated twice independently with similar results. Full blots are provided as Source Data Fig. 3. b, ADAM10/γ-secretase-mediated cleavage of CADM1. Schematic representation of the CADM1 protein. Ectodomain shedding due to cleavage by proteases can result in the formation of intracellular CTF and secreted NTF. Cleavage by the protease ADAM10 after the O-glycosylation site leads to the formation of α-CTF (blue scissors), whereas cleavage before the O-glycosylation site leads to β-CTF. The CTF can undergo further cleavage by γ-secretase (purple scissors) to release an intracellular domain. Glycosylation sites (N- and O-) are shown in brown. The 4.1- and PDZ-binding motifs are shown in orange and blue, respectively. Ig, Immunoglobulin domain. Schematic adapted from refs. ,. c, Change in angle of the TM helix in mutant CADM1 can result in shorter α-CTF. Schematic diagram showing that the fixed distance that ADAM10 cleaves CADM1 from the cell membrane (dashed blue line with scissors) and an increase in the angle of the TM helix in mutant CADM1 could result in a shorter length of cleaved α-CTF. d, Predicted changes in TM helix in mutant CADM1 compared to WT. Effect of the CADM1 variants on angle and length of the TM helix in the cell membrane lipid bilayer as predicted by protein modeling data. The 3D structures of the TM domain (residues, A375–L395) of WT, G379D mutant and V380D mutant CADM1 were analyzed by using QUARK program (https://zhanggroup.org/QUARK/). e, Predicted structural consequences of mutant CADM1 on intercellular distance. Schematic representation of change in angle resulting in an increase in intercellular distance in mutant cells. Source data
Fig. 4
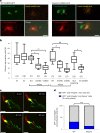
Fig. 4. CADM1 variants inhibit GJ communication.
a, GJ-mediated communication as detected by a GJ-permeable dye. H295R cells were transfected with either WT or mutant CADM1-GFP vectors. A single transfected cell (red arrowhead) was then injected with the GJ-impermeable dye (WGA) and the GJ-permeable dye (calcein red). Representative images of cells with the 442-amino acid isoform of CADM1 1-h post-dye injection are shown. Image is representative of 11 independent experiments. Representative images at 0 h are shown in Supplementary Fig. 3a. Scale bar, 20 μm. b, GJ-mediated communication reduced in cells expressing mutant CADM1. Quantification of the experiment performed in a. The percentage of calcein red-containing cells within a 50-μm radius from an injected cell (green nucleus, marked by orange WGA dye in the cytoplasm) was calculated per total number of cells within the radius. There were up to twofold fewer red cells around a CADM1 variant transfected cell compared to WT transfected cells. Center line represents the median. Upper and lower bounds of box represent interquartile range. Upper and lower whiskers represent maximum and minimum values in the range, respectively. Statistical analysis was performed using one-way ANOVA (F = 20.68, P < 0.0001) and Sidak’s multiple comparison test. *P = 0.028, **P < 0.0001, #P = 0.0120, ##P < 0.0001, P < 0.0001. The number (n) of dye-injected cells per experimental group is shown in parentheses. c, GJ plaque formation (yellow) detected using GJA1-mApple (red) and GJA1-Venus (green). Time-lapse imaging of cocultured H295R cells transfected with either GJA1 tagged with mApple (red) or GJA1 tagged with Venus (green) was performed to study GJ plaque formation. The four serial frames illustrate GJA1-mApple and GJA1-Venus colocalizing (yellow), indicating GJ plaque formation. Internalization of plaque (formation of an annular GJ) is highlighted by white arrowheads (pre-internalization) and red arrowheads (postinternalization). Scale bar, 9 μm. d, GJ plaque formation reduced in cells expressing mutant CADM1. Quantification of GJ formation in H295R cells cotransfected with GJA1-mApple and either WT (n = 212) or mutant CADM1 (mutant, n = 291) vectors tagged with GFP. GJ communication was detected by internalization of GJA1-Venus in cells coexpressing GJA1-mApple and GFP, shown as a percentage of mApple and GFP expressing cells. Statistical analysis was performed using two-sided Fisher’s exact test. ***P = 0.000205; 95% CI, 1.423–3.147. The statistics used to produce these plots are provided as Source Data Fig. 4. CI, confidence interval. WGA, wheat germ agglutinin. Source data
Fig. 5
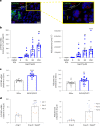
Fig. 5. Inhibition of GJ communication increases aldosterone production.
a, GJA1 expressed in subcapsular non-ZF cells. Human adrenal section stained with mouse anti-CYP17A1 (green) and rabbit anti-GJA1 (red) antibodies. AGJ (yellow arrowhead) is present in subcapsular cells not expressing the ZF marker CYP17A1. This region immunostain for DAB2 but not for CYP11B2 (white box in Supplementary Fig. 6a). Dashed line demarcates border with capsule. Left image, ×63 magnification; right image, ×100 magnification. b, Connexin mimetic peptide Gap27 increases CYP11B2 expression and aldosterone production in Ang II-stimulated H295R cells. CYP11B2 (n = 10) and aldosterone (n = 12 except for 250 μM Gap27, n = 11) are increased in stimulated H295R cells treated with Gap27, which selectively blocks GJ communications. Results expressed as fold change relative to cells treated with 0 μM Gap27. The effect of Gap27 on unstimulated cells is shown in Supplementary Fig. 8a. Ten percent dimethyl sulfoxide (DMSO 10%) treatment on unstimulated cells (n = 8) was used as control for enhanced cell membrane permeability. Statistical significance measured using the Kruskal–Wallis H test; CYP11B2, χ2(4) = 43.03, P = 1.02 × 10−8 and aldosterone, χ2(4) = 42.25, P = 1.48 × 10−8, respectively. Post hoc testing was performed using Dunn’s multiple comparison test (compared to 0 μM Gap27). For CYP11B2, #P = 0.0039, ##P = 0.002. For aldosterone, *P = 0.0310, ***P = 0.0005, ****P < 0.0001. c, Silencing of GJ increases CYP11B2 expression and aldosterone production. CYP11B2 (n = 10) and aldosterone (n = 17) is increased in H295R cells with decreased GJ communications due to cosilencing of the genes GJA1 and GJC1 (SiGJA1/GJC1) compared to the silenced scramble RNA control (SiScr). GJA1 and GJC1 mRNA and protein expression is shown in Supplementary Fig. 8e,f. Results expressed as fold change relative to SiScr cells. Statistical analysis performed using two-sided Student’s t-test. **P = 0.0097, ****P < 0.0001. d, Gap27 increases CYP11B2 expression and aldosterone production in Ang II-stimulated primary adrenal cells. CYP11B2 (n = 10) and aldosterone (n = 10) are increased in stimulated primary adrenal cells treated with Gap27. Effect of Gap27 in unstimulated primary adrenal cells is shown in Supplementary Fig. 8g. mRNA expression was normalized by β-actin. Results expressed as fold change relative to Ang II-stimulated cells. Statistical analysis was performed using two-sided Student’s t-test. ****P = 0.0005, *P = 0.0438. Data are presented as mean ± s.e.m. n = biological independent replicates from three independent experiments. The statistics used to produce these plots are provided as Source Data Fig. 5. Source data
Fig. 6
Fig. 6. CADM1 variants affect genes associated with the ‘biological rhythms’ process.
a, Heatmap of differentially expressed genes in CADM1-mutant cells. Heatmap of differentially expressed genes in H295R cells transduced with EV, WT (442- and 453-amino acid isoforms), mutant CADM1 (V380D and G379D in both isoforms) or untransduced (UT). The columns represent different conditions (in triplicates) in the transduction experiments as labeled in b. Each row represents a gene whose mean expression was either upregulated >1.5-fold or downregulated <0.7-fold in variant transduced cells, compared to WT (two-sided one-way ANOVA P < 0.001). Centroid clustering was performed using cluster 3. Yellow represents upregulation and blue represents downregulation of genes as specified by color bar in b. The full heatmap is provided as Source Data Fig. 6. b, Zoomed image of heatmap in a displaying top 36 genes and clusters including genes associated with ‘biological rhythms’ process and GJA1. The top 36 genes were differentially regulated whether unstimulated (left half of heatmap) or stimulated by Ang II (right half, 10 nM for 24 h). However, for genes associated with ‘biological rhythms’ (highlight by bracket with arrow), the differential regulation was more apparent when the transduced cells were stimulated by Ang II. To note, transduction of H295R cells with both G379D and V380D mutant CADM1 substantially increased GJA1 mRNA expression in both isoforms. Genes of interest that are mentioned in the main text are arrowed. c, Genes associated with ‘biological rhythms’ process were differentially regulated in CADM1-mutant cells. RNA-seq of mutant CADM1-transduced cells reveals the most upregulated process associated with the 425 differentially expressed genes was ‘biological rhythms’. Clock genes associated with E-box factors and RORE target genes are highlighted by brackets. Graph shows the fold change of mRNA expression relative to UT cells for genes associated with this process in WT and mutant CADM1 (453-amino acid isoforms). Source data
Extended Data Fig. 1
Extended Data Fig. 1. Characteristics of CADM1 V380D mutant APA.
a, Hematoxylin and eosin staining of CADM1 V380D mutant APA (P1). Low and high power views of hematoxylin and eosin staining in APA of P1 displaying compact cells and numerous spironolactone bodies (black arrows). b,c, Immunohistochemistry for CYP11B2 (b) and CADM1 (c) in CADM1 V380D mutant APA (P1). CADM1 is highly expressed in the APA (red box) and adjacent aldosterone-producing micronodules (APM, blue box), with membranous staining also seen in the medulla. The magnified area of the red box shows the border between adrenal medulla and APA, whereas the blue box shows CADM1 peri-capsular staining of the outer cortex. Scale bar as indicated on image.
Extended Data Fig. 2
Extended Data Fig. 2. Characteristics of CADM1 G379D mutant APAs.
a,b, Immunohistochemistry for CYP11B2 and CYP11B1 in CADM1 G379D mutant APAs. Staining of CYP11B2 (a) and CYP11B1 (b) was inversed (strong CYP11B2 staining in APA with faint CYP11B1). A similar pattern was seen with CADM1 V380D mutant APAs. c, Immunohistochemistry for CADM1 in CADM1 G379D mutant APAs (P2, P4, and P5). Cross-sectional scans and zoomed images of CADM1 staining of APA from patients P2, P4, and P5. Again as seen with CADM1 V380D mutant APAs (Extended Data Fig. 1c), the CADM1 protein appears membranous and is most highly expressed in the outer cortex and adenoma. Scale bar as indicated on image.
Extended Data Fig. 3
Extended Data Fig. 3. GJA1 expression in human adrenals.
a, GJA1 cDNA expression in laser capture microdissected (LCM) zona glomerulosa (ZG) samples. Left, selective cresyl violet staining of ZG for LCM RNA sample extraction. The capsule (C), zona fasciculata (ZF), and zona reticularis (ZR) do not retain the cresyl violet dye. Right, PCR of cDNA from LCM ZG and ZF RNA samples. HepG2 cells were used as a negative control as they do not express GJA1. ZF LCM samples had 5.45-fold higher expression of GJA1 cDNA than ZG LCM samples. Full-length gels are provided as Source Data Extended Data Fig. 3. b, Immunohistochemical GJA1 staining in the absence and presence of the antigen peptide. Adrenal sections from patient P1 were immunostained with GJA1 antibody (C6219, Sigma-Aldrich) in the absence or presence of the competing antigen peptide. Comparison of the serial sections show true staining of GJA1 protein in ZG/pericapsular adrenal cells, although less than ZF cells. Identification of adrenal zones were based on IHC for ZG and ZF markers shown in Supplementary Fig. 4c. Source data
Extended Data Fig. 4
Extended Data Fig. 4. Different cellular expression of GJA1.
a, Zona fasciculata (ZF) staining of GJA1 in regions of CYP17A1 positive (+ve) cells. Membranous GJA1 staining (anti-GJA1, HPA035097, Sigma-Aldrich) in ZF, on IHC (left) and immunofluorescence (IFC, right). These cells far from the capsule of the adrenal cortex were positive for CYP17A1 (image of CYP17A1 shown in Extended Data Fig. 2e). Nuclei of cells were stained with either hematoxylin (IHC) or DAPI (IFC, blue). Puncta staining detected by IFC similar to that seen with IHC is highlighted by white arrows. b, Zona glomerulosa (ZG) staining of GJA1 in regions of CYP17A1 negative (-ve) cells. Punctate staining of GJA1 (anti-GJA1, HPA035097, Sigma-Aldrich) at sites of ZG cell contacts, on IHC (left) and IFC (right). These cells adjacent to the capsule (C) were negative for CYP17A1. Nuclei of cells were stained with either hematoxylin (IHC) or DAPI (IFC, blue). Puncta staining detected by IFC similar to that seen with IHC is highlighted by white arrows.
Extended Data Fig. 5
Extended Data Fig. 5. GJA1 expression in peri-capsular cells expressing VSNL1 (ZG marker) co-localizes with wheat germ agglutinin (WGA; cell membrane marker).
IFC staining of CYP17A1, VSNL1 (a ZG marker), and GJA1 was performed on serial sections from an adrenal harboring an APA. IFC staining color-coded as indicated in image. A no primary (1°) antibody control was performed to take into account autofluorescence that occurs in the region. GJA1 punctate expression, annular GJ (white arrow), and GJ plaque (yellow arrow) co-localizes with WGA in VSNL1 positive (+ve) cells. Left, scans of the serial sections. Right, zoomed image within boxed regions in scans. Bottom, image of the CYP17A1 positive cells shown in Extended Data Fig. 4.
Extended Data Fig. 6
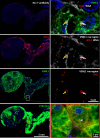
Extended Data Fig. 6. Presence of annular GJA1 in APM regions (CYP11B2-expressing cells).
IFC staining of CYP11B2 and GJA1 was performed on serial sections of the same adrenal shown in Extended Data Fig. 5. IFC staining is color-coded as indicated in image. GJA1 expression in APM regions was lower compared to adjacent adrenal cortex. Annular GJs (red arrows) were present in APM. Top, scan of the serial adrenal section; Bottom, zoomed images of ZF region and APM regions highlighted in scan.
Extended Data Fig. 7
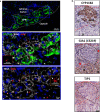
Extended Data Fig. 7. GJA1 and TJP1 expression is decreased in CYP11B2-expressing ZG cells.
a, APM regions (CYP11B2-expressing cells) have less GJA1 expression on cell membrane. IFC staining of WGA (white), CYP11B2 (green), and GJA1 (red) in an adrenal harboring an APA. Reduced membranous expression of GJA1 and a few annular GJs (red arrows) are seen in CYP11B2-positive cells (red box insert). Linear gap junction plaques (orange box insert) with budding annular GJs (white arrows) can be seen where WGA and GJA1 co-localize (orange staining). b, TJP1 expression is also decreased in APM compared to adjacent ZG. IHC for CYP11B2, GJA1, and TJP1 in adrenal sections from patient P1. IHC for GJA1 was performed using the same antibody as in Extended Data Fig. 2b. GJA1 and TJP1, another cell junction protein, had decreased expression in APM (demarcated by black dashed lines) compared to adjacent ZG (demarcated by the red dashed lines). Membranous GJA1 staining in ZF and punctate GJA1 staining in ZG are highlighted by black and red arrows, respectively.
Extended Data Fig. 8
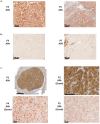
Extended Data Fig. 8. Heterogeneous subcellular expression of AQP2 in CADM1-mutant APAs.
IHC for APQ2 was performed on a positive control tissue section (from a human kidney) and on adrenal tissue sections containing APA of P1 (top right), APA of P4 (bottom left), and APA of P5 (bottom right). Selective membranous staining (black arrows) was seen in the collecting ducts of the human kidney, whereas using the same parameters, APA of P1 had solitary cytoplasmic bodies staining with AQP2 (red arrows), while APAs of P4 and P5 had apparent cytoplasmic staining (blue arrows).
Extended Data Fig. 9
Extended Data Fig. 9. AQP2 expression in adrenal cells treated with Gap27 or transduced with mutant CADM1.
a, AQP2 mRNA expression in primary human adrenal cells treated with Gap27 in the presence or absence of angiotensin II (Ang II). AQP2 mRNA expression of cells from Fig. 5d and Supplementary Fig. 7g is shown. mRNA expression for primary adrenal cells was normalized by β-actin. Fold change was expressed relative to Ang II-stimulated cells (left) or untreated cells (right) for each adrenal (n = 10). Data represent mean, error bars show s.e.m. Statistical analysis was performed using two-sided Student’s t-test. AQP2 expression was significantly increased in stimulated cells treated with Gap27 (***P = 0.0002) but not in unstimulated cells (P = 0.730). b, AQP2 mRNA expression in cells transduced with wild-type (WT) or mutant CADM1 (V380D or G379D). Transduction of mutant CADM1 (both mutants in 442aa and 453aa isoforms) increased AQP2 mRNA expression compared to wild-type in Angiotensin II (Ang II) stimulated H295R cells (n = 6). This trend was also seen in unstimulated cells. All values expressed as average fold-change of both isoforms (3 independent wells each) relative to untransduced cells. Data represent mean, error bars show s.e.m. Statistical significance between groups were measured using the two-sided Kruskal-Wallis H test; Unstimulated, χ2(2) = 7.362, P = 0.0177 and Ang II-stimulated, χ2(2) = 8.592, P = 0.0076, respectively. Post-hoc analysis performed using Dunn’s multiple comparison test, compared to WT. AQP2 mRNA expression was significantly increased in unstimulated V380D (*P = 0.0138) and stimulated G379D (**P = 0.0335) and V380D (***P = 0.0155) cells. n = biological independent replicates from 3 independent experiments. The underlying statistics are provided as Source Data Extended Data Fig. 9. Source data

References

    1. Funder JW, et al. The management of primary aldosteronism: case detection, diagnosis, and treatment: an Endocrine Society Clinical Practice Guideline. J. Clin. Endocrinol. Metab. 2016;101:1889–1916. - PubMed
    1. Nanba K, et al. Targeted molecular characterization of aldosterone-producing adenomas in White Americans. J. Clin. Endocrinol. Metab. 2018;103:3869–3876. - PMC - PubMed
    1. De Sousa K, et al. Genetic, cellular, and molecular heterogeneity in adrenals with aldosterone-producing adenoma. Hypertension. 2020;75:1034–1044. - PMC - PubMed
    1. Nanba K, et al. Genetic characteristics of aldosterone-producing adenomas in Blacks. Hypertension. 2019;73:885–892. - PMC - PubMed
    1. Choi M, et al. K+ channel mutations in adrenal aldosterone-producing adenomas and hereditary hypertension. Science. 2011;331:768–772. - PMC - PubMed

Publication types