. 2023 Jun;55(6):973-983.
doi: 10.1038/s41588-023-01408-9. Epub 2023 Jun 8.

Genome-wide association study and functional characterization identifies candidate genes for insulin-stimulated glucose uptake

Alice Williamson  1   2 Dougall M Norris  2 Xianyong Yin  3   4   5 K Alaine Broadaway  6 Anne H Moxley  6 Swarooparani Vadlamudi  6 Emma P Wilson  6 Anne U Jackson  3   4 Vasudha Ahuja  7 Mette K Andersen  8 Zorayr Arzumanyan  9 Lori L Bonnycastle  10 Stefan R Bornstein  11   12   13 Maxi P Bretschneider  11   12   13 Thomas A Buchanan  14 Yi-Cheng Chang  15   16   17 Lee-Ming Chuang  18 Ren-Hua Chung  19 Tine D Clausen  20   21 Peter Damm  21   22   23 Graciela E Delgado  24 Vanessa D de Mello  25 Josée Dupuis  26   27 Om P Dwivedi  7 Michael R Erdos  10 Lilian Fernandes Silva  28 Timothy M Frayling  29 Christian Gieger  13   30 Mark O Goodarzi  31 Xiuqing Guo  9 Stefan Gustafsson  32 Liisa Hakaste  7 Ulf Hammar  33 Gad Hatem  34 Sandra Herrmann  12   35 Kurt Højlund  36 Katrin Horn  37   38 Willa A Hsueh  39 Yi-Jen Hung  40 Chii-Min Hwu  41 Anna Jonsson  8 Line L Kårhus  42 Marcus E Kleber  25   43 Peter Kovacs  44 Timo A Lakka  45   46   47 Marie Lauzon  48 I-Te Lee  49   50   51 Cecilia M Lindgren  52   53   54   55 Jaana Lindström  56 Allan Linneberg  21   42 Ching-Ti Liu  26 Jian'an Luan  1 Dina Mansour Aly  34 Elisabeth Mathiesen  21   22   57 Angela P Moissl  25   58   59 Andrew P Morris  60 Narisu Narisu  10 Nikolaos Perakakis  11   12   13 Annette Peters  13   30 Rashmi B Prasad  7   34 Roman N Rodionov  61   62 Kathryn Roll  63 Carsten F Rundsten  8 Chloé Sarnowski  64 Kai Savonen  47 Markus Scholz  37   38 Sapna Sharma  65   66 Sara E Stinson  8 Sufyan Suleman  8 Jingyi Tan  9 Kent D Taylor  9 Matti Uusitupa  67 Dorte Vistisen  68   69 Daniel R Witte  70   71 Romy Walther  12   72 Peitao Wu  26 Anny H Xiang  73 Björn Zethelius  74 Meta-Analysis of Glucose and Insulin-related Traits Consortium (MAGIC)Emma Ahlqvist  34 Richard N Bergman  75 Yii-Der Ida Chen  48 Francis S Collins  10 Tove Fall  33 Jose C Florez  76   77   78 Andreas Fritsche  79 Harald Grallert  13   30   65 Leif Groop  7   80 Torben Hansen  8 Heikki A Koistinen  81   82   83 Pirjo Komulainen  47 Markku Laakso  28 Lars Lind  32 Markus Loeffler  37   38 Winfried März  24   84 James B Meigs  79   80   85 Leslie J Raffel  86 Rainer Rauramaa  47 Jerome I Rotter  87 Peter E H Schwarz  12   13   35 Michael Stumvoll  44 Johan Sundström  32 Anke Tönjes  44 Tiinamaija Tuomi  7   88 Jaakko Tuomilehto  89   90   91 Robert Wagner  79 Inês Barroso  92 Mark Walker  93 Niels Grarup  8 Michael Boehnke  3   4 Nicholas J Wareham  1 Karen L Mohlke  94 Eleanor Wheeler  95 Stephen O'Rahilly  96 Daniel J Fazakerley  97 Claudia Langenberg  98   99   100
Collaborators, Affiliations

Genome-wide association study and functional characterization identifies candidate genes for insulin-stimulated glucose uptake

Alice Williamson et al. Nat Genet. 2023 Jun.

Abstract

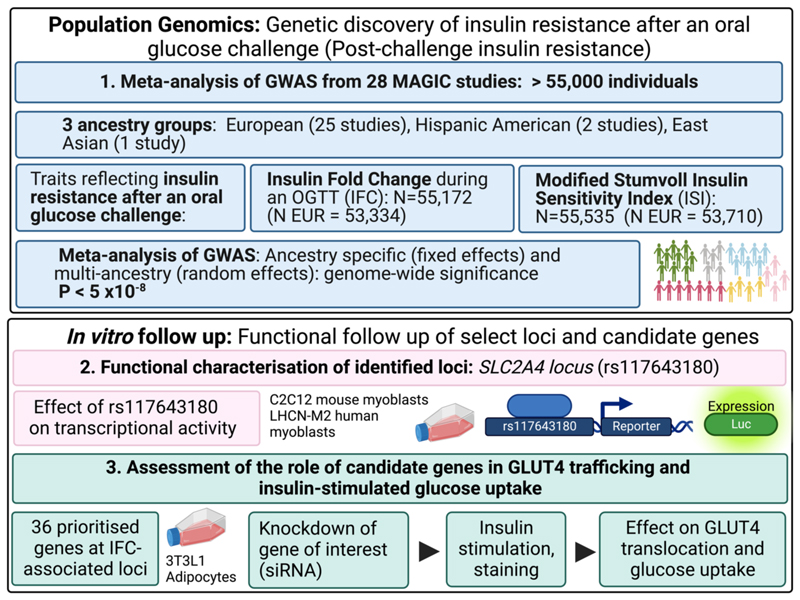
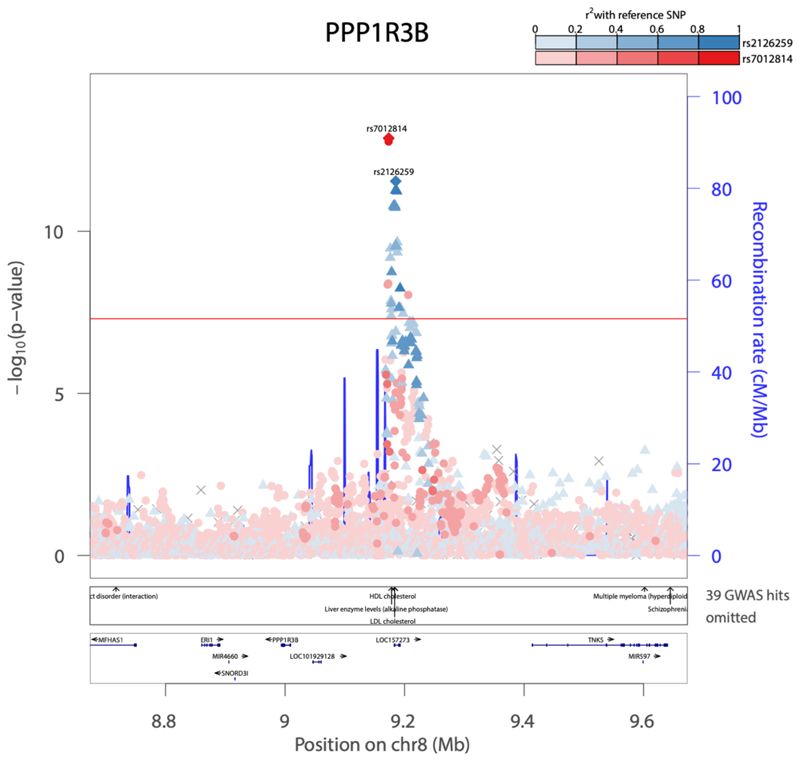
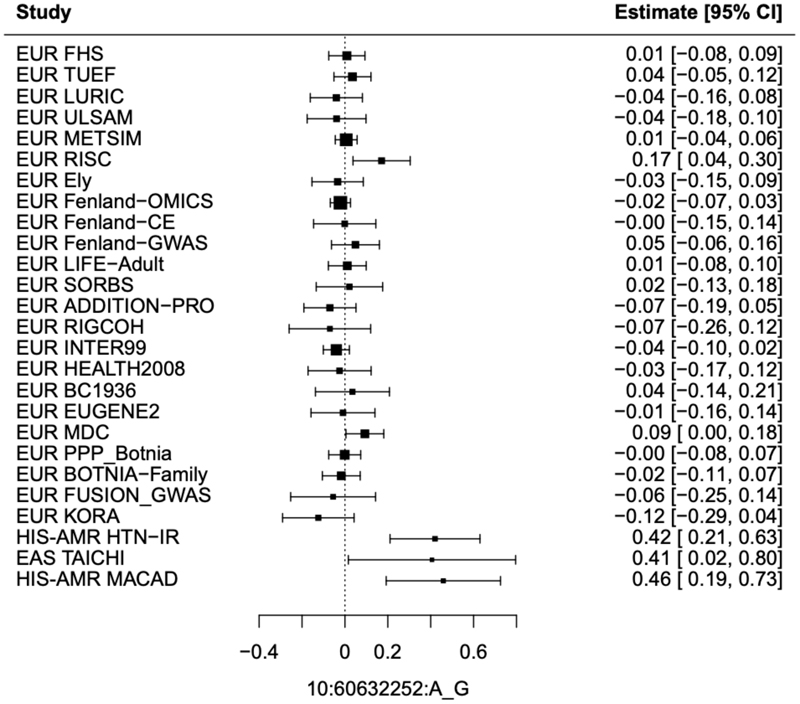
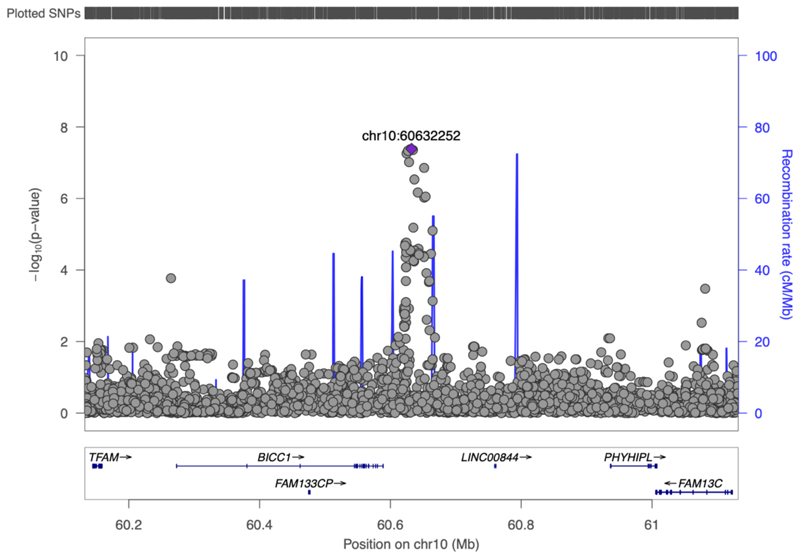
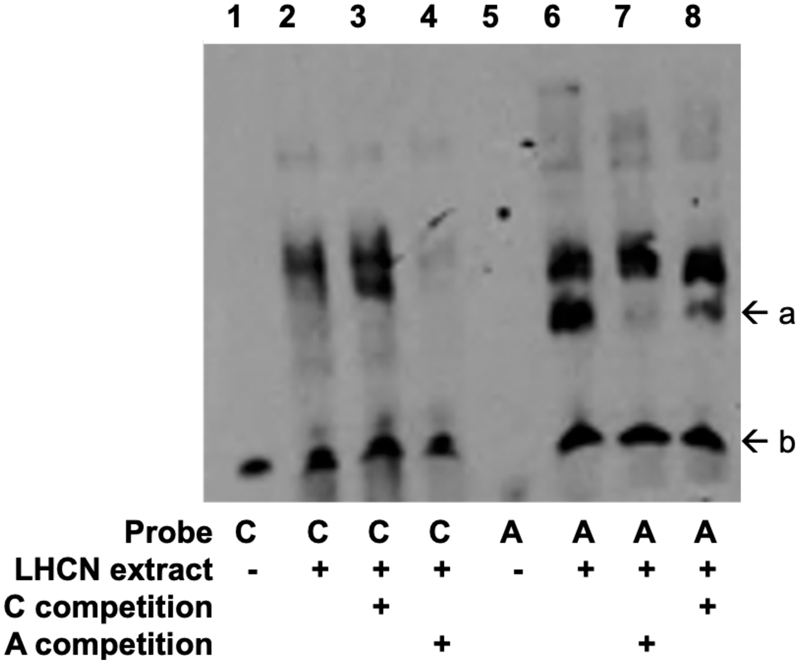
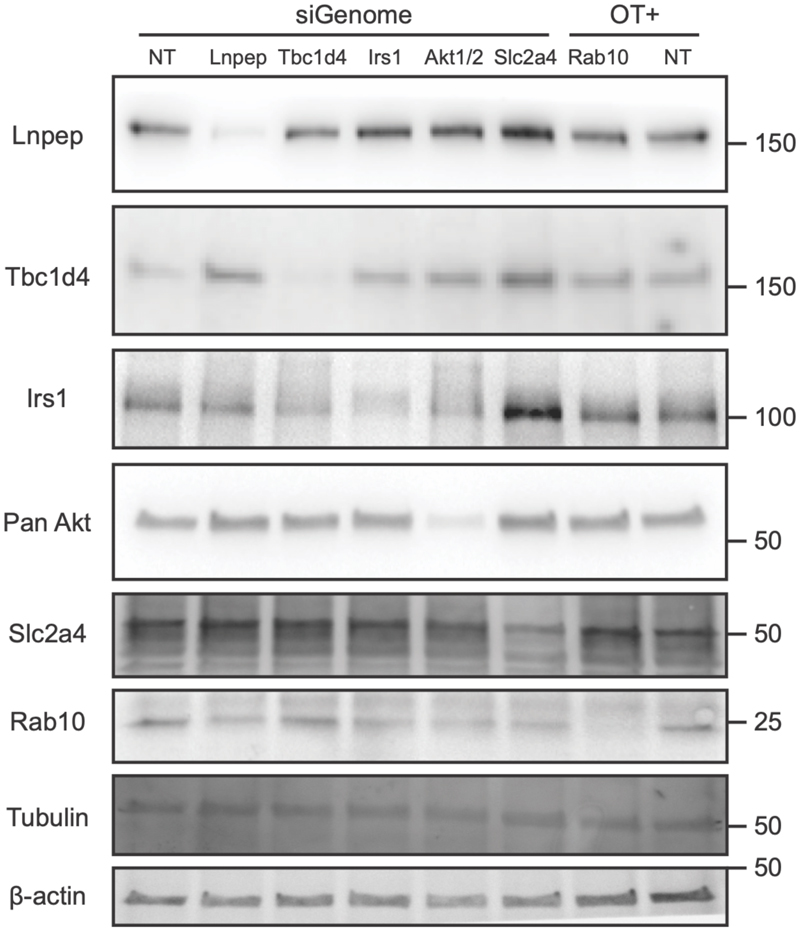
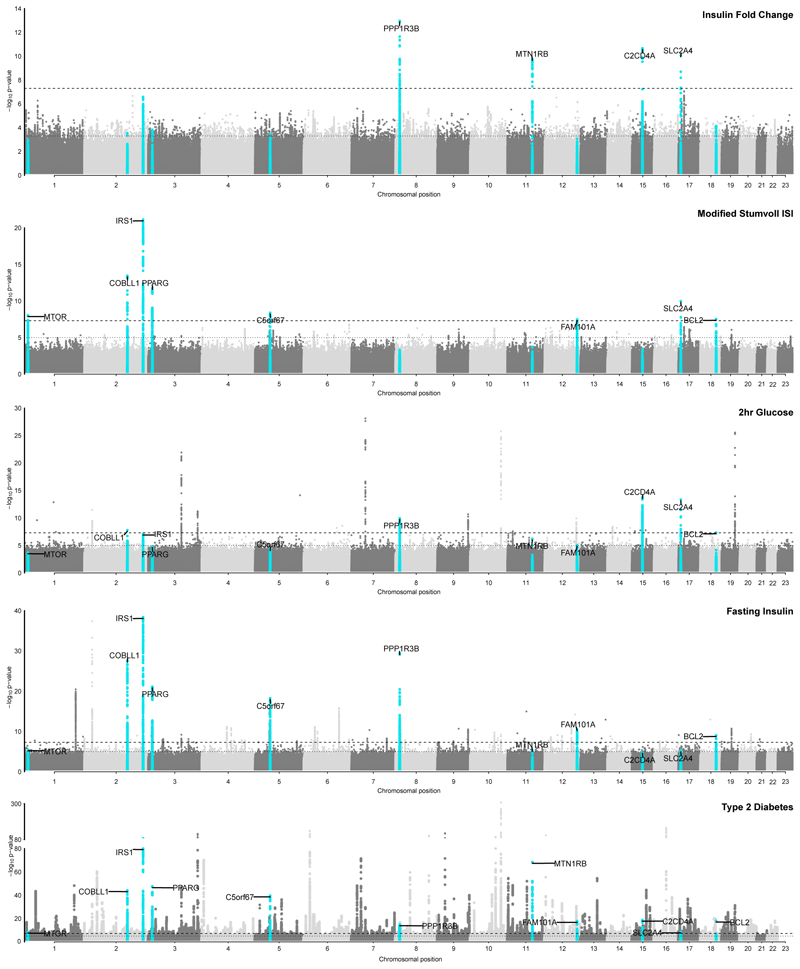
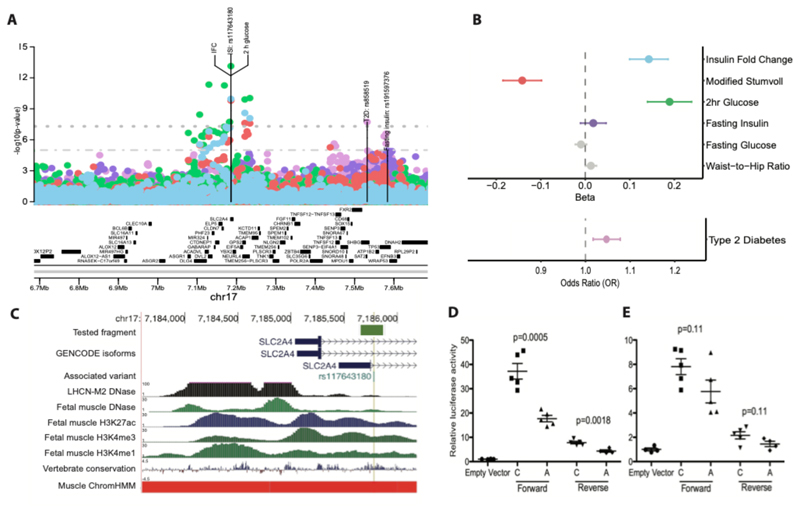
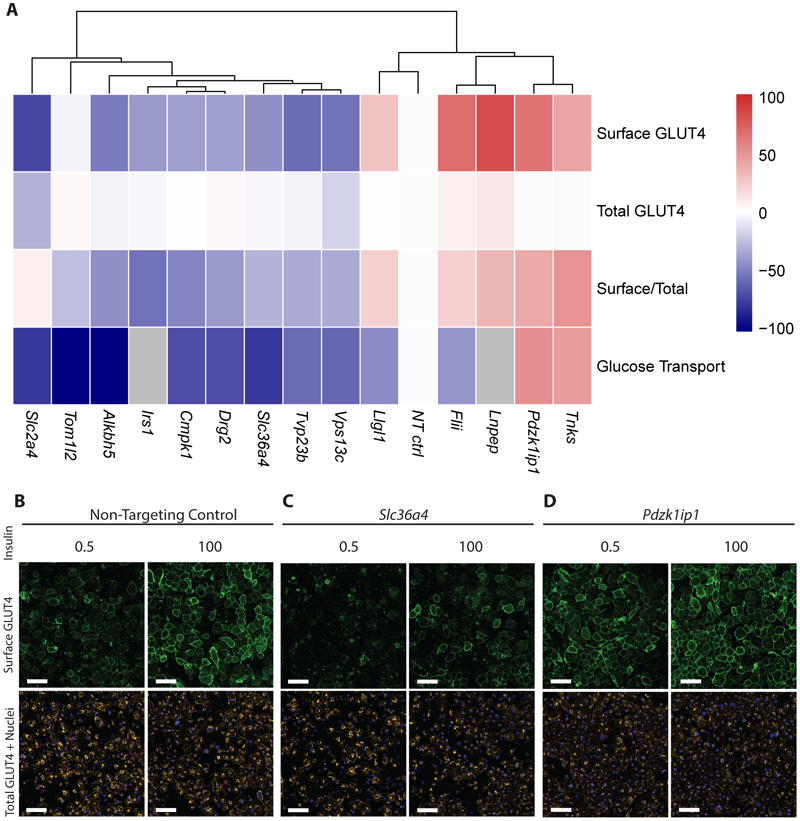
Distinct tissue-specific mechanisms mediate insulin action in fasting and postprandial states. Previous genetic studies have largely focused on insulin resistance in the fasting state, where hepatic insulin action dominates. Here we studied genetic variants influencing insulin levels measured 2 h after a glucose challenge in >55,000 participants from three ancestry groups. We identified ten new loci (P < 5 × 10⁻⁸) not previously associated with postchallenge insulin resistance, eight of which were shown to share their genetic architecture with type 2 diabetes in colocalization analyses. We investigated candidate genes at a subset of associated loci in cultured cells and identified nine candidate genes newly implicated in the expression or trafficking of GLUT4, the key glucose transporter in postprandial glucose uptake in muscle and fat. By focusing on postprandial insulin resistance, we highlighted the mechanisms of action at type 2 diabetes loci that are not adequately captured by studies of fasting glycemic traits.


Conflict of interest statement

Competing Interests

I Barroso: IB and spouse declare stock ownership in GlaxoSmithkline, Incyte Ltd and Inivata Ltd. J.C. Florez: Consulting honoraria from Goldfinch Bio and AstraZeneca; speaker honoraria from Novo Nordisk, AstraZeneca and Merck for research lectures over which I had full control on content. M.E. Kleber: Employed by SYNLAB Holding Deutschland GmbH. C. Lindgren: CL receives grants from Bayer Ag & Novo Nordisk and her Husband works for Vertex. W. März: reports grants and personal fees from Siemens Diagnostics, grants and personal fees from Aegerion Pharmaceuticals, grants and personal fees from AMGEN, grants and personal fees from Astrazeneca, grants and personal fees from Danone Research, grants and personal fees from Sanofi, personal fees from Hoffmann LaRoche, personal fees from MSD, grants and personal fees from Pfizer, personal fees from Synageva, grants and personal fees from BASF, grants from Abbott Diagnostics, grants and personal fees from Numares, outside the submitted work. W. März is employed by Synlab Holding Deutschland GmbH. J.B. Meigs: Academic Associate for Quest Diagnostics. S. O'Rahilly: S.O. has undertaken remunerated consultancy work for Pfizer, AstraZeneca, GSK and ERX Pharmaceuticals.N. Parakakis: Nikolaos Perakakis reports consulting honoraria from Bayer Vital GmbH and speaker honoraria from Novo Nordisk. J. Sundström: Shareholder in Anagram kommunikation AB and Symptoms Europe AB, outside of the present study. D. Vistisen: DV has received research grants from Bayer A/S, Sanofi, Novo Nordisk A/S and Boehringer Ingelheim. DV holds shares in Novo Nordisk A/S. E. Wheeler: EW is now an employee of AstraZeneca. B. Zethelius: Björn Zethelius is employed at the Swedish Medical Products Agency, SE-751 03 Uppsala, Sweden. The views expressed in this paper are the personal views of the authors and not necessarily the views of the Swedish government agency. All other authors declare no competing interests.

Figures

Extended Data Figure 1
Extended Data Figure 1. Overview of genetic discovery for insulin fold change and Modified Stumvoll ISI, and downstream genetic and in vitro studies.
Created with BioRender.com.
Extended Data Figure 2
Extended Data Figure 2. Observational Correlation of Insulin Fold Change and Modified Stumvoll ISI with metabolic traits in the Fenland Study.
Pairwise Spearman’s Rank correlation. Red shades denote positive correlation, blue shared denote negative correlation between trait pairs. X denotes no significant correlation (P > 0.05).
Extended Data Figure 3
Extended Data Figure 3. Observational Correlation of insulin sensitivity and clearance related traits in the RISC study.
Pairwise Spearman’s Rank correlation. Red shades denote positive correlation, blue shared denote negative correlation between trait pairs, legend along bottom of heatmap shows colour scale relative to rho value. X denotes no significant correlation (P > 0.05). Abbreviations denote: IFC_OGTT – IFC calculated using OGTT measures, ISI_OGTT – Modified Stumvoll ISI calculated using OGTT measures. M_I – M/I index of insulin sensitivity measured by clamp. InsC0c – insulin measured at 0min during clamp. InsO0c - insulin measured at 0min during OGTT. InsC120c – insulin measured at 120min during clamp. InsO120c - insulin measured at 120min during OGTT. InsC_20c – insulin measured at 20min before clamp. EGP_B -basal glucose production, EGP_SS - glucose production during clamp, GCR_B - basal glucose clearance, ml/min/kg lean body mass, GCR_SS - steady state glucose clearance, ml/min/kg lean body mass, icl_clamp - peripheral insulin clearance (1/min/m2), icl_OGTT - endogenous "pre-hepatic" clearance during the OGTT, hie_0 - hepatic insulin extraction during clamp, OGIS - oral glucose insulin sensitivity index (ml min-1 m-2). ISR5dr - insulin secretion 5 mM glucose, beta cell dose response (pmol min-1m-2). ISR0 basal insulin secretion (pmol min-1m-2). ISRtot - total insulin secretion (nmol m-2).
Extended Data Figure 4
Extended Data Figure 4. Meta-analysis workflow for genetic discovery analyses
Analysis workflow for the meta-analysis of study-level GWAS results for Insulin fold change and Modified Stumvoll ISI. Created with BioRender.com
Extended Data Figure 5
Extended Data Figure 5. Two independent signals were identified at PPP1R3B for insulin fold change
Conditional analyses identify a second independent signal at PPP1R3B for insulin fold change adjusted for BMI. The regional association plot shows the primary signal in red and the secondary signal in blue for marginal summary statistics for insulin fold change adjusted for BMI. Shade of point indicates pairwise LD (R2) with indicated lead variant.
Extended Data Figure 6
Extended Data Figure 6. Forest plot of beta estimates for the association of rs60453193 with insulin fold change in individual cohorts.
Labels on the right-hand side indicate the ancestry of the study and study name. EUR-European ancestry, HISAMR – Hispanic American ancestry, EAS – East Asian ancestry. Left-hand side values are beta estimate and 95% confidence interval. Error bars denote a 95% confidence interval. X-axis denotes the beta estimate of associations with insulin fold change in BMI adjusted analyses.
Extended Data Figure 7
Extended Data Figure 7. Regional association plot at BICC1 (rs60453193)for insulin fold change in meta-analysis of non-European cohorts.
Unadjusted -log10 p-values are indicated on the y axis. Lead variant indicated by purple diamond.
Extended Data Figure 8
Extended Data Figure 8. rs117643180 exhibits allelic differences in transcription factor binding.
An EMSA using 6μg per lane of nuclear extract from undifferentiated LHCN-M2 cells shows protein-DNA interactions for probes centered around each both alleles of rs117643180. The probe containing rs117643180-A shows allele-specific protein binding (Arrow A, lane 6), relative to the probe containing rs117643180-C (lane 2). A 25-fold excess unlabeled probe containing the A allele competed away A-specific bands more effectively (lane 7) than 25-fold excess unlabeled probe containing the C allele (lane 8). Arrow B shows a biotinylated free probe (200 fmol per lane). Uncropped image is available in Source Data.
Extended Data Figure 9
Extended Data Figure 9. Confirmation of knockdown of positive control genes in wildtype 3T3-L1 adipocytes by Western Blot.
Representative blot from N=2. Marker indicates protein size in kDa is outlined on the right-hand side of the blot. siGenome and OT+ represent siRNA pools with their corresponding targets indicated below (see methods) and NT denotes non-targeting control. Antibodies are outlined on the left-hand side of the blot with Tubulin and B-actin used as loading controls. Uncropped blots are provided in Source Data.
Figure 1
Figure 1. Loci associated with post-challenge insulin resistance overlap with associations with other glycaemic traits and T2D
Manhattan plot of results for IFC, ISI and relative association with key glycaemic traits of interest. Y-axis denotes the -log10(p-value) of association for each trait. X-axis outlines the chromosomal position, with alternate chromosomes represented in light and dark grey. The dashed line defines genome-wide significance threshold (P = 5x10⁻⁸), and the dotted line denotes P = 1x10⁻⁵. Points highlighted in blue on each plot represent those that meet genome-wide significance for either IFC and ISI (P < 5x10⁻⁸). Labels for indicate the nearest gene at a locus defined at genome-wide significance for either IFC and ISI, and their relative association with other traits. Published GWAS were used for fasting insulin and 2 h glucose,, and T2D. For T2D y axis is cut at 1x10-80 for clarity, with the minimum p value truncated to P = 1x10-300. Uncorrected p-values are shown. All GWAS are in cohorts of European ancestry and adjusted for BMI, except T2D which is unadjusted for BMI.
Figure 2
Figure 2. rs117643180 at SLC2A4 affects GLUT4 expression and transcription regulation.
A) Regional association plot showing ± 500kb around rs117643180 (SLC2A4) : insulin fold change (IFC) - blue, Modified Stumvoll (ISI) – red, and 2 h glucose – green, fasting insulin – purple, type 2 diabetes – pink. Y-axis denotes the unadjusted log10(p-value) of association. The dashed lines and dotted line indicate genome-wide (P = 5x10⁻⁸) and suggestive (P = 1x10⁻⁵) significance threshold, respectively. All association statistics are from BMI adjusted analyses in studies of European ancestry, except T2D which is unadjusted for BMI. Labels indicate the lead variant for each trait, with location indicating position. B) Association of rs117643180 with key metabolic traits of interest. Plot shows beta estimate or odds ratio of association for rs117643180 with traits outlined in (A) and fasting glucose and waist-to-hip ratio in grey. Point represents effect size and error bars indicate 95% CI. C) rs117643180 overlaps a transcriptionally active region in muscle tissues. rs117643180 is located ~730 bp downstream of the main SLC2A4 transcription start site (TSS) and ~330 bp downstream of an alternate SLC2A4 TSS. A 229-bp region flanking the variant, as shown by the orange bar, overlaps with accessible chromatin in LHCN-M2 (DNAase), chromatin marks of regulatory activity in fetal muscle leg tissue , a region conserved across species (vertebrate conservation), and a skeletal muscle ChromHMM (red =ActiveTSS). Created using http://genome.ucsc.edu D-E) rs117643180 exhibits allelic differences in transcriptional activity. Values represent fold-change of firefly luciferase/Renilla activity normalized to empty pGL4.23 vector in C2C12 cells, for the A (effect) and C (non-effect) alleles clones in forward and reverse orientation (See Methods) (D) and LHCN-M2 myotubes (E). Error bars represent the SEM of 4 to 5 independent clones tested in duplicate wells; points represent individual biological replicates. P-values are calculated from two-sided t-tests.
Figure 3
Figure 3. 15 genes at loci associated with insulin fold change were identified to significantly impact GLUT4 trafficking in adipocytes
a) Effect of gene knockdown on GLUT4 trafficking and glucose transport at 0.5 nM insulin stimulation in WT 3T3-L1 adipocytes (N = 3 biologically independent replicates, 2 technical replicates per N). Genes are clustered using hierarchical clustering. All results are normalised to non-targeting (NT) control. Grey represents genes for which glucose transport data was not collected as their role is established in the literature. Scale represents relative effect of gene knockdown compared to NT control for given measures – red positive, and blue negative, with the maximal scale representing the maximum absolute response relative to NT (0) across all measures, expressed as a percentage, to allow direct comparison across measures.-. B-D) Representative fluorescence microscopy images of example siRNA knockdown in WT 3T3-L1 adipocytes (N = 3 biologically independent replicates, 2 technical replicates per N) at 0.5 and 100nM insulin stimulation. Green represents the surface GLUT4 signal, orange the total GLUT4 signal and blue indicates individual nuclei. Scale bars indicate 100 μm. Quantification of Slc36a4 and Pdzk1ip1 compared to NT control and images at 0 nM are shown in Supplementary Figure 25. b) shows non-targeting control, c) Slc36a4 and d) Pdzk1ip1.

Comment in

References

    1. James DE, Stöckli J, Birnbaum MJ. The aetiology and molecular landscape of insulin resistance. Nat Rev Mol Cell Biol. 2021;22:751–771. - PubMed
    1. Defronzo RA. From the Triumvirate to the Ominous Octet: A New Paradigm for the Treatment of Type 2 Diabetes Mellitus. Diabetes. 2009;58:773–795. - PMC - PubMed
    1. Chen J, et al. The trans-ancestral genomic architecture of glycemic traits. Nat Genet. 2021;53:840–860. - PMC - PubMed
    1. Scott RA, et al. Large-scale association analyses identify new loci influencing glycemic traits and provide insight into the underlying biological pathways. Nat Genet. 2012;44:991–1005. - PMC - PubMed
    1. Lagou V, et al. Sex-dimorphic genetic effects and novel loci for fasting glucose and insulin variability. Nat Commun. 2021;12:1–18. - PMC - PubMed

Publication types