. 2023 Sep;19(9):1147-1157.
doi: 10.1038/s41589-023-01350-1. Epub 2023 Jun 8.

A general method for the development of multicolor biosensors with large dynamic ranges

Affiliations

A general method for the development of multicolor biosensors with large dynamic ranges

Lars Hellweg et al. Nat Chem Biol. 2023 Sep.

Abstract

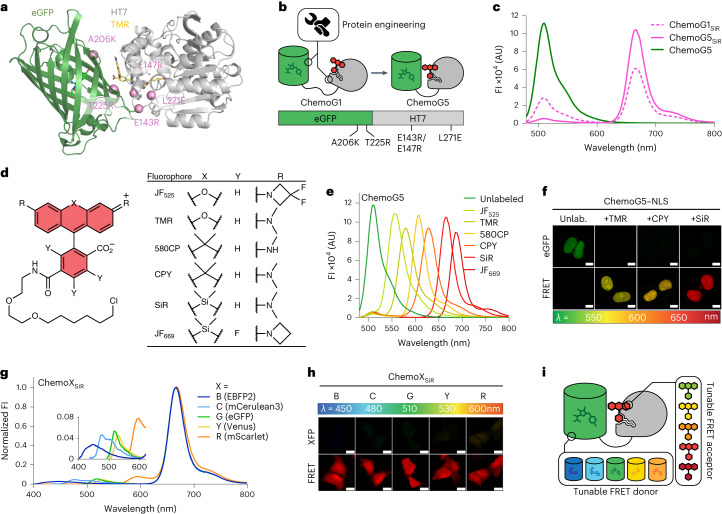
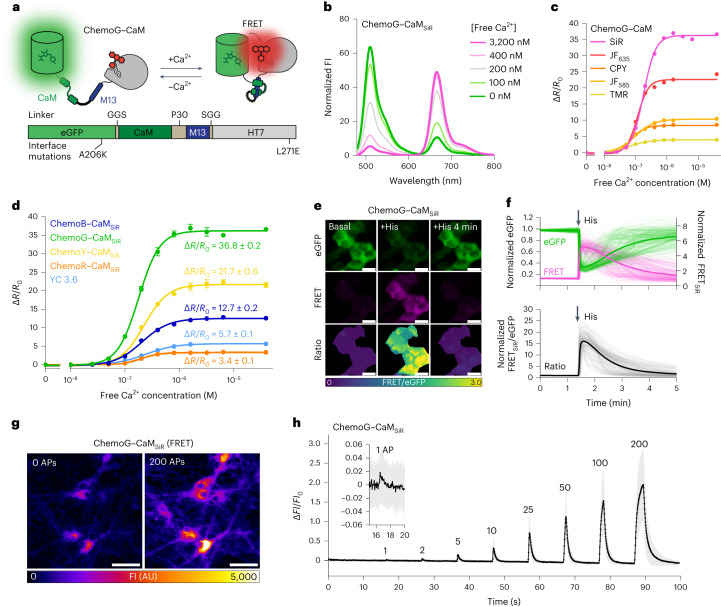
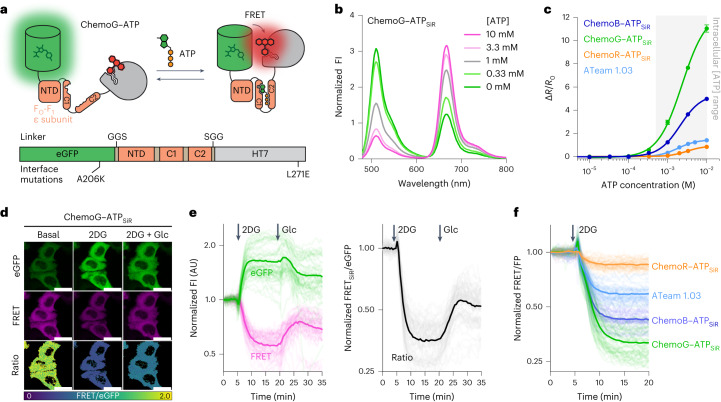
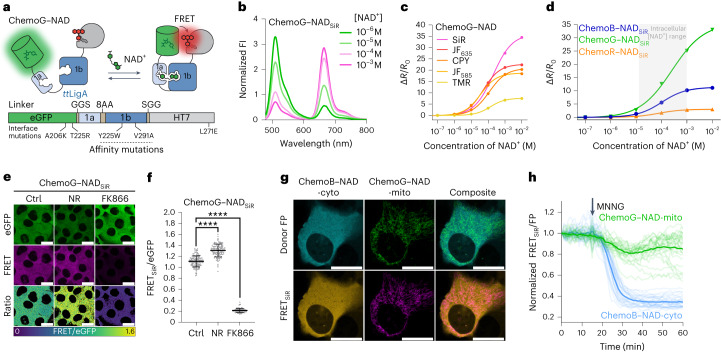
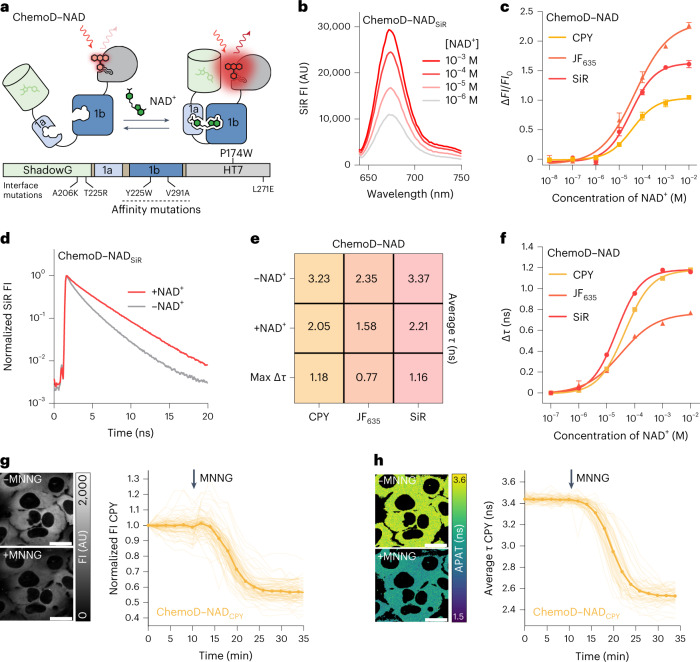
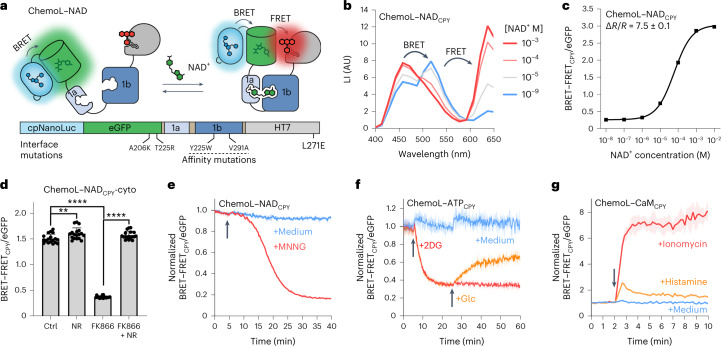
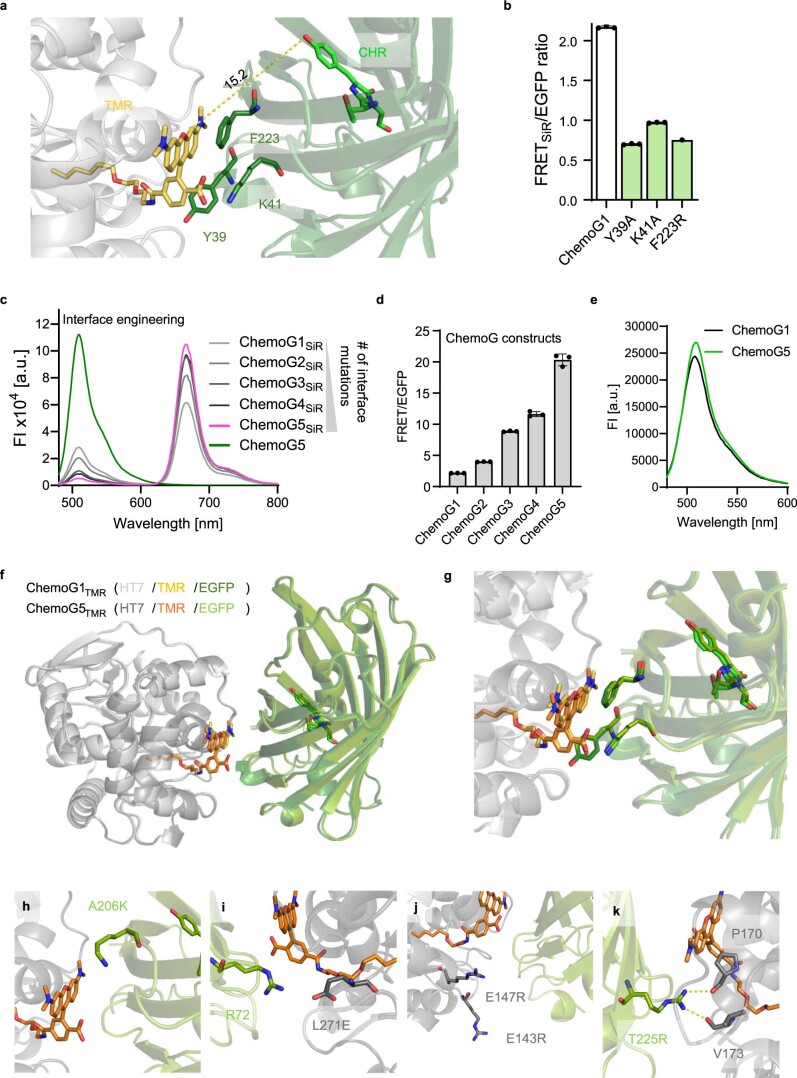
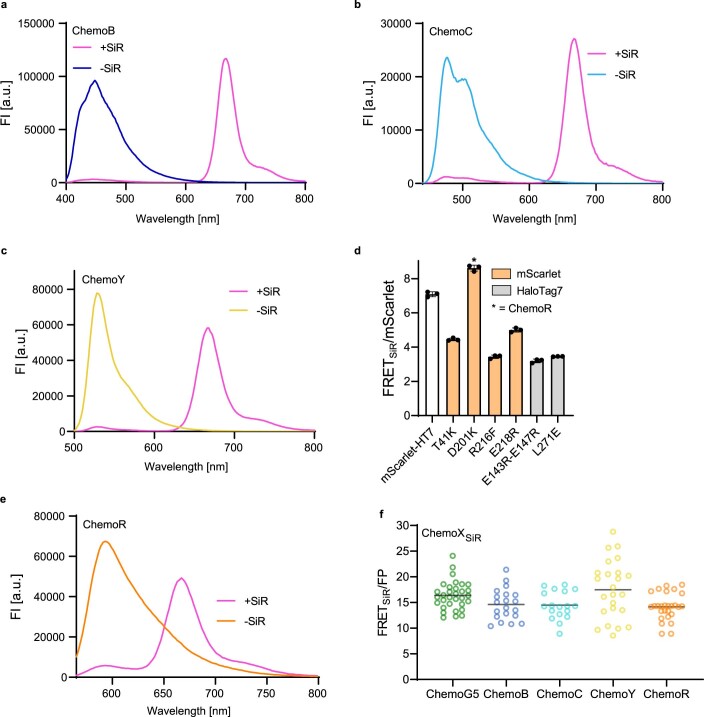
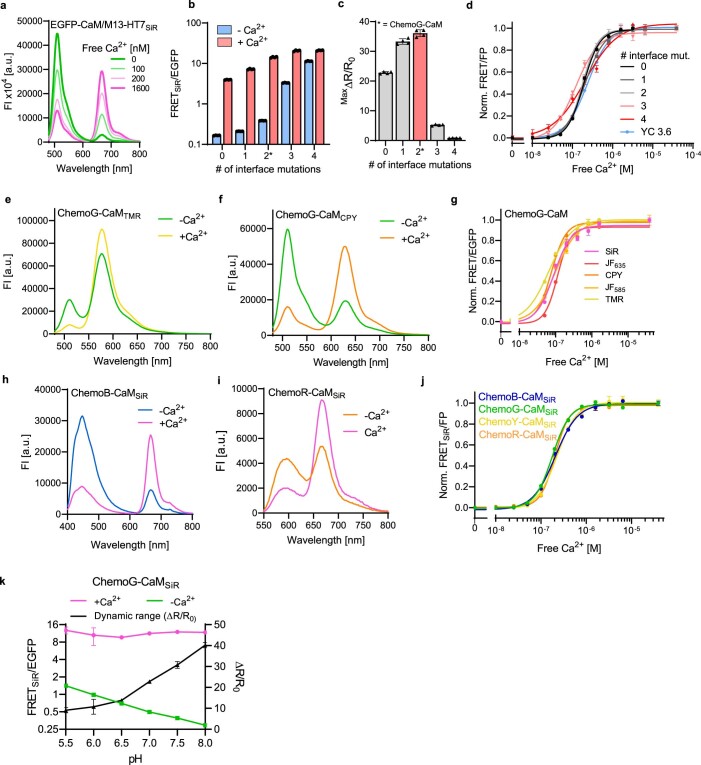
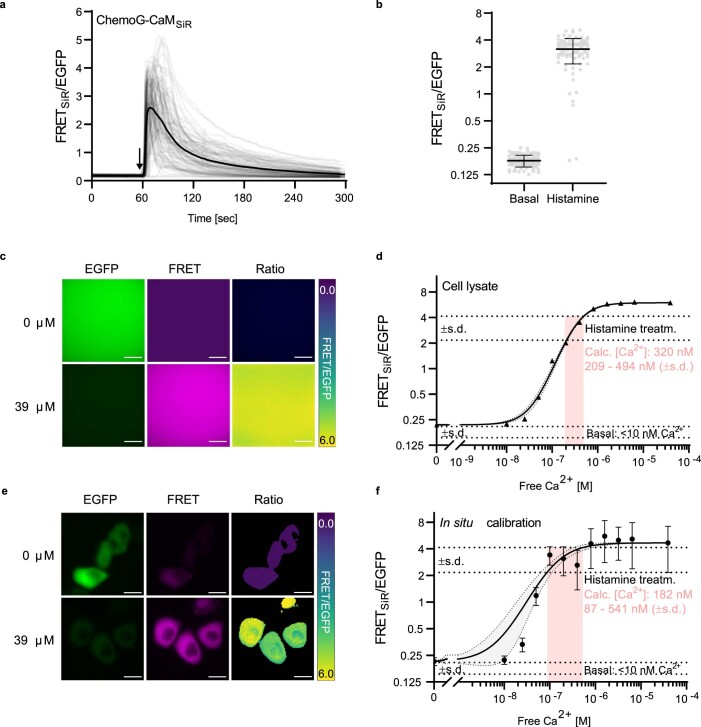
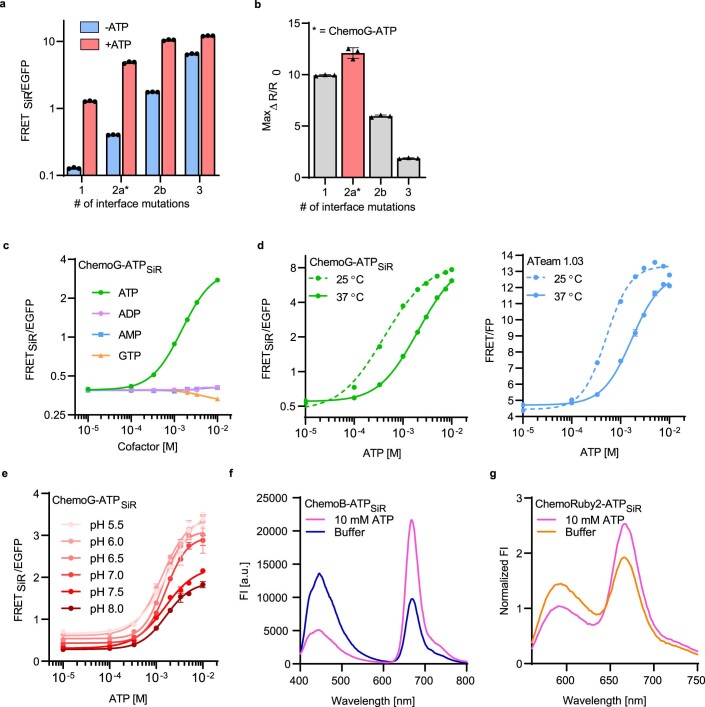
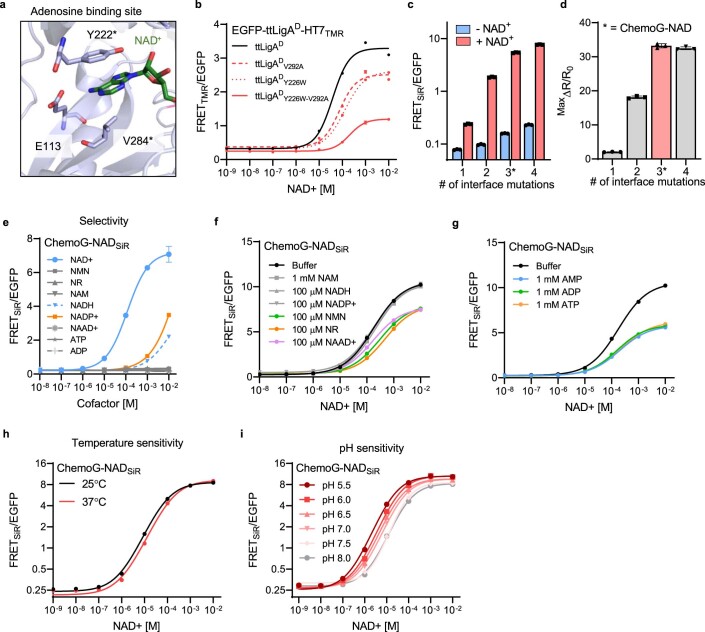
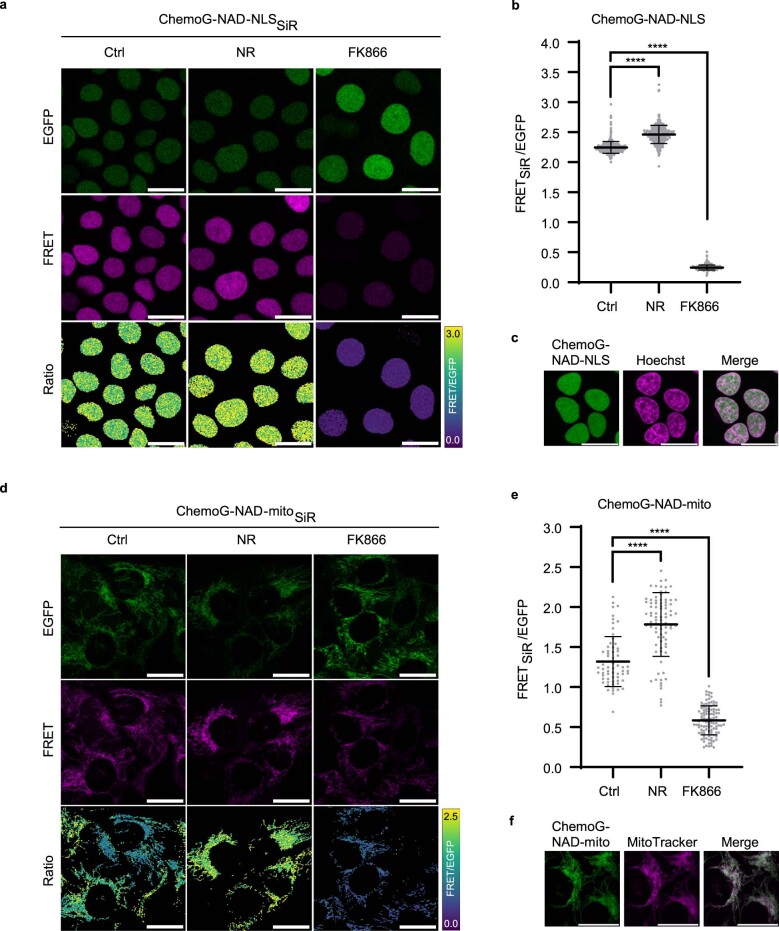
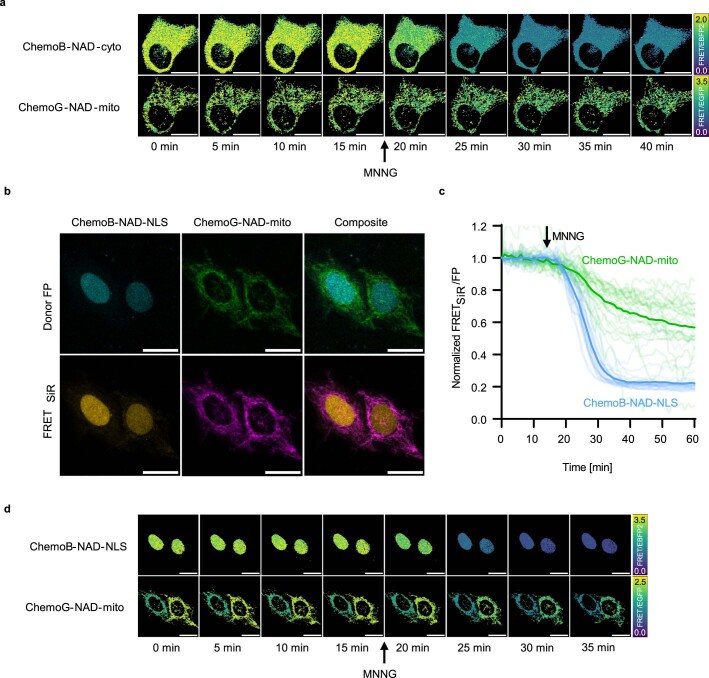
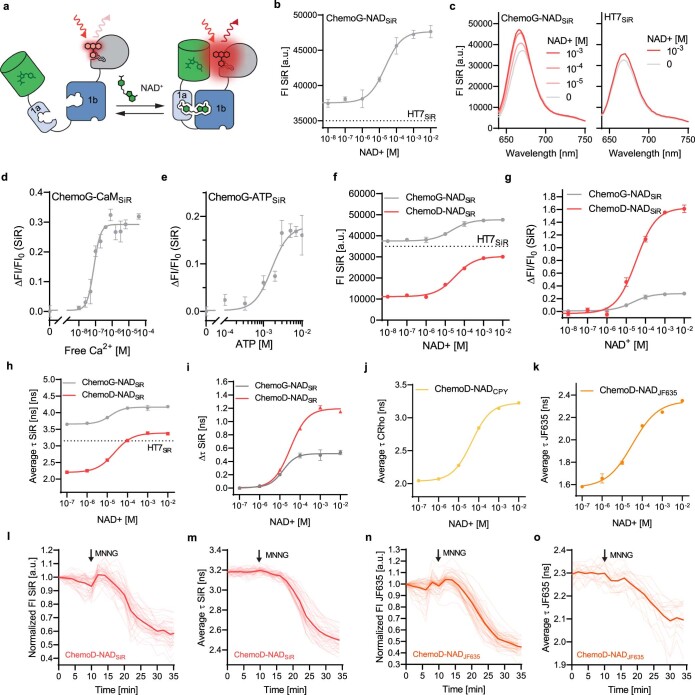
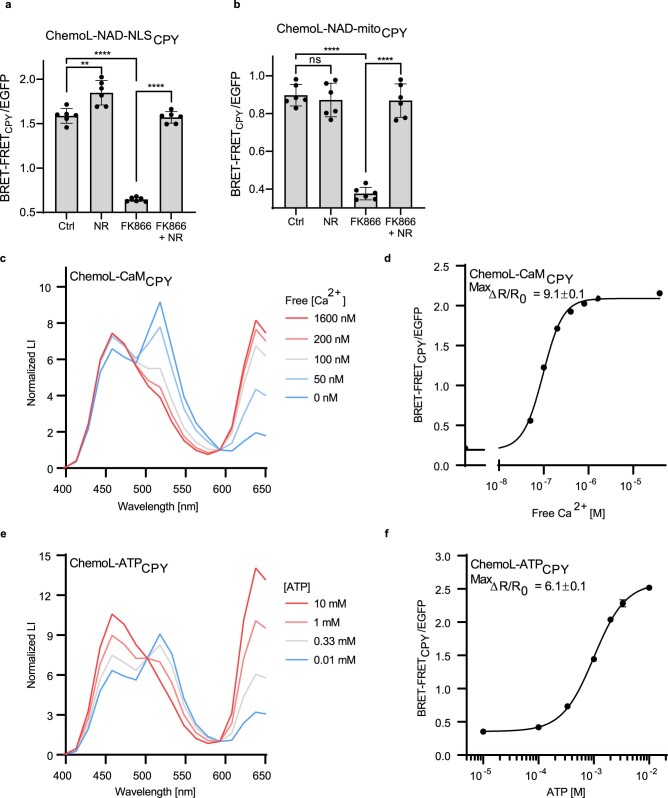
Fluorescent biosensors enable the study of cell physiology with spatiotemporal resolution; yet, most biosensors suffer from relatively low dynamic ranges. Here, we introduce a family of designed Förster resonance energy transfer (FRET) pairs with near-quantitative FRET efficiencies based on the reversible interaction of fluorescent proteins with a fluorescently labeled HaloTag. These FRET pairs enabled the straightforward design of biosensors for calcium, ATP and NAD+ with unprecedented dynamic ranges. The color of each of these biosensors can be readily tuned by changing either the fluorescent protein or the synthetic fluorophore, which enables simultaneous monitoring of free NAD+ in different subcellular compartments following genotoxic stress. Minimal modifications of these biosensors furthermore allow their readout to be switched to fluorescence intensity, fluorescence lifetime or bioluminescence. These FRET pairs thus establish a new concept for the development of highly sensitive and tunable biosensors.


Conflict of interest statement

K.J. is listed as inventor for patents related to labeling technologies filed by the Max Planck Society or the Ecole Polytechnique Federale de Lausanne. The remaining authors declare no competing interests.

Figures

Fig. 1
Fig. 1. Development of chemogenetic FRET pairs with tunable wavelengths (ChemoX).
a, Crystal structure of TMR-labeled ChemoG1; ChemoG1, eGFP–HT7 fusion construct; PDB ID: 8B6S, resolution of 1.8 Å. Proteins are represented as cartoons, and the eGFP chromophore and TMR are shown as sticks. Pink spheres represent the engineered positions at the eGFP and HT7 interface. b, Schematic representation of ChemoG1 interface engineering. c, Fluorescence intensity (FI) emission spectra of SiR-labeled ChemoG1 (ChemoG1SiR) and ChemoG5 (ChemoG5SiR) with unlabeled ChemoG5. Means of three technical replicates are shown; AU, arbitrary units. d, General chemical structure of rhodamine fluorophores. e, Fluorescence intensity emission spectra of ChemoG5 labeled with spectrally distinct rhodamine fluorophores listed in d. Means of three technical replicates are shown. f, Confocal images of U-2 OS cells expressing ChemoG5 in the nucleus (ChemoG5–NLS) labeled with TMR, CPY or SiR or unlabeled (Unlab.). Shown are the eGFP and FRET channels corresponding to the maximal emission of the respective fluorophores. Look up tables (LUT) of eGFP and FRET channels are adjusted to the same values for each condition; scale bars, 10 µm. g, Fluorescence intensity emission spectra of ChemoX constructs labeled with SiR. Spectra were normalized to the maximum FRET emission. The inset shows a zoom-in of the FRET donor fluorescence emission. Means of three technical replicates are shown. h, Confocal images of ChemoX constructs expressed in U-2 OS cells and labeled with SiR. Shown are the corresponding FP and FRET emission channels. LUT of XFP and FRET channels are adjusted to the same values for each construct; scale bars, 25 µm. i, Schematic representation of the spectral tunability of the ChemoX approach. Source data
Fig. 2
Fig. 2. Development of ratiometric calcium sensors based on ChemoX.
a, Schematic representation of ChemoG–CaM. b, Normalized fluorescence intensity emission spectra of SiR-labeled ChemoG–CaM at different concentrations of free calcium. Means of three technical replicates are shown; [Free Ca2+], concentration of free calcium. c, Calcium titration curves of ChemoG–CaM labeled with different fluorophores. Data are shown as the mean ± s.d. of the FRET/eGFP ratio changes (ΔR/R0; n = 3 technical replicates). ΔR/R0 and C50 data are summarized in Supplementary Table 6. d, Calcium titration curves of ChemoX–CaMSiR and YC 3.6. Data are shown as in c (n = 3 technical replicates). ΔR/R values are indicated and summarized together with the C50 data in Supplementary Table 5. e, Widefield images of HeLa Kyoto cells transiently expressing ChemoG–CaM labeled with SiR. Shown are the eGFP channel, the FRET channel and the ratio image of both channels (FRET/eGFP) in pseudocolor (LUT = mpl-viridis). The images represent cells under basal conditions before the addition of histamine (basal), 15 s after the addition of histamine (+His) and 4 min after the addition of histamine (+His 4 min); scale bars, 25 µm. f, Time course measurement of ChemoG–CaMSiR fluorescence intensity in HeLa Kyoto cells. Represented are the eGFP and FRET channel (top) and FRET/eGFP ratio normalized to 1 at t = 0 min (bottom). Cells were treated with histamine at the time point indicated with an arrow; n = 161 cells from three biological replicates. Represented are the means (solid line) plus traces of individual cells (dim lines). g, Widefield images of rat hippocampal neurons expressing cytosolic ChemoG–CaM labeled with SiR at different stimulation intensities. Neurons were stimulated with an electric field corresponding to 0 or 200 APs. The fluorescence intensity of the SiR FRET channel is represented in pseudocolor (LUT = Fire); scale bars, 50 µm. h, Time course measurement of ChemoG–CaMSiR fluorescence intensity in rat hippocampal neurons. Represented is the FRET fluorescence intensity change (ΔFI/FI0) after electric field stimulation; n = 61 cells from three biological replicates. The numbers of APs are indicated. Data are shown as mean (line) ± s.d. (shaded area). Source data
Fig. 3
Fig. 3. Development of ratiometric ATP sensors based on ChemoX.
a, Schematic representation of ChemoG–ATP; NTD, N-terminal domain. b, Fluorescence intensity emission spectra of SiR-labeled ChemoG–ATP at different ATP concentrations. Means of three technical replicates are shown; [ATP], ATP concentration. c, ATP titration curves of ChemoX–ATPSiR sensors. Data are shown as the means ± s.d. of the FRET/eGFP ratio changes (ΔR/R0; n = 3 technical replicates). The intracellular ATP concentration range is indicated with a gray box. ΔR/R0 and C50 values are summarized in Supplementary Table 7. d, Confocal images of HeLa Kyoto cells expressing ChemoG–ATP labeled with SiR. Shown are the eGFP channel, the FRET channel and the ratio image of both channels (FRET/eGFP) in pseudocolor (LUT = mpl-viridis). Cells were treated at t = 5 min with 10 mM 2DG. At t = 20 min, 20 mM glucose (Glc) was added to the cells until the end of the experiment (t = 35 min, 2DG + Glc); scale bars, 25 µm. e, Time course measurement of ChemoG–ATPSiR fluorescence intensity in HeLa Kyoto cells. Shown are the eGFP and FRET channels (left) and FRET/eGFP ratio (right) normalized to 1 at t = 0 min. Cells were treated with 10 mM 2DG and subsequently with 20 mM glucose at time points indicated with arrows. Experiments are as explained in d; n = 59 cells from three biological replicates. Represented are the means (solid lines) and traces of the individual cells (dim lines). f, Time course measurement of ChemoB–ATPSiR (n = 58 cells), ChemoG–ATPSiR (n = 63 cells), ChemoR–ATPSiR (n = 52 cells) and ATeam 1.03 (n = 59 cells) fluorescence intensity in HeLa Kyoto cells. The FRET/FP ratio after treatment with 10 mM 2DG is shown. Ratios are normalized to 1 at t = 0 min. Addition of 2DG is indicated with an arrow. Represented are the means (line) and single-cell traces (dim lines) from three biological replicates. Source data
Fig. 4
Fig. 4. Multiplexing subcellular NAD+ pools using ChemoX–NAD biosensors.
a, Schematic representation of ChemoG–NAD. b, Normalized fluorescence intensity emission spectra of SiR-labeled ChemoG–NAD at different NAD+ concentrations. Means of three technical replicates are shown; [NAD+], NAD+ concentration. c, NAD+ titration curves of ChemoG–NAD labeled with different fluorophores. Data are shown as the means ± s.d. of the FRET/eGFP ratio changes (ΔR/R0; n = 3 technical replicates). ΔR/R0 and C50 values are summarized in Supplementary Table 8. d, NAD+ titration curves of ChemoX–NADSiR biosensors. Data are shown as the means ± s.d. of the FRET/eGFP ratio changes (ΔR/R0; n = 3 technical replicates). The intracellular free NAD+ concentration range is indicated with a gray box. ΔR/R0 and C50 values are summarized in Supplementary Table 8. e, Confocal images of U-2 OS cells expressing ChemoG–NAD labeled with SiR. Shown are the eGFP channel, the FRET channel and the ratio image of both channels (FRET/eGFP) in pseudocolor (LUT = mpl-viridis). Cells were treated for 24 h with DMSO (Ctrl), 100 nM FK866 or 1 mM NR; scale bars, 25 µm. f, Dot plots representing the FRET/eGFP ratios of ChemoG–NADSiR expressed in U-2 OS cells treated as described in d; n = 133 (Ctrl), 117 (NR) and 132 (FK866) cells from three independent experiments. P values are given based on unpaired two-tailed t-test with Welch’s correction; ****P < 0.0001. Data are shown as the means ± s.d. g, Confocal image of U-2 OS cell coexpressing ChemoB–NAD-cyto and ChemoG–NAD-mito labeled with SiR. Shown are the FRET donor FP channels, the FRET channels and the composites of the FP or FRET channel of both sensors pseudocolored (eBFP2 (cyan), eGFP (green), eBFP2-FRET (orange) and eGFP-FRET (magenta)). The brightness of the donor and FRET channels was adjusted to show potential cross-talk between the channels; scale bars, 25 µm. h, Time course measurement of ChemoB–NAD-cyto (cytosol) and ChemoG–NAD-mito (mitochondria) fluorescence intensity coexpressed in U-2 OS cells and labeled with SiR. Represented are the means of the FRET/FP ratios (line) and single-cell traces (dim lines) normalized to 1 at t = 0 min. The addition of MNNG is indicated with an arrow (n = 28 cells from four biological replicates). Source data
Fig. 5
Fig. 5. Development of far-red NAD+ biosensors based on fluorescence intensity and fluorescence lifetime.
a, Schematic representation of ChemoD–NAD. b, Fluorescence intensity emission spectra of SiR-labeled ChemoD–NAD at different NAD+ concentrations. Means of three technical replicates are shown. c, NAD+ titration curves of ChemoD–NAD labeled with CPY, JF635 or SiR. Data are shown as the means ± s.d. of the fluorescence intensity changes (ΔFI/FI0; n = 3 technical replicates). ΔFI/FI0 and C50 values are summarized in Supplementary Table 9. d, Fluorescence lifetime decay curves of ChemoD–NADSiR in the presence of 1 mM NAD+ (+NAD+) or absence of NAD+ (–NAD+). e, Intensity-weighted average fluorescence lifetimes (τ) of ChemoD–NAD labeled with different fluorophores. Shown are the mean intensity-weighted average fluorescence lifetimes in the presence of 1 mM NAD+ (+NAD+) or absence of NAD+ (–NAD+) and the change in lifetime (Δτ; n = 3 technical replicates). f, NAD+ titration curves of ChemoD–NAD labeled with CPY, JF635 or SiR. Shown are the means ± s.d. of the intensity-weighted average fluorescence lifetime changes (Δτ; n = 3 technical replicates). Δτ and C50 values are summarized in Supplementary Table 10. g,h, Confocal images of U-2 OS cells expressing ChemoD–NAD labeled with CPY. Images are representative snapshots of the CPY fluorescence intensity channel (g) or average photon arrival time (APAT; h) before (–MNNG) and after (+MNNG) 100 µM MNNG treatment. Time course measurements of ChemoD–NADCPY fluorescence intensity normalized to 1 at t = 0 min (g; n = 86 cells from three biological replicates) and intensity-weighted average fluorescence lifetime (h; n = 55 cells from three biological replicates) in U-2 OS cells are shown next to the confocal images corresponding to the same treatments. Represented are the means (lines) and traces of single cells (dim lines). Addition of 100 µM MNNG is indicated with arrows; scale bars, 25 µm. Source data
Fig. 6
Fig. 6. Conversion of ChemoG-based biosensors into luminescent ChemoL biosensors.
a, Schematic representation of ChemoL–NAD. b, Luminescent intensity (LI) emission spectra of CPY-labeled ChemoL–NAD at different NAD+ concentrations. Means of three technical replicates are shown. c, NAD+ titration curve of ChemoL–NADCPY. Shown are the mean BRET–FRETCPY/eGFP luminescence ratios ± s.d of three technical replicates. d, ChemoL–NADCPY BRET–FRET/eGFP ratios in U-2 OS cells after treatment for 24 h with DMSO (Ctrl), 1 mM NR, 100 nM FK866 or 100 nM FK866 and 1 mM NR. Represented are the means ± s.d. and single-well ratios (circles; n = 18 wells per condition from three biological replicates). P values are given based on unpaired two-tailed t-tests with Welch’s correction; **P = 0.006; ****P < 0.0001. e, Time course measurement of ChemoL–NADCPY expressed in U-2 OS cells. Represented are the means of the BRET–FRET/eGFP ratios (line) ± s.d. (shaded areas) normalized to 1 at t = 0 min. Cells were untreated (+medium) or treated (+MNNG) with MNNG at t = 5 min indicated with an arrow (n = 3 wells from one representative biological replicate; two additional biological replicates can be found in Supplementary Fig. 10). f, Time course measurement of ChemoL–ATPCPY expressed in HeLa Kyoto cells. Represented are the mean BRET–FRET/eGFP ratios (line) ± s.d. (shaded areas) normalized to 1 at t = 0 min. Cells were untreated (medium), treated with 2DG at t = 5 min (red and orange) and additionally treated with glucose at t = 25 min (orange). Addition of medium, 2DG and glucose is indicated with an arrow (n = 3 wells from one representative biological replicate; two additional biological replicates can be found in Supplementary Fig. 10). g, Time course measurement of ChemoL–CaMCPY expressed in HeLa Kyoto cells. Shown are the mean BRET–FRET/eGFP ratios (line) ± s.d. (shaded areas) normalized to 1 at t = 0 min. Cells were untreated or treated with histamine or ionomycin at t = 2 min (n = 3 wells from one representative biological replicate; two additional biological replicates can be found in Supplementary Fig. 10). Addition of drugs is indicated with an arrow. Source data
Extended Data Fig. 1
Extended Data Fig. 1. ChemoG-FRET surface engineering.
a. X-ray structure of ChemoG1 labeled with TMR (PDB ID: 8B6S). Shown is the interface between eGFP and TMR labeled to HT. The eGFP chromophore and TMR are shown as sticks and their distance is marked with a dotted line. Residues Y39, K41 and F223 of eGFP involved in the direct interaction with TMR are annotated and shown as sticks. b. FRET ratios of ChemoG1 and variants carrying mutations of residues involved in the eGFP/HT7TMR interface (n = 3 technical replicates, shown is the mean ±s.d.). c. Fluorescence intensity (FI) emission spectra of SiR-labeled ChemoG1-ChemoG5 and unlabeled ChemoG5. Represented are the means of 3 technical replicates. d. FRET ratios of SiR-labeled ChemoG1-ChemoG5 (n = 3 technical replicates, shown is the mean ±s.d.). e. Fluorescence intensity (FI) emission spectra of 100 nM unlabeled ChemoG1 and ChemoG5. Represented are the means of 3 technical replicates. f, g. Structural comparison between ChemoG1TMR (PDB ID: 8B6S) and ChemoG5TMR (PDB ID: 8B6T). Structures represented as in a. Overview (f) and zoom-in (g) of the interface between eGFP and TMR are shown. h-k. Zoom-ins of the ChemoG5TMR X-ray structure showing the interface between eGFP and HT7 for each interface mutation (eGFPA206K, HT7L271E, HT7E143R-E147R and eGFPT225R). Source data
Extended Data Fig. 2
Extended Data Fig. 2. Expansion of ChemoG to other donor FPs.
a-c, e. Fluorescence intensity (FI) emission spectra of optimized ChemoB (a), ChemoC (b), ChemoY (c) or ChemoR (e) labeled with SiR (+SiR) or unlabeled (-SiR). Interface mutations, FRET ratios and FRET efficiencies are listed in Supplementary Table S4. Shown are the means of 3 technical replicates. d. FRET/mScarlet ratios of SiR-labeled mScarlet-HT7 and mScarlet-HT7 variants with different mutations on mScarlet (orange) or HT7 (grey). The mutation D201K used in the optimized ChemoR construct is marked with an asterisk. Shown are the means ±s.d. (n = 3 technical replicates) f. FRET ratios of ChemoX constructs expressed in U-2 OS cells and labeled with SiR (n > 17 cells). Plotted for each construct are the FRET/FP ratios of individual cells (circles) and the mean (black line). The values are derived from 2 independent experiments. Source data
Extended Data Fig. 3
Extended Data Fig. 3. Engineering and characterization of ChemoX-CaM calcium sensors.
a. Fluorescence intensity (FI) emission spectra of eGFP-CaM/M13-HT7 labeled with SiR in presence of different concentrations of free Ca2+. Shown are the means of 3 technical replicates. b. FRET/eGFP ratios of calcium sensors differing in the number of interface mutations (Supplementary Table S5) in presence (39 μM) or absence (0 μM) of free Ca2+. Sensors were labeled with SiR. The variant corresponding to the final calcium sensor ChemoG-CaM is marked with an asterisk. Shown are the means ±s.d. n = 4 technical replicates. c. Maximal FRET/eGFP ratio changes (MaxΔR/R0) of calcium sensors differing in the number of interface mutations (Supplementary Table S5). Sensors were labeled with SiR. The variant corresponding to the final calcium sensor ChemoG-CaM is marked in red and with an asterisk. Shown are the means ±s.d. n = 4 technical replicates. d, g, j. Ca2+ titrations of SiR-labeled calcium sensors differing in the number of interface mutations (d, Supplementary Table S5), ChemoG-CaM labeled with different fluorophores (g, Supplementary Table S6) or ChemoX-CaM calcium sensors labeled with SiR (j, Supplementary Table S5). Shown are the means ±s.d. n = 3 technical replicates. e, f. Fluorescence intensity (FI) emission spectra of ChemoG-CaM labeled with TMR (e) or CPY (f) in presence (39 μM) or absence (0 μM) of free Ca2+. Shown are the means of 3 technical replicates. h, i. Fluorescence intensity (FI) emission spectra of ChemoB-CaM (h) or ChemoR-CaM (i) labeled with SiR in presence (39 μM) or absence (0 μM) of free Ca2+. Shown are the means of 3 technical replicates. k. pH sensitivity of the FRET/eGFP ratio of ChemoG-CaMSiR in presence (2 mM CaCl2, +Ca2+) or absence (2 mM EGTA, -Ca2+) of free Ca2+. Shown are the means ±s.d of three technical replicates. Source data
Extended Data Fig. 4
Extended Data Fig. 4. Absolute quantification of cytosolic calcium concentrations using ChemoG-CaMSiR.
a. Time course measurement of free intracellular calcium fluctuations using ChemoG-CaMSiR in HeLa Kyoto cells. Represented are the FRETSiR/eGFP ratios. Cells were imaged in HBSS and treated with histamine (indicated with an arrow; n = 96 cells from 3 biological replicates). b. Comparison of the FRETSiR/eGFP ratios of ChemoG-CaMSiR measured in HeLa Kyoto cells in resting conditions (basal) and upon treatment with histamine. Data extracted from experiment described in panel a. Shown are the means ±s.d. c. Widefield microscopy images of lysate from HeLa Kyoto cells expressing SiR-labeled ChemoG-CaM. Lysate was equilibrated in calcium calibration buffers containing 0 μM or 39 μM free calcium. Shown are the eGFP channel, the FRETSiR channel and the ratio image of both channels (FRETSiR/eGFP) in pseudocolor (LUT = mpl-viridis). d. ChemoG-CaMSiR calcium titration curve obtained from HeLa Kyoto cell lysate. Shown are the means ±s.d. of n = 3 technical replicates. The mean calcium concentrations (±s.d.) in histamine stimulated states were calculated from the FRETSiR/eGFP ratios measured in HeLa Kyoto cells (from panels a-b). The 95% confidence interval of the non-linear regression fit is shown as grey shade. e. Widefield images of HeLa Kyoto cells transiently expressing ChemoG-CaM labeled with SiR. Cells were permeabilized and equilibrated in calcium calibration buffers containing 0 μM or 39 μM free calcium. Shown are the eGFP channel, the FRETSiR channel and the ratio image of both channels (FRETSiR/eGFP) in pseudocolor (LUT = mpl-viridis). f. ChemoG-CaMSiR calcium titration curve obtained from permeabilized HeLa Kyoto cells. Shown are the means ±s.d. of n = 2 biological replicates. The mean calcium concentrations (±s.d.) in histamine stimulated states were calculated from the FRETSiR/eGFP ratios measured in HeLa Kyoto cells (from panels a-b). The 95% confidence interval of the non-linear regression fit is shown as grey shade. Calcium resting concentrations in cells (basal) could not be determined since the FRETSiR/eGFP ratios were below the lower measured ratio in sensor calibration and was hence interpreted as below the lowest calcium concentration used in calibration that is < 10 nM. Source data
Extended Data Fig. 5
Extended Data Fig. 5. Engineering and characterization of ChemoX-ATP sensors.
a. FRET/eGFP ratios of ATP sensors differing in the number of interface mutations (Supplementary Table S7) in presence (+ATP) or absence (+ATP) of 10 mM ATP. Asterisk indicates construct corresponding to the final sensor ChemoG-ATP. Shown are the means ±s.d. n = 3 technical replicates. b. Maximal FRET/eGFP ratio changes (MaxΔR/R0) of ATP sensors differing in the number of interface mutations (Supplementary Table S7). Asterisk indicates construct corresponding to the final sensor ChemoG-ATP. Shown are the means ±s.d. n = 3 technical replicates. c. Titrations of ChemoG-ATPSiR with ATP and structurally related molecules. d. Titrations of ChemoG-ATPSiR and ATeam 1.03 with ATP at different temperatures. e. Titrations of ChemoG-ATPSiR and ATeam 1.03 with ATP at different pH. Shown are the means ±s.d. of 3 technical replicates. f, g. Fluorescence intensity (FI) emission spectra of ChemoB-ATP (f) and ChemoR-ATP (g) labeled with SiR (Supplementary Table S7) in presence or absence of 10 mM ATP. Shown are the means of 3 technical replicates. Source data
Extended Data Fig. 6
Extended Data Fig. 6. Engineering and characterization of ChemoX-NAD sensors.
a. Zoom-in on the NAD+ binding site of the X-ray structure of LigA from Enterococcus faecalis (efLigA) bound to NAD+ (PDB ID: 1TAE). The structure is represented as cartoon (light blue) and NAD+ (green) and residues involved in the binding of NAD+ (Y222 and V284, light blue) are represented as sticks. *Y222 and V284 of efLigA correspond to Y226 and V292 of LigA from Thermus thermophilus (ttLigA). b. NAD+ titrations of sensor variants labeled with TMR. ttLigAD carries the extra mutations K117L and D289N rendering it catalytically inactive. Mutations Y226W and Y292A shift the sensor response towards the range of free intracellular NAD+. c. FRET ratios of NAD+ sensors differing in the number of interface mutations (Supplementary Table S5) in presence (+NAD+) or absence (-NAD+) of 1 mM NAD+. d. Maximal FRET/eGFP ratio change (MaxΔR/R0) of NAD+ sensors differing in the number of interface mutations. Asterisk indicates construct corresponding to the final sensor ChemoG-NAD. e. Titration of ChemoG-NAD with NAD+ or structurally related molecules. f. Titration of ChemoG-NADSiR with NAD+ in presence of different structurally related molecules. g. Titration of ChemoG-NADSiR with NAD+ in presence of 1 mM AMP, ADP or ATP. h, i. NAD+ titrations of ChemoG-NADSiR at different temperatures (h) or at different pH (i). For all graphs, the means of 3 technical replicates ±s.d. are shown. Source data
Extended Data Fig. 7
Extended Data Fig. 7. Performance of ChemoG-NAD in different subcellular compartments.
a, d. Confocal images of U-2 OS cells expressing ChemoG-NAD in the nucleus (ChemoG-NAD-NLS, a) or mitochondria (ChemoG-NAD-mito, d) labeled with SiR. Shown are the eGFP channel, FRET channel and ratio image (FRET/eGFP) in pseudocolor (LUT = mpl-viridis). Cells were treated for 24 h either with DMSO (Ctrl), 100 nM FK866 or 1 mM NR. All scale bars = 25 μm. b, e. FRET/eGFP ratios of U-2 OS cells corresponding to panels a and d, respectively. Shown are the FRET/eGFP ratios of single cells (circles) and the mean ±s.d. (black line) (nucleus: n = 353 (ctrl), 311 (NR), 300 (FK866) cells; mitochondria: n = 63 (ctrl), 85 (NR), 109 (FK866) cells; from 3 independent experiments). p-values are given based on unpaired two-tailed t-test with Welch’s correction (**** p < 0.0001). c. Confocal images of U-2 OS cells expressing ChemoG-NAD in the nucleus (ChemoG-NAD-NLS) and stained with Hoechst. f. Confocal images of U-2 OS cells expressing ChemoG-NAD in the mitochondria (ChemoG-NAD-mito) and stained with MitoTracker RedFM. All scale bars = 25 μm. Source data
Extended Data Fig. 8
Extended Data Fig. 8. Multiplexed imaging of ChemoX-NAD sensors in U-2 OS cells.
a, Confocal images of U-2 OS cells co-expressing ChemoB-NAD and ChemoG-NAD in the cytosol and mitochondria, respectively, labeled with SiR. Shown are the FRET/FP ratio images for each sensor in pseudocolor (LUT = mpl-viridis). Addition of 100 μM MNNG to the cells is indicated with an arrow (after t = 15 min). b. Confocal images of U-2 OS cells co-expressing ChemoB-NAD and ChemoG-NAD in the nucleus (NLS) and mitochondria, respectively. Shown are the FRET donor FP and FRET channels as well as the composite of FP or FRET channels of both sensors. c. Time course measurement of U-2 OS cells co-expressing ChemoB-NAD and ChemoG-NAD in the nucleus (NLS) and mitochondria, respectively, upon treatment with 100 μM MNNG. Shown are the means (line) and single cell traces (transparent lines) of the FRET/FP ratios of ChemoB-NAD and ChemoG-NAD normalized to 1 at t = 0 min (n = 25 cells from 2 biological replicates). d. Confocal images of U-2 OS cells co-expressing ChemoB-NAD and ChemoG-NAD in the nucleus (NLS) and mitochondria, respectively. Shown are the FRET/FP ratio images for each sensor in pseudocolor (LUT = mpl-viridis). Addition of 100 μM MNNG to the cells is indicated with an arrow (after t = 15 min). Scale bars = 25 μm. Source data
Extended Data Fig. 9
Extended Data Fig. 9. Engineering and characterization of intensiometric and fluorescence lifetime-based sensors.
a. Schematic representation of intensiometric readout of ChemoG-NAD based on the labeled fluorophore. Closing of the sensor changes the environment of the rhodamine fluorophore and might thereby affect its photophysical properties. b. NAD+ titration of intensiometric ChemoG-NADSiR biosensor. Plotted are the fluorescence intensities (FI) of directly excited SiR labeled to ChemoG-NAD. The fluorescence intensity of HT7 labeled with SiR in presence of 1 mM NAD+ is indicated with a dotted line. c. Fluorescence intensity (FI) emission spectra of SiR-labeled ChemoG-NAD (left) or HT7 (right) at different NAD+ concentrations. Shown are the means of 3 technical replicates. d, e. Titrations of ChemoG-CaM (d) and ChemoG-ATP (e) biosensors labeled with SiR. Plotted are the fluorescence intensity changes (ΔFI/FI0) of directly excited SiR. f, g. NAD+ titrations of intensiometric NAD+ biosensors labeled with SiR. Plotted are the fluorescence intensities (FI) of directly excited SiR (f) or the change in fluorescence intensity of SiR (ΔFI/FI0, g). The fluorescence intensity of HT7 labeled with SiR in presence of 1 mM NAD+ is indicated with a dotted line. h-k. NAD+ titrations of fluorescence lifetime-based NAD+ biosensors labeled with SiR (h, i), CPY (j) or JF635 (k).Plotted are the intensity-weighted average fluorescence lifetimes (τ, h, j, k) or the change in τ (Δτ, i) of the directly excited fluorophores. The fluorescence lifetime of HT7 labeled with SiR in presence of 1 mM NAD+ is indicated with a dotted line in h. l-o. Time course measurements of ChemoD-NAD fluorescence intensity (FI) (l, n) or intensity-weighted average fluorescence lifetime (m, o) in U-2 OS cells labeled either with SiR (l, m) or JF635 (n, o). FI was normalized to 1 at t = 0 min. Represented are the means (solid line) plus traces of single cells (dim lines). Addition of 100 μM MNNG is indicated with an arrow. n = 44 cells from two independent experiments (l), n = 37 cells from two independent experiments (m), n = 53 cells from 2 independent experiments (n), n = 19 cells from one experiment (o). For all titrations, the mean ±s.d. from 3 technical replicates are represented. Source data
Extended Data Fig. 10
Extended Data Fig. 10. Engineering and characterization of ChemoL sensors.
a, b. BRET-FRET/eGFP ratios of ChemoL-NADCPY expressed in the nucleus (a) or the mitochondria (b) of U-2 OS cells upon treatment for 24 h with DMSO (Ctrl), 1 mM NR, 100 nM FK866 or 100 nM FK866 plus 1 mM NR. Represented are the BRET-FRET/eGFP ratios of single wells (circle) and means ±s.d. (black line) (n = 6 wells from a single experiment). p-values are given based on unpaired two-tailed t-test with Welch’s correction (**** p < 0.0001, ** p = 0.0041, ns p = 0.5718). c, e. Luminescent intensity (LI) spectra of ChemoL-CaM (c) or ChemoL-ATP (e) at different concentrations of calcium and ATP, respectively. The spectra were normalized to the isosbestic point at 593 nm. Constructs were labeled with CPY. Shown are the means of 3 technical replicates. d, f. Analyte titrations of ChemoL-CaM (d) and ChemoL-ATP (f) labelled with CPY. Shown are the mean ±s.d. of BRET-FRET/eGFP ratios (n = 3 technical replicates). Indicated are also the maximum BRET-FRET/eGFP ratio changes (MaxΔR/R0). Source data

References

    1. Greenwald EC, Mehta S, Zhang J. Genetically encoded fluorescent biosensors illuminate the spatiotemporal regulation of signaling networks. Chem. Rev. 2018;118:11707–11794. - PMC - PubMed
    1. Nasu Y, Shen Y, Kramer L, Campbell RE. Structure- and mechanism-guided design of single fluorescent protein-based biosensors. Nat. Chem. Biol. 2021;17:509–518. - PubMed
    1. Thestrup T, et al. Optimized ratiometric calcium sensors for functional in vivo imaging of neurons and T lymphocytes. Nat. Methods. 2014;11:175–182. - PubMed
    1. Beltran J, et al. Rapid biosensor development using plant hormone receptors as reprogrammable scaffolds. Nat. Biotechnol. 2022;40:1855–1861. - PMC - PubMed
    1. Feng J, et al. A general strategy to construct small molecule biosensors in eukaryotes. eLife. 2015;4:e10606. - PMC - PubMed

Publication types

MeSH terms