. 2023 Jun 8;14(1):3375.
doi: 10.1038/s41467-023-39097-x.

ALPL-1 is a target for chimeric antigen receptor therapy in osteosarcoma

Affiliations

ALPL-1 is a target for chimeric antigen receptor therapy in osteosarcoma

Nadia Mensali et al. Nat Commun. .

Abstract

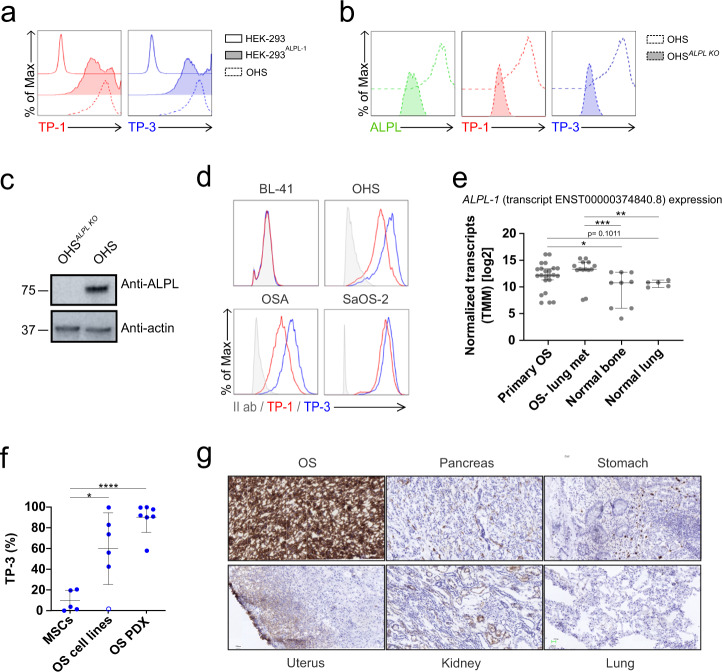
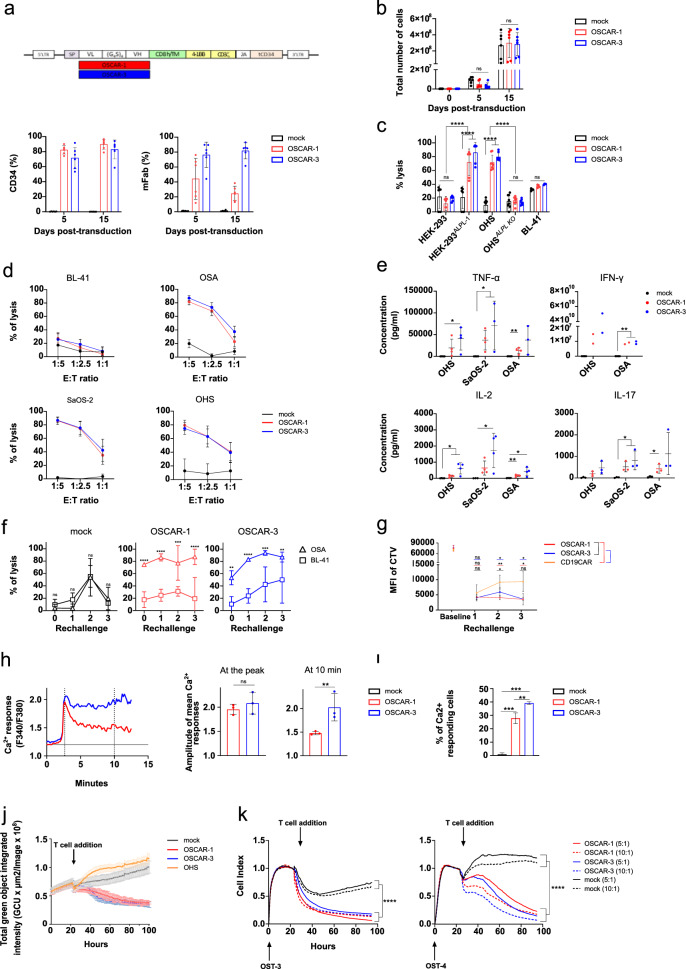
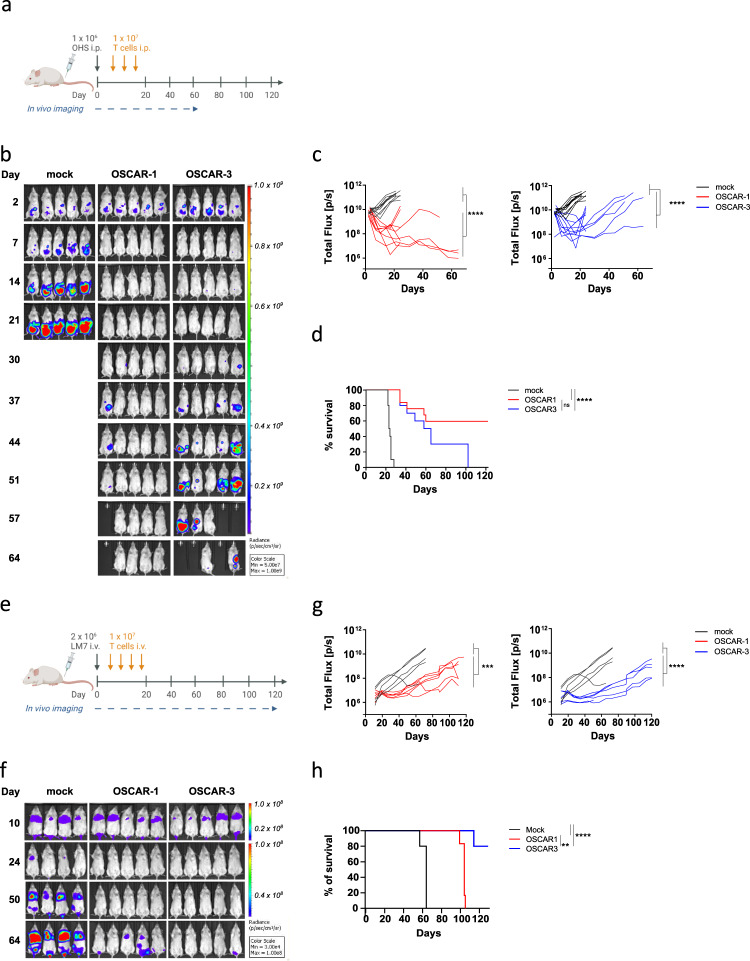
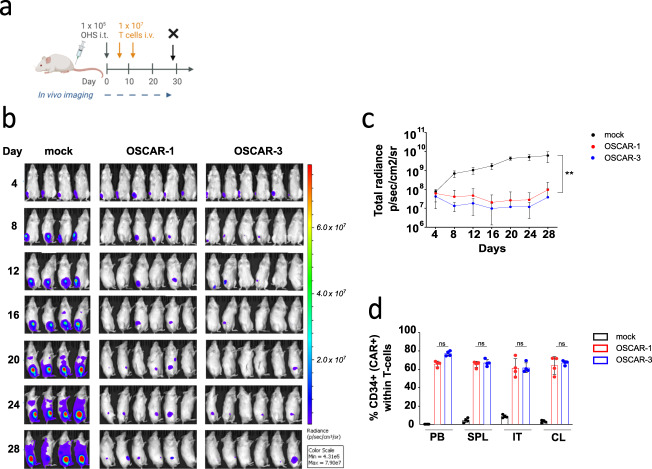
Osteosarcoma (OS) remains a dismal malignancy in children and young adults, with poor outcome for metastatic and recurrent disease. Immunotherapies in OS are not as promising as in some other cancer types due to intra-tumor heterogeneity and considerable off-target expression of the potentially targetable proteins. Here we show that chimeric antigen receptor (CAR) T cells could successfully target an isoform of alkaline phosphatase, ALPL-1, which is highly and specifically expressed in primary and metastatic OS. The target recognition element of the second-generation CAR construct is based on two antibodies, previously shown to react against OS. T cells transduced with these CAR constructs mediate efficient and effective cytotoxicity against ALPL-positive cells in in vitro settings and in state-of-the-art in vivo orthotopic models of primary and metastatic OS, without unexpected toxicities against hematopoietic stem cells or healthy tissues. In summary, CAR-T cells targeting ALPL-1 show efficiency and specificity in treating OS in preclinical models, paving the path for clinical translation.


Conflict of interest statement

S.W., E.M.I., and Ø.B. are inventors of the patent WO2020127734. A.M.G. and A.D.D. were not employees of Glycostem Therapeutics B.V. when their contribution for this study was performed. I.G. was not employee of Thermo Fisher Scientific when is contribution for this study was performed. P.M. is cofounder on OneChain Immunotherapeutics, a Josep Carreras Leukemia Research Institute spin-off company. The remaining authors declare no competing interests.

Figures

Fig. 1
Fig. 1. TP antibody characterization.
a Representative TP-1 (left) and TP-3 (right) flow histograms for wild-type HEK-293 (top), HEK-293 transfected with ALPL-1 cDNA (HEK-293ALPL-1) (middle), and OHS cells (bottom). b Representative ALPL (left), TP-1 (middle) and TP-3 (right) flow histograms for ALPL knock out OHS (OHSALPL KO) and parental OHS. c Western Blotting of OHSALPL KO cells shown in b to confirm ALPL knock out. Source data are provided as a Source Data file. d Representative TP-1 (red) and TP-3 (blue) flow histograms for OS tumor cell lines OHS, OSA and SaOS-2. BL-41 cells (TP negative target). Secondary antibody control (grey). e Expression of ALPL-1 transcript ENST00000374840.8 in primary (n = 9) and metastatic (met) OS (n = 5), and in normal bone (n = 24) and lung tissues (n = 14). Counts were normalized by Trimmed mean of M values (TMM) method prior to log2 transformation. Statistical comparison was performed using two-tailed Mann-Whitney test. (ns, not significant p > 0.05, *p = 0.0376, **p < 0.01, ***p < 0.001). Data are presented as median with 95% confidence interval. f Flow cytometry ALPL-1 protein expression in MSCs, OS cell lines (143B, G-292, U2OS, OST-3, MG-63 and SAOS-2) and PDXs (n = 7) detected with TP-3 antibody. U2OS is open circle. Data are shown as mean ± s.d. Statistical comparisons were performed with two-tailed unpaired Student t-test (ns not significant p > 0.05, *p < 0.05, ****p < 0.0001). g Immunohistochemistry staining for ALPL-1 using TP-3 antibody on osteosarcoma (OS) and normal tissues (pancreas, stomach, uterus, lung and kidney). Images 20X, 25 micron bar.
Fig. 2
Fig. 2. OSCAR T cell characterization.
a Design of OSCAR CAR construct(top). Quantification of CD34 and mFab expression of OSCAR-1 and OSCAR-3 in primary T cells (bottom). Data are presented as percentage of CD34+ and mFab+ cells ± s.d. pooled from six donors (n = 6). b Quantification of OSCAR-1 and OSCAR-3 T cell expansion. Average of the absolute cell counts taken on day 0, 5 and 10 following CD3/CD28 bead expansion. Data pooled from three independent experiments on six donors (n = 6). Statistical comparisons performed by two-way ANOVA with Tukey’s multiple comparison test (ns not significant p > 0.05). c Cytotoxicity of OSCAR-1 and OSCAR-3 against ALPL-1 positive cells using a bioluminescence assay (BLI) measured at 6 h. CAR T cells from three donors (n = 3) and biological duplicates were used. Statistical comparisons performed using two-way ANOVA with Tukey’s multiple comparison test (ns not significant p > 0.05, ****p < 0.0001). d Cytotoxicity of OSCAR-1 and OSCAR-3 by BLI measured at 10 h at different E:T ratios (BL-41 negative control). Four independent experiments were pooled (n = 4). e Cytokine secretion upon overnight co-culture with ALPL positive cells. (n = 4 for all except IFN-y n = 2). SaOS-2 IFN-γ values were out of range for all separated experiments and were removed. Statistical comparisons obtained by two-tailed unpaired Student t-test (ns not significant p > 0.05, *p < 0.05, **p < 0.01). f Cytotoxicity of OSCAR-1 and OSCAR-3 upon repeated antigen stimulation (three). Data pooled from three donors (n = 3). Statistical comparisons performed with two-way ANOVA (ns not significant p > 0.05, *p < 0.05, **p < 0.01, ***p < 0.001, ****p < 0.0001). g Proliferation of Cell Trace Violet (CTV)-labelled T cells (OSCARs,CD19CAR) upon repeated stimulation with ALPL positive targets (HEK-293ALPL-1). Data pooled from four donors (n = 4). Statistical comparisons performed with two-tailed paired Student t-test (ns not significant p > 0.05, *p < 0.05, **p < 0.01). h Ca2+response of OSCARs upon contact with ALPL positive cells. Ca2+ levels are plotted against time (minutes) (left). Basal Ca2+ levels are indicated by a black line at “1.2” on the y-axis from mock T cells. Amplitude of Ca2+ responses (right) at the peak and at 10 min. i Quantification of Ca2+ responding OSCAR-1 and OSCAR-3 T cells. h, i, Data pooled from three experiments (n = 3). From 50 to 75 cells were counted per condition. p values obtained by two-tailed unpaired Student t-test (ns not significant p > 0.05, **p < 0.01). j Live cytotoxicity of OSCAR-1 and OSCAR-3 T cells against OHS spheroids using Incucyte. Cytotoxicity measured as loss of green fluorescence in GFP+ spheroids. Data are mean ± s.d. of sextuplicates. Data are from one representative experiment. Two independent experiments were performed (n = 2). k Cytotoxicity of OSCAR-1, OSCAR-3 on primary OS (OST-3 and OST-4) measured by xCELLigence at two E:T ratios (10:1; 5:1). Data pooled from three experiments (n = 3). Statistical comparisons were performed with one-way ANOVA test with Tukey’s post hoc test (ns not significant p > 0.05, ****p < 0.0001). For (ah, and kl), data are mean ± s.d.
Fig. 3
Fig. 3. OSCAR-1 and OSCAR-3 efficiently control tumor growth in xenograft OS models.
a Experimental overview of OHS OS model. NSG mice were engrafted with GFP/Luc+ OHS cells i.p. On day 3 mice were randomized and received 3 rounds of i.p. injections of OSCAR-1, OSCAR-3, or mock transduced T cells. b Tumor burden measured by IVIS. Representative BLI images of the luminescent signal from each treatment group. c Quantification of tumor progression for each individual mouse measured by flux values acquired via BLI. OSCAR-1 vs mock T cells (left) and OSCAR-3 vs mock T cells (right). Two independent experiments of five mice per group were pooled (n = 10). Each line represents one individual mouse. Two-way ANOVA with Tukey’s multiple comparison test was used to calculate p values (ns not significant p > 0.05, ****P < 0.0001). d Kaplan-Meier survival curves analyzed using a Mantel-Cox (log-rank) test (ns not significant p > 0.05, ****p < 0.0001). e Experimental overview of LM7 OS lung model. NSG mice were engrafted with GFP/Luc+ LM7 cells i.v. On day 10 mice were randomized and received 4 i.v. injections of OSCAR-1, OSCAR-3, or mock T cells. f Representative BLI images of the luminescent signal are shown from each treatment group. g Quantification of tumor progression for each individual mouse measured by flux values acquired via BLI as in (c). One experiment is shown (n = 5 per group). Two-way ANOVA with Tukey’s multiple comparison test was used to calculate p values (ns not significant p > 0.05, ***p < 0.001, ****p < 0.0001). Representative of two separate experiments. h Kaplan-Meier survival curves analyzed with a Mantel-Cox (log-rank) test (ns not significant p > 0.05, **p < 0.01,****P < 0.0001).
Fig. 4
Fig. 4. OSCAR-1 and OSCAR-3 efficiently control tumor growth in xenograft orthotopic OS model.
a Experimental overview of OHS orthotopic OS model. NSG mice were engrafted with GFP/Luc+ OHS cells implanted within the tibiae (intra-tibial, i.t.). Mice received two doses of OSCAR-1, OSCAR-3, or mock T cells and were sacrificed at day 28 (X). b Tumor burden measured by IVIS. Representative BLI images of the luminescent signal from each treatment group. c Quantification of tumor progression as mean ± s.d. per treatment group. Statistical comparisons were performed with one-way ANOVA test with Tukey’s multiple comparison test (ns not significant p > 0.05, **p < 0.01). Representative experiment is shown (OSCAR-1 n = 6 mice, OSCAR-3 n = 6 mice, mock n = 4 mice). d Detection of OSCAR-1, OSCAR-3, and mock T cells in peripheral blood (PB), spleen (SPL), intra tibia (IT) and collateral tibia (CL) from mice sacrificed on day 28 (n = 4 per group). Data are presented as mean ± s.d. Statistical comparisons were performed with one-way ANOVA test with Tukey’s multiple comparison test (ns not significant P > 0.05).
Fig. 5
Fig. 5. OSCAR T cell safety assessments.
a, b OSCAR T cell cytotoxic activity measured as TNFα production and expression on CD8 (top) and CD4 (bottom) T cells upon co-culture with different normal tissues. TNFα expression is detected by flow cytometry intracellular staining at 6 h co-incubation at an E:T ratio of 1:2. a OSCAR T cell cytotoxicity against human MSCs and MSC-derived osteoblasts at different stages of differentiation. Data are mean ± s.d. pooled from three independent experiments (n = 3). OSCAR T cells are from three healthy donors. Human MSC are from two donors. Statistical comparisons were performed with two-way ANOVA with Tukey’s multiple comparison test (ns not significant p > 0.05, *p < 0.05, ****p < 0.0001). b OSCAR-1 and OSCAR-3 T cell reactivity against healthy tissue cells representing lung (MRC-5, Hulec-5a, HPAEpiC), liver (HH), and kidney (HREpC). Data are mean ± s.d. pooled from three independent experiments (n = 3). OSCAR T cells are from three healthy donors. Statistical comparisons were performed with two-way ANOVA with Tukey’s multiple comparison test (ns not significant p > 0.05, ****p < 0.0001). c ALPL and TP-3 protein expression in different tumor cell lines from osteosarcoma (OHS, OSA, SaOS-2, LM7, U2OS), other tumors (MCF-7, MDA-MB-231, SK-OV-3, HeLa, HCT116, Caco-2, LS174T, U87, U251, U251mg, EBV-LCL, Rec-1, U-2932, BL-41, K562, THP-1, PANC-1, HEK, PC-3) and cells from different healthy tissues (BJ, HUVEC), distinct cell types from PBMCs (n = 3), and BM (n = 3, except HSCs n = 1). Results were normalized by the ratio between the Mean Fluorescence Intensity (MFI) obtained after staining with ALPL (green) or TP-3 (blue) and that of the appropriate control, before log2 transformation. U2OS is empty circle. d OSCAR-1 and OSCAR-3 T cell reactivity versus hematopoietic stem and progenitor cells (HST) from healthy bone marrow by colony-forming unit (CFU) assay. OSCAR T cells and HST were co-cultured at a 10:1 E:T ratio. Data represents the number of counted colonies; white, red, and total (mixed) colonies. Data are shown as mean ± s.d. pooled from two independent experiments with two donors (n = 2).

References

    1. Stiller CA, et al. Descriptive epidemiology of sarcomas in Europe: report from the RARECARE project. Eur. J. Cancer. 2013;49(3):684–695. doi: 10.1016/j.ejca.2012.09.011. - DOI - PubMed
    1. Eaton, B. R. et al. Osteosarcoma. Pediatr. Blood Cancer68, e28352 (2021). - PubMed
    1. Smeland S, et al. Survival and prognosis with osteosarcoma: outcomes in more than 2000 patients in the EURAMOS-1 (European and American Osteosarcoma Study) cohort. Eur. J. Cancer. 2019;109:36–50. doi: 10.1016/j.ejca.2018.11.027. - DOI - PMC - PubMed
    1. Bruland ØS, Pihl A. On the current management of osteosarcoma. A critical evaluation and a proposal for a modified treatment strategy. Eur. J. Cancer. 1997;33(11):1725–1731. doi: 10.1016/S0959-8049(97)00252-9. - DOI - PubMed
    1. Carrle D, Bielack S. Osteosarcoma lung metastases detection and principles of multimodal therapy. Pediatr. Adolesc. Osteosarcoma. 2009;152:165–184. doi: 10.1007/978-1-4419-0284-9_8. - DOI - PubMed

Publication types