. 2023 Jun;29(6):1476-1486.
doi: 10.1038/s41591-023-02383-8. Epub 2023 Jun 8.

Alcohol consumption and risks of more than 200 diseases in Chinese men

Collaborators, Affiliations

Alcohol consumption and risks of more than 200 diseases in Chinese men

Pek Kei Im et al. Nat Med. 2023 Jun.

Abstract

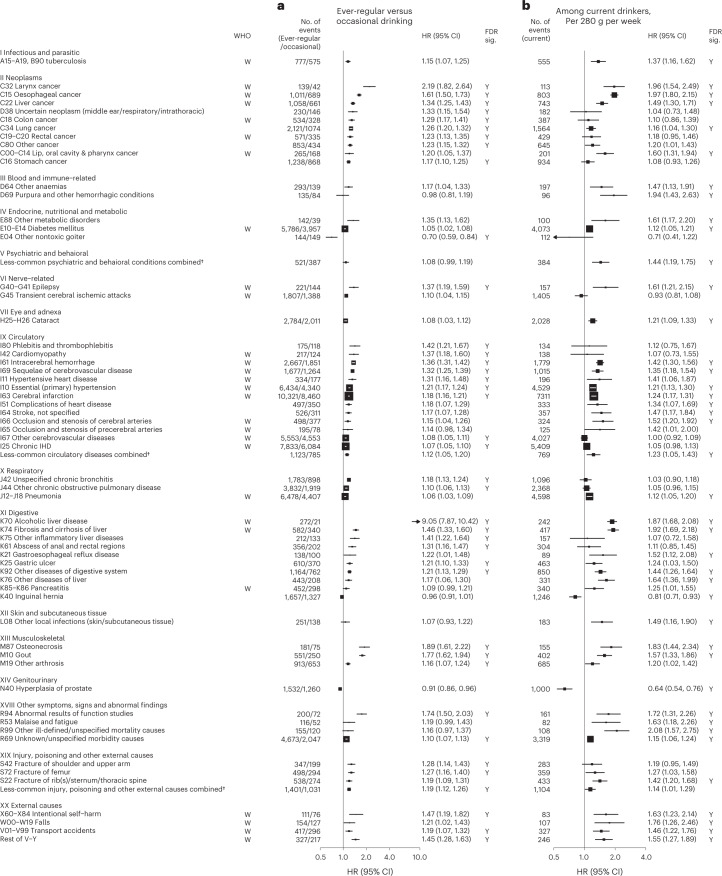
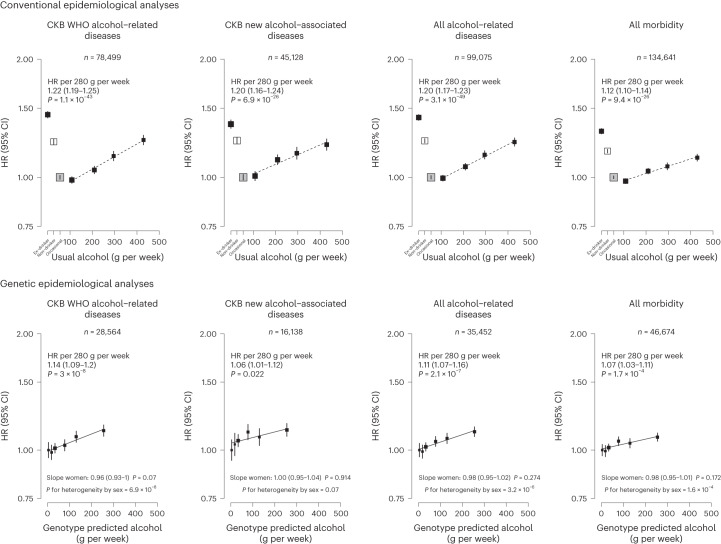
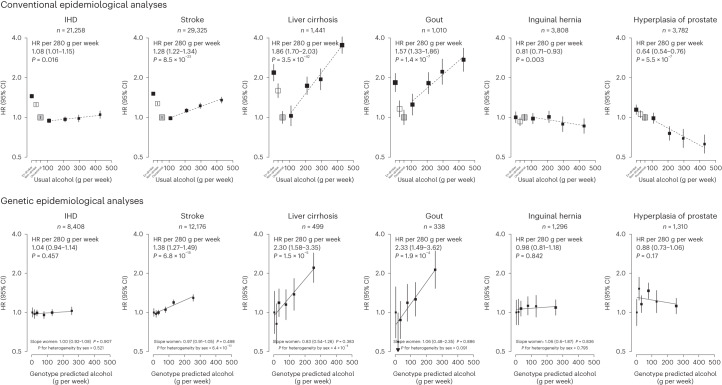
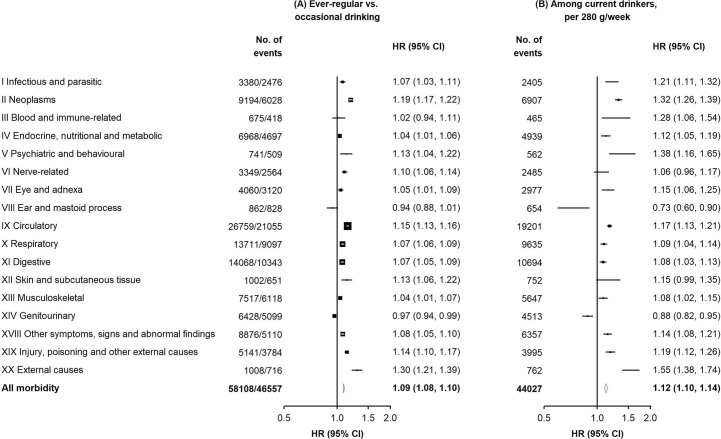
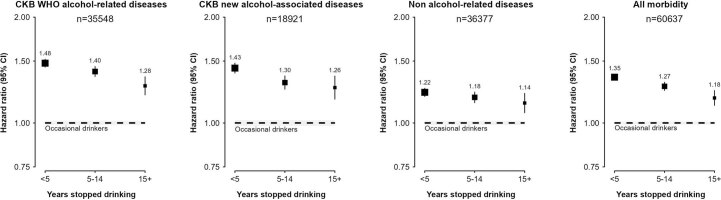
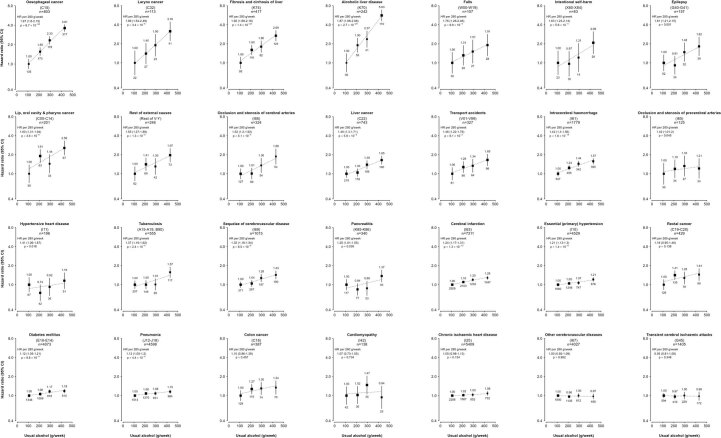
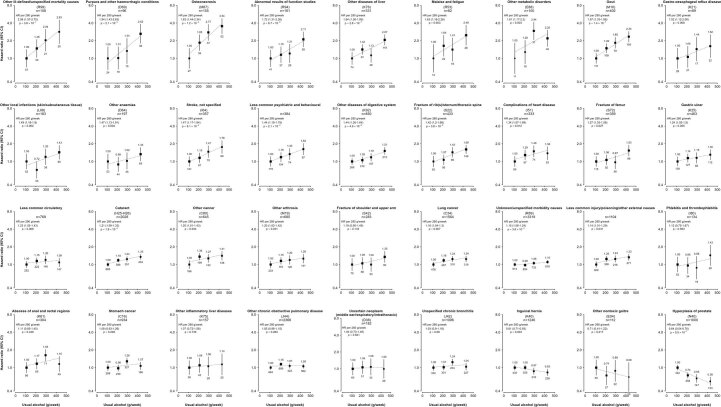
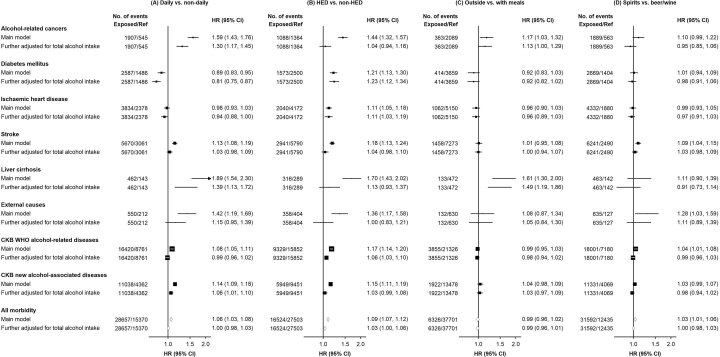
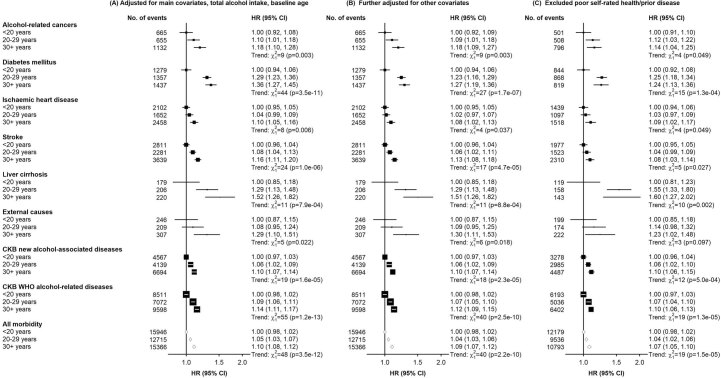
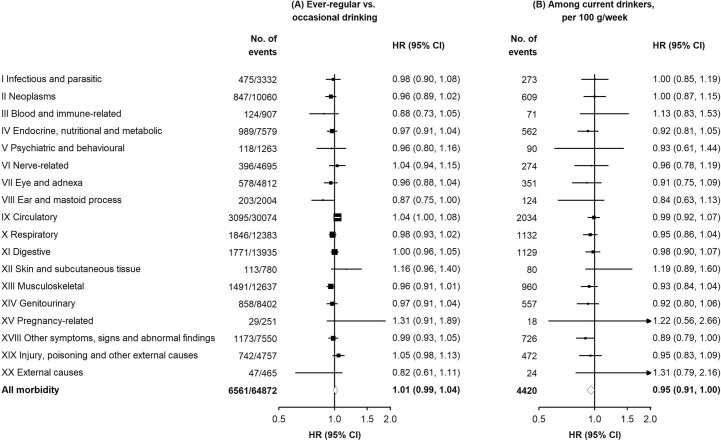
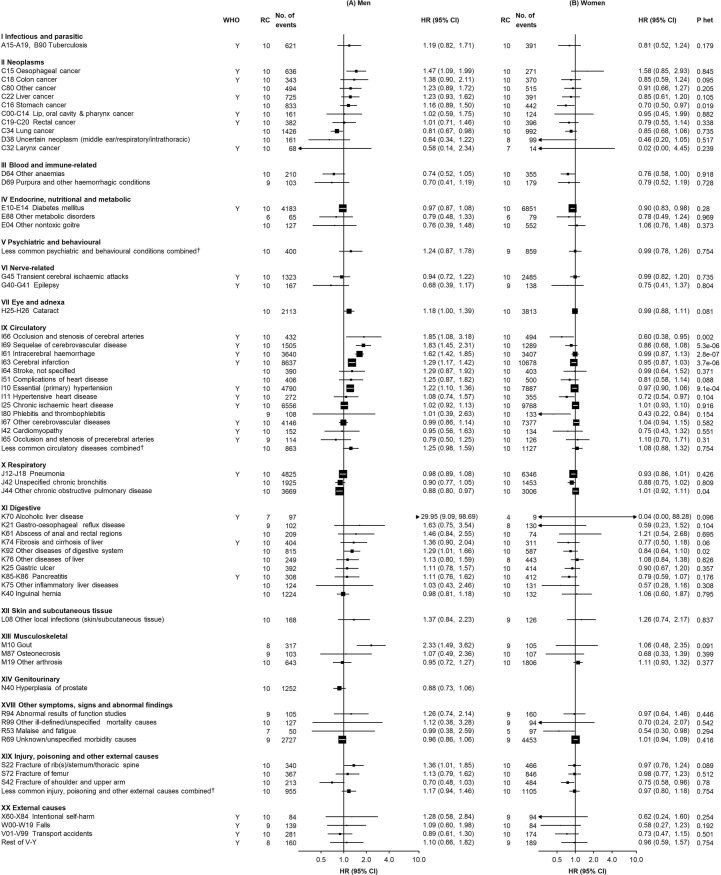
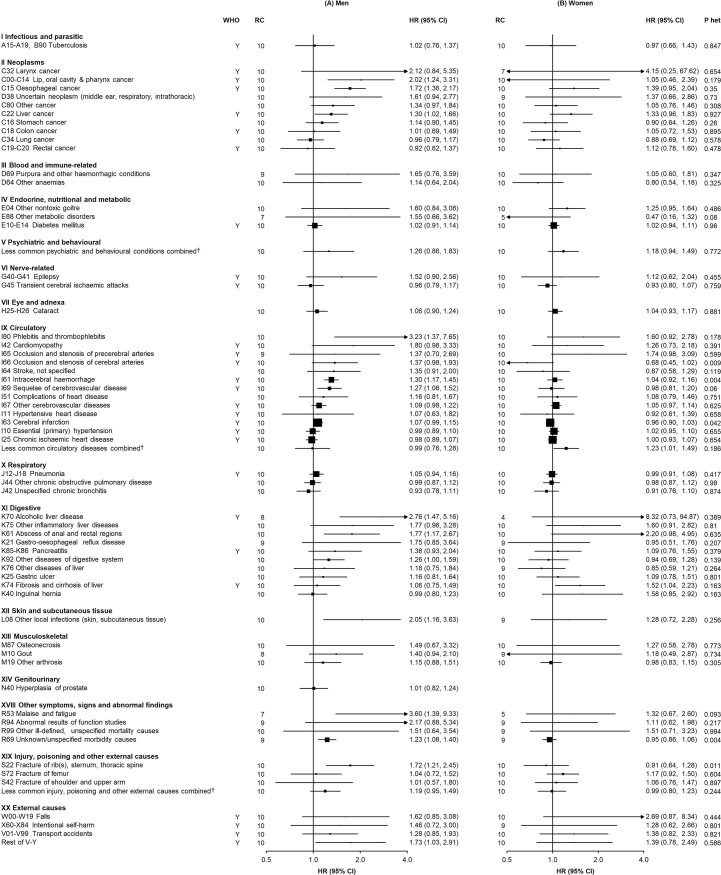
Alcohol consumption accounts for ~3 million annual deaths worldwide, but uncertainty persists about its relationships with many diseases. We investigated the associations of alcohol consumption with 207 diseases in the 12-year China Kadoorie Biobank of >512,000 adults (41% men), including 168,050 genotyped for ALDH2- rs671 and ADH1B- rs1229984 , with >1.1 million ICD-10 coded hospitalized events. At baseline, 33% of men drank alcohol regularly. Among men, alcohol intake was positively associated with 61 diseases, including 33 not defined by the World Health Organization as alcohol-related, such as cataract (n = 2,028; hazard ratio 1.21; 95% confidence interval 1.09-1.33, per 280 g per week) and gout (n = 402; 1.57, 1.33-1.86). Genotype-predicted mean alcohol intake was positively associated with established (n = 28,564; 1.14, 1.09-1.20) and new alcohol-associated (n = 16,138; 1.06, 1.01-1.12) diseases, and with specific diseases such as liver cirrhosis (n = 499; 2.30, 1.58-3.35), stroke (n = 12,176; 1.38, 1.27-1.49) and gout (n = 338; 2.33, 1.49-3.62), but not ischemic heart disease (n = 8,408; 1.04, 0.94-1.14). Among women, 2% drank alcohol resulting in low power to assess associations of self-reported alcohol intake with disease risks, but genetic findings in women suggested the excess male risks were not due to pleiotropic genotypic effects. Among Chinese men, alcohol consumption increased multiple disease risks, highlighting the need to strengthen preventive measures to reduce alcohol intake.


Conflict of interest statement

The authors declare no competing interests.

Figures

Fig. 1
Fig. 1. Adjusted HRs for specific diseases showing significant associations with alcohol consumption by ICD-10 chapters, in men.
Cox models (a) comparing ever-regular drinkers with occasional drinkers or (b) assessing the dose–response per 280 g per week higher usual alcohol intake within current drinkers, were stratified by age at risk and study area and were adjusted for education and smoking. Each solid square represents HR with the area inversely proportional to the variance of the log HR. The horizontal lines indicate 95% CIs. Diseases considered to be alcohol-related by the WHO are indicated with ‘W’ under the ‘WHO’ column. The individual diseases listed included all that showed FDR-adjusted significant associations with alcohol (FDR-adjusted P < 0.05, indicated with ‘Y’ under the ‘FDR sig.’ column) and WHO alcohol-related diseases that showed nominally significant associations with alcohol (P < 0.05). All P values are two-sided. † Included less-common ICD-10 codes within the corresponding ICD-10 chapter that were not individually investigated in the present study. ‘Less-common psychiatric and behavioral conditions’ consisted of ICD-10 codes F00–F99, excluding F32, F33 and F99. ‘Less-common circulatory diseases’ consisted of ICD-10 codes I00–I99, excluding I10, I11, I20, I21, I24, I25, I27, I42, I46, I48–I51, I60–I67, I69, I70, I80 and I83. ‘Less-common injury, poisoning and other external causes’ consisted of ICD-10 codes S00–T98, excluding S06, S09, S22, S32, S42, S52, S62, S72, S82, S92 and T14.
Fig. 2
Fig. 2. Associations of alcohol-related diseases and overall morbidity with self-reported alcohol intake and with genotype-predicted mean alcohol intake, in men.
Each box represents HR with the area inversely proportional to the variance of the group-specific log hazard within subplot. The vertical lines indicate group-specific 95% CIs. Conventional epidemiological analyses relate self-reported drinking patterns to risks of diseases (reference group is occasional drinkers), using Cox models stratified by age at risk and study area and adjusted for education and smoking. Within current drinkers, HRs were plotted against usual alcohol intake and were calculated per 280 g per week higher usual alcohol intake. Genetic epidemiological analyses relate genetic categories to risks of diseases (reference group is the genotype group with lowest genotype-predicted mean male alcohol intake), using Cox models stratified by age at risk and study area and adjusted for genomic principal components. The HR per 280 g per week higher genotype-predicted mean male alcohol intake was calculated from the inverse-variance-weighted mean of the slopes of the fitted lines in each study area. The corresponding slopes in women were summarized in text and the slopes of the fitted line by sex were compared and assessed for heterogeneity using chi-squared tests (indicated by P for heterogeneity by sex). All P values are two-sided. Analyses of these aggregated outcomes were based on first recorded event of the aggregate during follow-up and participants may have had multiple events of different types of diseases. ‘All alcohol-related diseases’ includes the first recorded event from ‘CKB WHO alcohol-related diseases’ or ‘CKB new alcohol-associated diseases’ during follow-up.
Fig. 3
Fig. 3. Associations of selected alcohol-related diseases with self-reported alcohol intake and with genotype-predicted mean alcohol intake, in men.
Each box represents HR with the area inversely proportional to the variance of the group-specific log hazard within subplot. The vertical lines indicate group-specific 95% CIs. Conventional epidemiological analyses relate self-reported drinking patterns to risks of diseases (reference group is occasional drinkers), using Cox models stratified by age at risk and study area and adjusted for education and smoking. Within current drinkers, HRs were plotted against usual alcohol intake and were calculated per 280 g per week higher usual alcohol intake. Genetic epidemiological analyses relate genetic categories to risks of diseases (reference group is the genotype group with lowest genotype-predicted mean male alcohol intake), using Cox models stratified by age at risk and study area and adjusted for genomic principal components. The HR per 280 g per week higher genotype-predicted mean male alcohol intake was calculated from the inverse-variance-weighted mean of the slopes of the fitted lines in each study area. The corresponding slopes in women were summarized in text and the slopes of the fitted line by sex were compared and assessed for heterogeneity using chi-squared tests (indicated by P for heterogeneity by sex). All P values are two-sided. Corresponding ICD-10 codes, IHD (I20–I25); stroke (I60, I61, I63 and I64); liver cirrhosis (K70 and K74); gout (M10); inguinal hernia (K40); hyperplasia of prostate (N40).
Extended Data Fig. 1
Extended Data Fig. 1. Adjusted HRs for ICD−10 chapter−specific morbidities associated with ever-regular drinking and with usual alcohol intake, in men.
Cox models comparing ever-regular drinkers with occasional drinkers, or assessing the dose–response per 280 g/week higher usual alcohol intake within current drinkers, were stratified by age-at-risk and study area and adjusted for education and smoking. Each solid square or diamond represents HR with the area inversely proportional to the variance of the log HR. The horizontal lines indicate 95% CIs. CI, confidence interval; HR hazard ratio; ICD-10, International Classification of Diseases, 10th Revision.
Extended Data Fig. 2
Extended Data Fig. 2. Adjusted HRs for different aggregated and all-cause morbidities associated with years after stopping drinking, in men.
Cox models comparing ex-drinker groups with occasional drinkers were stratified by age-at-risk and study area and were adjusted for education and smoking. Each box represents HR with the area inversely proportional to the variance of the group-specific log hazard within subplot. The vertical lines indicate group-specific 95% CIs for various ex-drinker groups. The shaded strip indicate the group-specific 95% CIs for occasional drinkers. The numbers above the error bars are point estimates for HRs. CI, confidence interval; HR hazard ratio; CKB, China Kadoorie Biobank; WHO, World Health Organization.
Extended Data Fig. 3
Extended Data Fig. 3. Associations of alcohol consumption with risks of 28 diseases previously defined as alcohol-related by the WHO, in male current drinkers.
Cox models were stratified by age-at-risk and study area and were adjusted for education and smoking. HRs were plotted against usual alcohol intake and were calculated per 280 g/week higher usual alcohol intake. All specific diseases displayed were significantly associated with alcohol intake (ever-regular drinking or per 280 g/week higher usual alcohol intake) after multiple testing correction (FDR-adjusted p<0.05), except transient cerebral ischemic attacks and related syndromes (ICD-10 code: G45), occlusion and stenosis of precerebral arteries (I65) and pancreatitis (K85-K86) which showed statistical significance at nominal level (p<0.05). Each box represents HR with the area inversely proportional to the variance of the group-specific log hazard within subplot. The vertical lines indicate group-specific 95% CIs. The numbers above the error bars are point estimates for HRs and the numbers below are number of events. All P values are two-sided. CI, confidence interval; HR hazard ratio; CKB, China Kadoorie Biobank; FDR, false discovery rate; ICD-10, International Classification of Diseases, 10th Revision; WHO, World Health Organization.
Extended Data Fig. 4
Extended Data Fig. 4. Associations of alcohol consumption with risks of 36 diseases not previously defined as alcohol-related, in male current drinkers.
Cox models were stratified by age-at-risk and study area and were adjusted for education and smoking. HRs were plotted against usual alcohol intake and were calculated per 280 g/week higher usual alcohol intake. All specific diseases displayed were significantly associated with alcohol intake (ever-regular drinking or per 280 g/week higher usual alcohol intake) after multiple testing correction (FDR-adjusted p<0.05). Each box represents HR with the area inversely proportional to the variance of the group-specific log hazard within subplot. The vertical lines indicate group-specific 95% CIs. The numbers above the error bars are point estimates for HRs and the numbers below are number of events. All P values are two-sided. CI, confidence interval; HR hazard ratio; CKB, China Kadoorie Biobank; FDR, false discovery rate.
Extended Data Fig. 5
Extended Data Fig. 5. Adjusted HRs for major diseases associated with drinking patterns, in male current drinkers.
Cox models were stratified by age-at-risk and study area and were adjusted for education and smoking and for total alcohol intake where indicated. Each solid square or diamond represents HR with the area inversely proportional to the variance of the log HR. The horizontal lines indicate 95% CIs. CI, confidence interval; HR hazard ratio; HED, heavy episodic drinking; CKB, China Kadoorie Biobank; WHO, World Health Organization.
Extended Data Fig. 6
Extended Data Fig. 6. Adjusted HRs for major diseases associated with duration of drinking, in male current drinkers.
Cox models were stratified by age-at-risk and study area and were adjusted for education, smoking, total alcohol intake and baseline age in (A). (B) had the same model specifications as (A) plus further adjustments for income, physical activity, fruit intake and body mass index. (C) had the same model specifications as (A) and excluded participants with poor self-reported health or prior chronic disease at baseline. Each box represents HR with the area inversely proportional to the variance of the group-specific log hazard. The horizontal lines indicate group-specific 95% CIs. All P values are two-sided. CI, confidence interval; HR hazard ratio; CKB, China Kadoorie Biobank; WHO, World Health Organization.
Extended Data Fig. 7
Extended Data Fig. 7. Adjusted HRs for ICD−10 chapter−specific morbidities associated with ever-regular drinking and with usual alcohol intake, in women.
Cox models comparing ever-regular drinkers with occasional drinkers, or assessing the dose–response per 100 g/week higher usual alcohol intake within current drinkers, were stratified by age-at-risk and study area and adjusted for education and smoking. Each solid square or diamond represents HR with the area inversely proportional to the variance of the log HR. The horizontal lines indicate 95% CIs. CI, confidence interval; HR hazard ratio; ICD-10, International Classification of Diseases, 10th Revision.
Extended Data Fig. 8
Extended Data Fig. 8. Adjusted HRs per 280 g/week higher genotype-predicted mean male alcohol intake for specific alcohol-associated diseases by ICD-10 chapters, in men and women.
Cox modes, stratified by age-at-risk and adjusted for genomic principal components, were used to relate genetic categories to risks of diseases within each study area. The HR per 280 g/week higher genotype-predicted mean male alcohol intake was calculated from the inverse-variance-weighted mean of the slopes of the fitted lines in each study area. Each solid square or diamond represents HR per 280 g/week higher genetically-predicted mean male alcohol intake, with the area inversely proportional to the variance of the log HR. The horizontal lines indicate 95% CIs. Diseases considered to be alcohol-related by the WHO are indicated with ‘Y’ under the ‘WHO’ column. The ‘RC’ column indicates the number of study areas that contributed to the overall area-stratified genotypic associations, as for certain less common diseases some study areas may not have enough number of cases to contribute to the inverse-variance-weighted meta-analysis. The ‘P het’ column indicates the p-value from a χ2 test for heterogeneity between sexes. All P values are two-sided. † Included less common ICD-10 codes within the corresponding ICD-10 chapter which were not individually investigated in the present study. CI, confidence interval; HR hazard ratio; ICD-10, International Classification of Diseases, 10th Revision; WHO, World Health Organization.
Extended Data Fig. 9
Extended Data Fig. 9. Adjusted HRs associated with GG versus AG genotype of ALDH2-rs671 for specific alcohol-associated diseases by ICD-10 chapters, in men and women.
Area-specific genotypic effects (GG vs. AG genotype) were estimated within each study area (thus each reflecting the purely genotypic effects) using age-at-risk-stratified and genomic principal components-adjusted Cox models and were combined by inverse-variance-weighted meta-analysis to yield the overall area-stratified genotypic associations. Each solid square represents HR for GG vs. AG genotype, with the area inversely proportional to the variance of the log HR. The horizontal lines indicate 95% CIs. Diseases considered to be alcohol-related by the WHO are indicated with ‘Y’ under the ‘WHO’ column. The ‘RC’ column indicates the number of study areas that contributed to the overall area-stratified genotypic associations, as for certain less common diseases some study areas may not have enough number of cases to contribute to the inverse-variance-weighted meta-analysis. The ‘P het’ column indicates the P value from a χ2 test for heterogeneity between sexes. All P values are two-sided. † Included less common ICD-10 codes within the corresponding ICD-10 chapter which were not individually investigated in the present study. CI, confidence interval; HR hazard ratio; ICD-10, International Classification of Diseases, 10th Revision; WHO, World Health Organization.
Extended Data Fig. 10
Extended Data Fig. 10. Adjusted HRs associated with GG versus AG genotype of ADH1B-rs1229984 for specific alcohol-associated diseases by ICD-10 chapters, in men and women.
Area-specific genotypic effects (GG vs. AG genotype) were estimated within each study area (thus each reflecting the purely genotypic effects) using age-at-risk-stratified and genomic principal components-adjusted Cox models and were combined by inverse-variance-weighted meta-analysis to yield the overall area-stratified genotypic associations. Each solid square represents HR for GG vs. AG genotype, with the area inversely proportional to the variance of the log HR. The horizontal lines indicate 95% CIs. Diseases considered to be alcohol-related by the WHO are indicated with ‘Y’ under the ‘WHO’ column. The ‘RC’ column indicates the number of study areas that contributed to the overall area-stratified genotypic associations, as for certain less common diseases some study areas may not have enough number of cases to contribute to the inverse-variance-weighted meta-analysis. The ‘P het’ column indicates the P value from a χ2 test for heterogeneity between sexes. All P values are two-sided. † Included less common ICD-10 codes within the corresponding ICD-10 chapter which were not individually investigated in the present study. CI, confidence interval; HR hazard ratio; ICD-10, International Classification of Diseases, 10th Revision; WHO, World Health Organization.

Similar articles

Cited by

References

    1. Shield K, et al. National, regional, and global burdens of disease from 2000 to 2016 attributable to alcohol use: a comparative risk assessment study. Lancet Public Health. 2020;5:e51–e61. - PubMed
    1. Manthey J, Shield KD, Rylett M, Hasan OSM, Probst C, Rehm J. Global alcohol exposure between 1990 and 2017 and forecasts until 2030: a modelling study. Lancet. 2019;393:2493–502. - PubMed
    1. Im PK, et al. Patterns and trends of alcohol consumption in rural and urban areas of China: findings from the China Kadoorie Biobank. BMC Public Health. 2019;19:217. - PMC - PubMed
    1. World Health Organization. Global Status Report on Alcohol and Health 2018 (World Health Organization, 2018).
    1. Corrao G, Bagnardi V, Zambon A, La, Vecchia C. A meta-analysis of alcohol consumption and the risk of 15 diseases. Prev. Med. 2004;38:613–9. - PubMed