. 2023 Jun;29(6):1563-1577.
doi: 10.1038/s41591-023-02327-2. Epub 2023 Jun 8.

An integrated cell atlas of the lung in health and disease

Lisa Sikkema  1   2 Ciro Ramírez-Suástegui #  1   3 Daniel C Strobl #  1   4 Tessa E Gillett #  5   6 Luke Zappia #  1   7 Elo Madissoon #  8 Nikolay S Markov #  9 Laure-Emmanuelle Zaragosi #  10 Yuge Ji  1   2 Meshal Ansari  1   11 Marie-Jeanne Arguel  10 Leonie Apperloo  6   12 Martin Banchero  6   12 Christophe Bécavin  10 Marijn Berg  6   12 Evgeny Chichelnitskiy  13 Mei-I Chung  14 Antoine Collin  10   15 Aurore C A Gay  6   12 Janine Gote-Schniering  11 Baharak Hooshiar Kashani  11 Kemal Inecik  1   2 Manu Jain  9 Theodore S Kapellos  11   16 Tessa M Kole  6   17 Sylvie Leroy  18 Christoph H Mayr  11 Amanda J Oliver  8 Michael von Papen  19 Lance Peter  14 Chase J Taylor  20 Thomas Walzthoeni  21 Chuan Xu  8 Linh T Bui  14 Carlo De Donno  1 Leander Dony  1   2   22 Alen Faiz  6   23 Minzhe Guo  24   25 Austin J Gutierrez  14 Lukas Heumos  1   2   11 Ni Huang  8 Ignacio L Ibarra  1 Nathan D Jackson  26 Preetish Kadur Lakshminarasimha Murthy  27   28 Mohammad Lotfollahi  1   8 Tracy Tabib  29 Carlos Talavera-López  1   30 Kyle J Travaglini  31   32   33 Anna Wilbrey-Clark  8 Kaylee B Worlock  34 Masahiro Yoshida  34 Lung Biological Network ConsortiumMaarten van den Berge  6   17 Yohan Bossé  35 Tushar J Desai  36 Oliver Eickelberg  37 Naftali Kaminski  38 Mark A Krasnow  31   32 Robert Lafyatis  29 Marko Z Nikolic  34 Joseph E Powell  39   40 Jayaraj Rajagopal  41 Mauricio Rojas  42 Orit Rozenblatt-Rosen  43   44 Max A Seibold  26   45   46 Dean Sheppard  47 Douglas P Shepherd  48 Don D Sin  49 Wim Timens  6   12 Alexander M Tsankov  50 Jeffrey Whitsett  24 Yan Xu  24 Nicholas E Banovich  14 Pascal Barbry  10   15 Thu Elizabeth Duong  51 Christine S Falk  13 Kerstin B Meyer  8 Jonathan A Kropski  20   52 Dana Pe'er  32   53 Herbert B Schiller  11 Purushothama Rao Tata  27 Joachim L Schultze  16   54 Sara A Teichmann  8   55 Alexander V Misharin  9 Martijn C Nawijn  6   12 Malte D Luecken  56   57 Fabian J Theis  58   59   60
Collaborators, Affiliations

An integrated cell atlas of the lung in health and disease

Lisa Sikkema et al. Nat Med. 2023 Jun.

Abstract

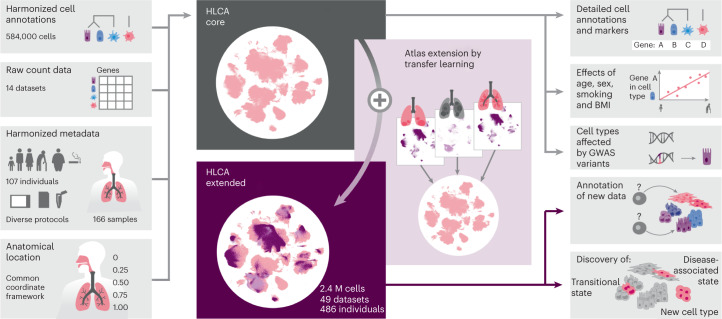
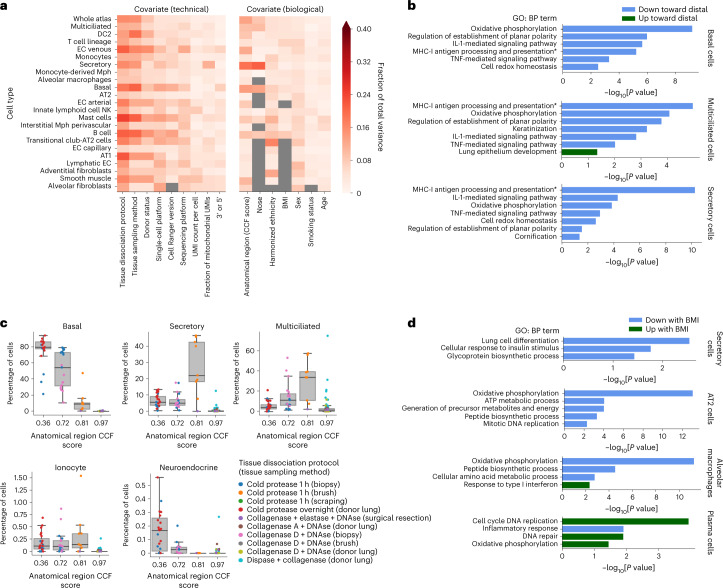
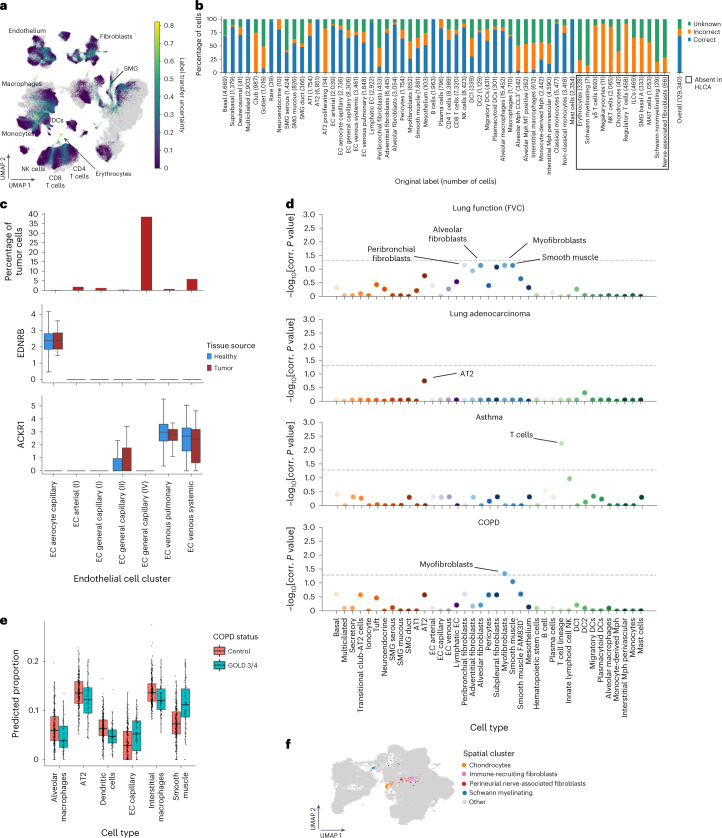
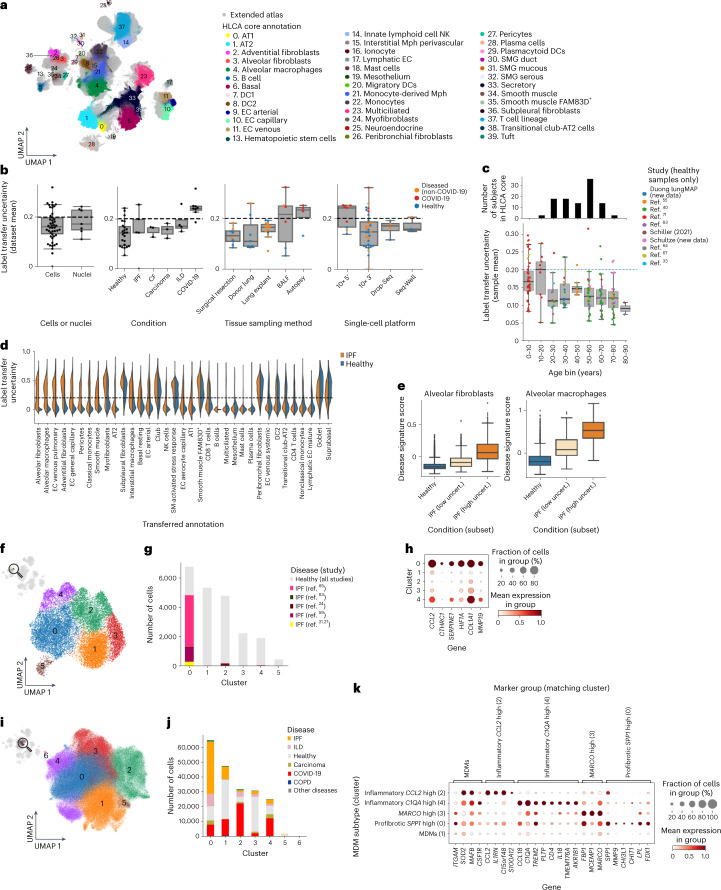
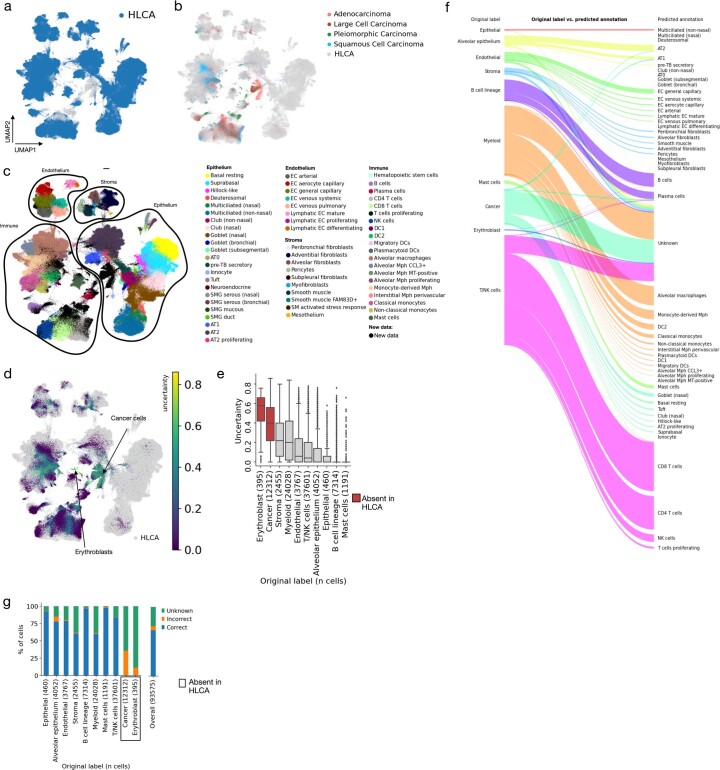
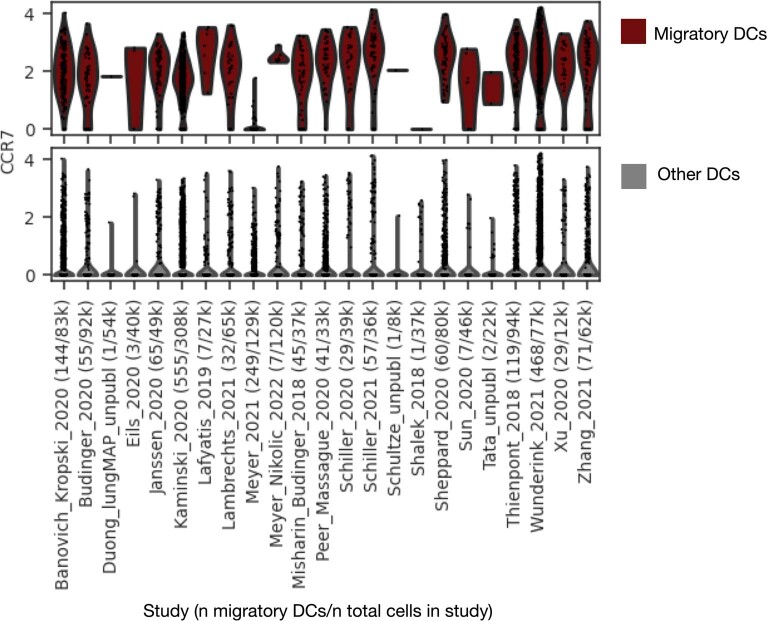
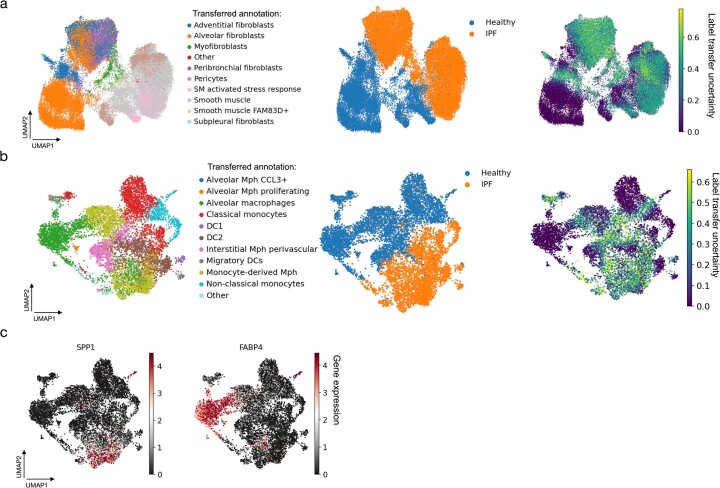
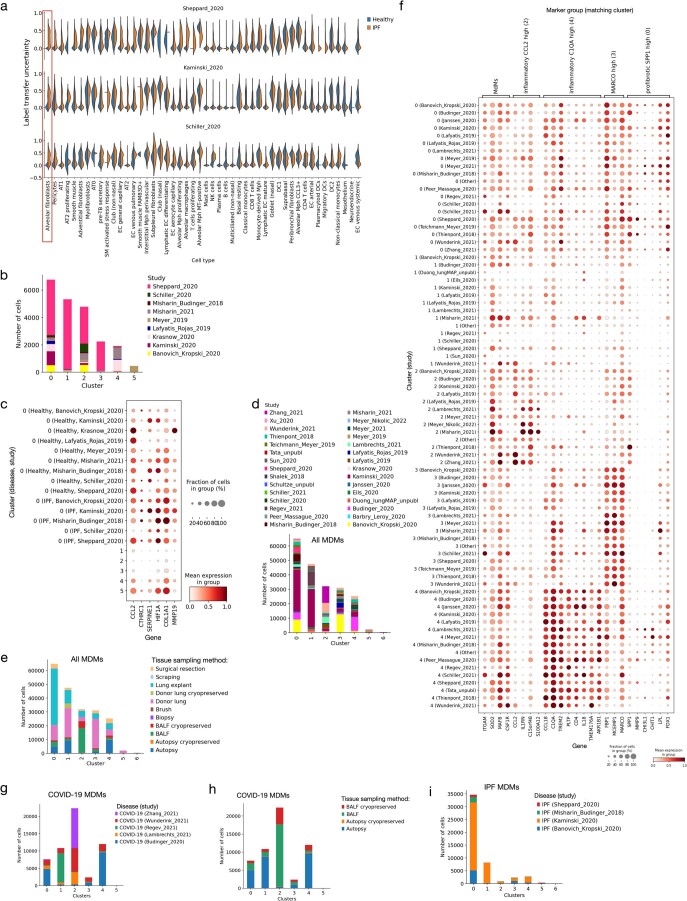
Single-cell technologies have transformed our understanding of human tissues. Yet, studies typically capture only a limited number of donors and disagree on cell type definitions. Integrating many single-cell datasets can address these limitations of individual studies and capture the variability present in the population. Here we present the integrated Human Lung Cell Atlas (HLCA), combining 49 datasets of the human respiratory system into a single atlas spanning over 2.4 million cells from 486 individuals. The HLCA presents a consensus cell type re-annotation with matching marker genes, including annotations of rare and previously undescribed cell types. Leveraging the number and diversity of individuals in the HLCA, we identify gene modules that are associated with demographic covariates such as age, sex and body mass index, as well as gene modules changing expression along the proximal-to-distal axis of the bronchial tree. Mapping new data to the HLCA enables rapid data annotation and interpretation. Using the HLCA as a reference for the study of disease, we identify shared cell states across multiple lung diseases, including SPP1+ profibrotic monocyte-derived macrophages in COVID-19, pulmonary fibrosis and lung carcinoma. Overall, the HLCA serves as an example for the development and use of large-scale, cross-dataset organ atlases within the Human Cell Atlas.


Conflict of interest statement

P.R.T. serves as a consultant for Surrozen, Cellarity and Celldom and is currently acting Chief Executive Officer of Iolux. F.J.T. consults for Immunai, Singularity Bio, CytoReason and Omniscope and has ownership interest in Dermagnostix and Cellarity. In the past 3 years, M.D.L. was a contractor for the CZI and received remuneration for talks at Pfizer and Janssen Pharmaceuticals. J.A.K. reports grants/contracts from Boehringer Ingelheim and Bristol Myers Squibb, consulting fees from Janssen and Boehringer Ingelheim and study support from Genentech and is a member of the scientific advisory board of APIE Therapeutics. In the past 3 years, S.A.T. has received remuneration for consulting and Scientific Advisory Board membership from Genentech, Roche, Biogen, GlaxoSmithKline, Foresite Labs and Qiagen. S.A.T. is a co-founder and board member of and holds equity in Transition Bio. D.S. is a founder of Pliant Therapeutics and a member of the Genentech Scientific Advisory Board and has a sponsored research agreement with AbbVie. N.K. served as a consultant to Boehringer Ingelheim, Third Rock, Pliant, Samumed, NuMedii, Theravance, LifeMax, Three Lakes Partners, Optikira, AstraZeneca, RohBar, Veracyte, Augmanity, CSL Behring, Galapagos and Thyron over the past 3 years and reports equity in Pliant and Thyron, grants from Veracyte, Boehringer Ingelheim and Bristol Myers Squibb and nonfinancial support from miRagen and AstraZeneca. N.K. owns intellectual property on novel biomarkers and therapeutics in IPF licensed to biotechnology. O.R.-R. is a co-inventor on patent applications (PCT/US2016/059233, PCT/US2018/064553, PCT/US2018/060860, PCT/US2017/016146, PCT/US2019/055894, PCT/US2018/064563, PCT/US2020/032933) filed by the Broad Institute for inventions related to single-cell genomics. O.R.-R. has been an employee of Genentech since 19 October 2020 and has equity in Roche. O.E. serves in an advisory capacity to Pieris Pharmaceuticals, Blade Therapeutics, Delta 4 and YAP Therapeutics. Y.B. holds a Canada Research Chair in the Genomics of Heart and Lung Diseases. The remaining authors declare no competing interests.

Figures

Fig. 1
Fig. 1. HLCA study overview.
Harmonized cell annotations, raw count data, harmonized patient and sample metadata and sample anatomical locations encoded into a CCF were collected and generated as input for the HLCA core (left). After integration of the core datasets, the atlas was extended by mapping 35 additional datasets, including disease samples, to the HLCA core, bringing the total number of cells in the extended HLCA to 2.4 million (M). The HLCA core provides detailed consensus cell annotations with matched consensus cell type markers (top right), gene modules associated with technical, demographic and anatomical covariates in various cell types (middle right), GWAS-based association of lung conditions with cell types (middle right) and a reference projection model to annotate new data (middle right) and discover previously undescribed cell types, transitional cell states and disease-associated cell states (right, bottom).
Fig. 2
Fig. 2. Composition and construction of the HLCA core.
a, Donor and sample composition in the HLCA core for demographic and anatomical variables. Donors/samples without annotation are shown as not available (NA; gray bars) for each variable. For the anatomical region CCF score, 0 represents the most proximal part of the lung and airways (nose) and 1 represents the most distal (distal parenchyma). Donors show diversity in ethnicity (harmonized metadata proportions: 65% European, 14% African, 2% admixed American, 2% mixed, 2% Asian, 0.4% Pacific Islander and 14% unannotated; see Methods), smoking status (52% never, 16% former, 15% active and 17% NA), sex (60% male and 40% female), age (ranging from 10–76 years) and BMI (20–49; 30% NA). b, Overview of the HLCA core cell type composition for the first three levels of cell annotation, based on harmonized original labels. In the cell type hierarchy, the lowest level (1) consists of the coarsest possible annotations (that is, epithelial (48% of cells), immune (38%), endothelial (9%) and stromal (4%)). Higher levels (2–5) recursively break up coarser-level labels into finer ones (Methods). Cells were set to ‘none’ if no cell type label was available at the level. Cell labels making up less than 0.02% of all cells are not shown. Overall, 94, 66 and 7% of cells were annotated at levels 3, 4 and 5, respectively. c, Cell type composition per sample, based on level 2 labels. Samples are ordered by anatomical region CCF score. d, Summary of the dataset integration benchmarking results. Batch correction score and biological conservation score each show the mean across metrics of that type, as shown in Supplementary Fig. 1, with metric scores scaled to range from 0 to 1. Both Scanorama and fastMNN were benchmarked on two distinct outputs: the integrated gene expression matrix and integrated embedding (see output). The methods are ordered by overall score. For each method, the results are shown only for their best-performing data preprocessing. Methods marked with an asterisk use coarse cell type labels as input. Preprocessing is specified under HVG (that is, whether or not genes were subsetted to the 2,000 (HVG) or 6,000 (FULL) most highly variable genes before integration) and scaling (whether genes were left unscaled or scaled to have a mean of 0 and a standard deviation of 1 across all cells). EC, endothelial cell; NK, natural killer; Bioconserv., conservation of biological signal.
Fig. 3
Fig. 3. The HLCA core conserves detailed biology and enables consensus-driven annotation.
a, A UMAP of the integrated HLCA, colored by level 1 annotation. b, Cluster label disagreement (label entropy) of Leiden 3 clusters of the HLCA. The HLCA was split into three parts (immune, epithelial and endothelial/stromal) for ease of visualization. Cells from every cluster are colored by label entropy. Clusters with less than 20% of cells annotated at level 3 are colored gray. c, Cell type label composition of the immune cluster with the most label disagreement (left), with original labels (middle left) and matching manual re-annotations (middle right). A zoom-in on the UMAP from b shows the final re-annotations (right). d, UMAPs of the immune, epithelial and endothelial/stromal parts of the HLCA core with cell annotations from the expert manual re-annotation. e, Percentage of cells originally labeled correctly, mislabeled or underlabeled (that is, only labeled at a coarser level) compared with final manual re-annotations. The percentages were calculated per manual annotation, as well as across all cells (right bar). f, UMAP of HLCA clusters annotated as rare epithelial cell types (that is, ionocytes, neuroendocrine cells and tuft cells). Final annotations, original labels and the study of origin are shown (top), as well as the expression of ionocyte marker FOXI1, tuft cell marker LRMP and neuroendocrine marker CALCA (bottom). g, Log-normalized expression of the migratory dendritic cell marker CCR7 in cells identified during re-annotation as migratory dendritic cells, versus other dendritic cells. AT, alveolar type; DC, dendritic cell; FB, fibroblast; Mph, macrophage; MT, metallothionein; SM, smooth muscle; SMG, submucosal gland; TB, terminal bronchiole.
Fig. 4
Fig. 4. Demographic and technical variables driving interindividual variation.
a, Fraction of total inter-sample variance in the HLCA core integrated embedding that correlates with specific covariates. Covariates are split into technical (left) and biological covariates (right). Cell types are ordered by the number of samples in which they were detected. Only cell types present in at least 40 samples are shown. Tissue sampling method represents the way a sample was obtained (for example, surgical resection or nasal brush). Donor status represents the state of the donor at the moment of sample collection (for example, organ donor, diseased alive or healthy alive). The heatmap is masked gray where fewer than 40 samples were annotated for a specific covariate or where only one value was observed for all samples for that cell type. b, Selection of gene sets that are significantly associated with anatomical location CCF score, in different airway epithelial cell types. All gene set names are Gene Ontology biological process (GO: BP) terms. Sets upregulated toward distal lungs are shown in green, whereas sets downregulated are shown in blue. The full name of the term marked by an asterisk is ‘Antigen processing and presentation of exogenous peptide antigen via MHC-I’. c, Cell type proportions per sample, along the proximal-to-distal axis of the respiratory system. The lowest and highest CCF scores shown (0.36 and 0.97) represent the most proximal and most distal sampled parts of the respiratory system, respectively (trachea and parenchyma), excluding the upper airways. The dots are colored by the tissue dissociation protocol and tissue sampling method used for each sample. The boxes show the median and interquartile range of the proportions. Samples with proportions more than 1.5 times the interquartile range away from the high and low quartile are considered outliers. Whiskers extend to the furthest nonoutlier point. n = 23, 19, 9 and 90 for CCF scores 0.36, 0.72, 0.81 and 0.97, respectively. d, Selection of gene sets significantly up- (green) or downregulated (blue) with increasing BMI, in four different cell types. For b and d, P values were calculated using correlation-adjusted mean-rank gene set tests (Methods) and false discovery rate corrected using the Benjamini–Hochberg procedure. IL-1, interleukin-1; MHC-I, major histocompatibility complex class I; TNF, tumor necrosis factor.
Fig. 5
Fig. 5. The HLCA core serves as a reference for label transfer and data contextualization.
a, UMAP of the jointly embedded HLCA core (gray) and the projected healthy lung dataset (colored by label transfer uncertainty). HLCA cell types surrounding regions of high uncertainty are labeled. b, Percentage of cells from the newly mapped healthy lung dataset that are annotated either correctly or incorrectly by label transfer annotation or annotated as unknown, split by original cell type label (number of cells in parentheses). Cell type labels not present in the HLCA are boxed. c, Top, percentage of cells derived from tumor tissue, per endothelial cell cluster from the joint HLCA core and lung cancer data embedding. Only clusters with at least ten tumor cells are shown. Clusters are named based on the dominant HLCA core cell type annotation in the cluster. Middle, box plot showing the expression of EDNRB in endothelial cell clusters, split by tissue source. Bottom, as in the middle plot but for the expression of ACKR1. Numbers of cells per group were as follows: 6,574 (endothelial cell aerocyte capillary), 7,379 (endothelial cell arterial (I)), 10,906 (endothelial cell general capillary (I)), 3,440 (endothelial cell general capillary (II)), 2,859 (endothelial cell general capillary (III)), 6,318 (endothelial cell venous pulmonary) and 7,161 (endothelial cell venous systemic). d, Association of HLCA cell types with four different lung phenotypes based on previously performed GWASs. The horizontal dashed lines indicate a significance threshold of α = 0.05. P values were calculated using linkage disequilibrium score regression (Methods) and multiple testing corrected with the Benjamini–Hochberg procedure. e, Cell type proportions in lung bulk expression samples as estimated from HLCA-based cell type deconvolution, comparing controls (n = 281) versus donors with severe COPD (GOLD stage 3/4; n = 83). f, UMAP of fibroblast-dominated clusters from the jointly embedded HLCA core and mapped healthy lung dataset, colored by spatial cluster, with cells outside of the indicated clusters colored in gray. For all boxplots, the boxes show the median and interquartile range. Data points more than 1.5 times the interquartile range outside the low and high quartile are considered outliers. In c, these are not shown (see Supplementary Fig. 6 for full results), whereas in e, they are shown. Whiskers extend to the furthest nonoutlier point. corr., corrected; FVC, forced vital capacity; MAIT cells, mucosal-associated invariant T cells; NKT cells, natural killer T cells.
Fig. 6
Fig. 6. The extended HLCA enables the identification of disease-associated cell states.
a, UMAP of the extended HLCA colored by coarse annotation (HLCA core) or in gray (cells mapped to the core). b, Uncertainty of label transfer from the HLCA core to newly mapped datasets, categorized by several experimental or biological features. Categories with fewer than two instances are not shown. The numbers of datasets per category were as follows: 30 cells, 7 nuclei, 23 healthy, 5 IPF, 3 CF, 3 carcinoma, 4 ILD, 8 surgical resection, 7 donor lung, 12 lung explant, 6 bronchoalveolar lavage fluid, 4 autopsy, 9 10x 5′, 31 10x 3′, 4 Drop-Seq and 3 Seq-Well. c, Bottom, mean label transfer uncertainty per mapped healthy lung sample in the HLCA extension, grouped into age bins and colored by study. The numbers of mapped samples per age bin were as follows: 43 for 0–10 years, 33 for 10–20 years, 31 for 20–30 years, 23 for 30–40 years, 19 for 40–50 years, 12 for 50–60 years, 9 for 60–70 years, 8 for 70–80 years and 2 for 80–90 years. Top, bar plot showing the number of donors per age group in the HLCA core. d, Violin plot of label transfer uncertainty per transferred cell type label for a single mapped IPF dataset, split into cells from healthy donors (blue) and donors with IPF (orange). e, Uncertainty-based disease signature scores among alveolar fibroblasts and alveolar macrophages, split into cells from control donors (n = 10,453 and 1,812, respectively), and low-uncertainty cells (n = 1,419 and 200, respectively) and high-uncertainty cells (n = 1,172 and 162, respectively) from donors with IPF. f, UMAP embedding of alveolar fibroblasts (labeled with manual annotation (core) or label transfer (five IPF datasets)) colored by Leiden cluster. g, Composition of the clusters shown in f by study, with cells from control samples colored in gray. h, Expression of marker genes for IPF-enriched cluster 0 per alveolar fibroblast cluster. Cluster 5 was excluded as 96% of its cells were from a single donor. i, UMAP of all MDMs in the HLCA, colored by Leiden cluster. j, Composition of the MDM clusters from i by disease. k, Expression of cluster marker genes among all MDM clusters excluding donor-specific clusters 5 and 6. For h and k, mean counts were normalized such that the highest group mean was set to 1 for each gene. For b, c and e, the boxes show the median and interquartile range. Data points more than 1.5 times the interquartile range outside the low and high quartile are considered outliers. Whiskers extend to the furthest nonoutlier point. BALF, bronchoalveolar lavage fluid; CF, cystic fibrosis; Drop-Seq, droplet sequencing; ILD, interstitial lung disease; Mph, macrophages; SM, smooth muscle; uncert., uncertainty.
Extended Data Fig. 1
Extended Data Fig. 1. HLCA cluster donor diversity and marker expression for a cluster with high cell type label disagreement.
a, Donor diversity is calculated for every cluster as entropy of donor proportions in the cluster, with high entropy indicating the cluster contains cells from many different donors. Most clusters (80 out of 94) contain cells from many donors (median 47 donors per cluster, range 2–102), as illustrated by high donor entropy (>0.43), whereas 14 clusters show low donor diversity. These are largely immune cell clusters (n=13, of which 7 macrophage clusters, 4 T cell clusters and 2 mast cell clusters), representing donor- or group-specific phenotypes. Matching cell type annotations are shown in Fig. 3d. b, Marker expression among cells from the immune cluster with highest disagreement in original cell type labels (high ‘label entropy’). DC2, monocyte and macrophage marker expression is shown for cells from Fig. 3c. Cells are labeled by their final annotation, as well as their original label. Log-normalized counts are scaled such that for each gene the 99th expression percentile, as calculated among all cells included in the heatmap, is set to 1. DC: dendritic cell.
Extended Data Fig. 2
Extended Data Fig. 2. HLCA core cell type composition details.
a, Percentage of cells from each of the 11 studies included in the HLCA core, shown per cell type (3 studies include 2 separate datasets). Each cell type was detected in at least 4 out of 14 datasets, with a median of 11 datasets in which a cell type was detected, and a maximum of 14. b, Percentage of cells from each of the three anatomical locations, shown per cell type. c, Percentage of cells with at least one UMI count for MKI67, a marker gene of proliferating cells, shown per cell type. AT: alveolar type. TB: terminal bronchiole. SMG: submucosal gland. DC: dendritic cell. Mph: macrophage. NK: natural killer. MT: metallothionein. SM: smooth muscle. EC: endothelial cell.
Extended Data Fig. 3
Extended Data Fig. 3. Marker gene expression for all 61 cell types in the HLCA core.
Expression is shown within each cell type compartment. a, Epithelial cell type markers, b, Immune cell type markers, c, Stromal cell type markers, d, Endothelial cell type markers. Expression was normalized such that the maximum group expression of cells within the compartment for each marker was set to 1. Marker gene sets include both sets that mark groups of cell types (for example ‘epithelial’) and single cell types (for example ‘basal resting’). For each marker gene set, cell types identified by the set are boxed. AT: alveolar type. TB: terminal bronchiole. SMG: submucosal gland. DC: dendritic cell. Mph: macrophage. NK: natural killer. MT: metallothionein. SM: smooth muscle. EC: endothelial cell.
Extended Data Fig. 4
Extended Data Fig. 4. Marker expression of several rare and novel cell types detected in the HLCA.
a, A UMAP embedding of all cells annotated as dendritic cells, colored by final detailed annotation (left), and by expression of three migratory DC marker genes (right, CCR7, LAD1, and CCL19). b, Expression of migratory DC marker genes from a among migratory DCs (red, right half of violins) versus other DCs (gray, left half of violins), split by study. Number of migratory DCs per study is specified in the x-axis labels. c, Expression of markers for two novel immune cell types (hematopoietic stem cells and migratory DCs, found in 9 and 10 out of 11 studies, respectively), shown per stromal cell type. d, Expression of markers for three novel epithelial cell types (hillock-like, AT0, and pre-TB secretory cells, found in 9, 9, and 11 out of 11 studies, respectively), shown per epithelial cell type. Two markers shared between AT0 and pre-TB secretory cells are also included. e, Expression of markers for a novel stromal cell type (‘smooth muscle FAM83D+’, found in 8 out of 11 studies), including three general smooth muscle marker genes and one marker gene uniquely expressed in FAM83D+ smooth muscle cells (FAM83D), shown per stromal cell type. For c-e, gene counts were normalized such that the maximum expression of a group of cells in the plot was set to 1. f, FAM83D expression across stromal cell types. Cells annotated as FAM83D+ smooth muscle are split by study. Studies with fewer than 3 smooth muscle FAM83D+ cells are not shown. DC: dendritic cell. Mph: macrophage. MT: metallothionein. AT: alveolar type. SMG: submucosal gland. TB: terminal bronchiole.
Extended Data Fig. 5
Extended Data Fig. 5. Cell type proportions per sample along the proximal-to-distal axis of the lung.
All cell types not included in Fig. 4b are shown. The lowest and highest CCF score shown (0.36, 0.97) represent the most proximal and most distal sampled parts of the respiratory system, respectively (trachea and parenchyma), excluding the upper airways. Dots are colored by the tissue dissociation protocol and tissue sampling method used for the sample. Boxes show median and interquartile range of the proportions. Samples with proportions more than 1.5 times the interquartile range away from the high and low quartile are considered outliers. Whiskers extend to the furthest non-outlier point. n=23, 19, 9 and 90 for CCF score 0.36, 0.72, 0.81 and 0.97, respectively. AT: alveolar type. DC: dendritic cell. EC: endothelial cell. NK: natural killer. Mph: macrophages. SMG: submucosal gland.
Extended Data Fig. 6
Extended Data Fig. 6. Mapping of unseen healthy lung scRNA-seq data to the HLCA core.
a, UMAP of the jointly embedded HLCA core (dark blue, plotted on top) and the newly mapped healthy lung data (gray). b, Same as a, but now plotting cells from the HLCA in gray, and cells from the new data on top in light blue. c, Same as a, but now coloring cells from the HLCA core by their final annotation, and coloring cells from the new data in black. Cells from each of the compartments are outlined to ease visual identification of cell types by colors. d, Uncertainty of label transfer (ranging from 0 to 1) for cells from the mapped data, subdivided by original cell type label. Number of cells per label is shown between brackets. Cell labels are ordered by mean uncertainty. Boxes of cell labels not present in the HLCA core are colored red. Boxes show median and interquartile range of uncertainty. Cells with uncertainties more than 1.5 times the interquartile range away from the high and low quartile are considered outliers and plotted as points. Whiskers extend to the furthest non-outlier point. e, Sankey plot of original labels of cells from the mapped dataset versus predicted annotations based on label transfer. Cells with uncertainty >0.3 are labeled ‘unknown’. AT: alveolar type. DC: dendritic cells. EC: endothelial cells. ILCs: innate lymphoid cells. MAIT cells: mucosal-associated invariant T cells. MT: metallothionein. Mph: macrophages. NK: natural killer. NKT cells: natural killer T cells. SM: smooth muscle. SMG: submucosal gland. TB: terminal bronchiole.
Extended Data Fig. 7
Extended Data Fig. 7. Mapping of unseen lung cancer data to the HLCA.
a, UMAP of the jointly embedded HLCA (dark blue, plotted on top) and lung cancer data (gray). b, Same as a, but now plotting cells from the HLCA core in gray. Cells from the mapped data are plotted on top, and colored by the cancer type of the patient. c, Same as a, but now coloring cells from the HLCA core by their final final annotation, and coloring cells from the mapped cancer data in black. Cells from each of the compartments are outlined to ease visual identification of cell types by colors. d, Uncertainty of label transfer, shown for all cells from the mapped data. Regions dominated by high-uncertainty cells are labeled by the original cell type label. Cells from the HLCA core are colored in gray. e, Uncertainty of label transfer (ranging from 0 to 1) for the mapped cells, subdivided by original cell type label. Number of cells per label is shown between brackets. Boxes of cell type labels not present in the HLCA core are colored red. Cell types are ordered by mean uncertainty. Boxes show median and interquartile range of uncertainty. Cells with uncertainties more than 1.5 times the interquartile range away from the high and low quartile are considered outliers and plotted as points. Whiskers extend to the furthest non-outlier point. f, Sankey plot of original labels of the mapped data versus predicted annotations based on label transfer. Cells with uncertainty >0.3 are labeled ‘unknown’. g, Percentage of cells from newly mapped healthy lung dataset that are either annotated correctly or incorrectly by label transfer annotation (matched at the level of the original labels), or annotated as unknown, subdivided by original cell type label. The number of cells in the mapped dataset labeled with each label are shown between brackets after cell type names. Cell type labels not present in the HLCA are boxed. AT: alveolar type. DC: dendritic cells. EC: endothelial cells. MT: metallothionein. Mph: macrophages. NK: natural killer. SM: smooth muscle. SMG: submucosal gland. TB: terminal bronchiole.
Extended Data Fig. 8
Extended Data Fig. 8. Expression of CCR7 among cells annotated as migratory DCs by label transfer.
Expression of CCR7 is shown for all cells that were annotated as migratory DCs with low uncertainty (<0.2) (top) and all other cells annotated as DC (bottom) by label transfer from the HLCA core to the extended HLCA. Cells are grouped based on study of origin (some studies contain multiple datasets). X-tick labels show study, number of cells annotated as migratory DCs, and number of total cells (in thousands) per study. CCR7 counts shown are counts that were normalized based on the total count among 2000 genes used for mapping to the HLCA core, and then log-transformed. DCs: dendritic cells.
Extended Data Fig. 9
Extended Data Fig. 9. Transferred labels and matching uncertainty for a mapped IPF dataset.
a, UMAPs of cells originally labeled as stroma, from a mapped IPF dataset including both healthy and IPF samples. Cells are labeled by annotation transferred from the HLCA core (left), by disease status (middle), and by label transfer uncertainty (right). Cells with labels transferred to fewer than 10 cells were excluded. b, same as a, but showing cells originally labeled as macrophages. c, As b, but now colored by expression of SPP1 and FABP4. SM: smooth muscle. Mph: macrophages. DC: dendritic cells.
Extended Data Fig. 10
Extended Data Fig. 10. Disease-specific cellular states and states shared across diseases in the extended HLCA.
a, Label transfer uncertainty shown per cell type, comparing cells from control samples (‘healthy’, blue) to cells from IPF samples (orange). Results are shown per dataset, only showing datasets that include both control and IPF mapped samples. Alveolar fibroblasts, the cell type chosen for downstream analysis, are boxed in red. AT: alveolar type. DC: dendritic cell. TB: terminal bronchiole. EC: endothelial cell. Mph: macrophage. MT: metallothionein. NK: natural killer. SM: smooth muscle. b, Composition of alveolar fibroblast clusters by study. c, Expression of several genes highly expressed in IPF-enriched alveolar fibroblast cluster 0, shown per cluster. Cluster 0 is split into control (‘Healthy’) and IPF, further subdivided by study. d, Composition of monocyte-derived macrophage (MDM) clusters by study. e, As d, but by tissue sampling method. f, Expression of MDM cluster marker genes shown per cluster, with clusters split into studies. Studies with fewer than 200 were grouped into ‘Other’ for each cluster. g, Composition of MDM clusters by study, subsetted to only cells from donors with COVID-19. h, As g, but by tissue sampling method. i, As g, but subsetted to cells from donors with IPF. For c and f, mean expressions were normalized such that the highest mean expression was set to 1 for each gene. BALF: bronchoalveolar lavage fluid. IPF: idiopathic pulmonary fibrosis.

Similar articles

Cited by

References

    1. Angerer P, et al. Single cells make big data: new challenges and opportunities in transcriptomics. Curr. Opin. Syst. Biol. 2017;4:85–91. doi: 10.1016/j.coisb.2017.07.004. - DOI
    1. Regev A, et al. The Human Cell Atlas. eLife. 2017;6:e27041. doi: 10.7554/eLife.27041. - DOI - PMC - PubMed
    1. HuBMAP Consortium. The human body at cellular resolution: the NIH Human Biomolecular Atlas Program. Nature. 2019;574:187–192. doi: 10.1038/s41586-019-1629-x. - DOI - PMC - PubMed
    1. Vieira Braga FA, et al. A cellular census of human lungs identifies novel cell states in health and in asthma. Nat. Med. 2019;25:1153–1163. doi: 10.1038/s41591-019-0468-5. - DOI - PubMed
    1. Travaglini KJ, et al. A molecular cell atlas of the human lung from single-cell RNA sequencing. Nature. 2020;587:619–625. doi: 10.1038/s41586-020-2922-4. - DOI - PMC - PubMed

Grants and funding